

Key Insights
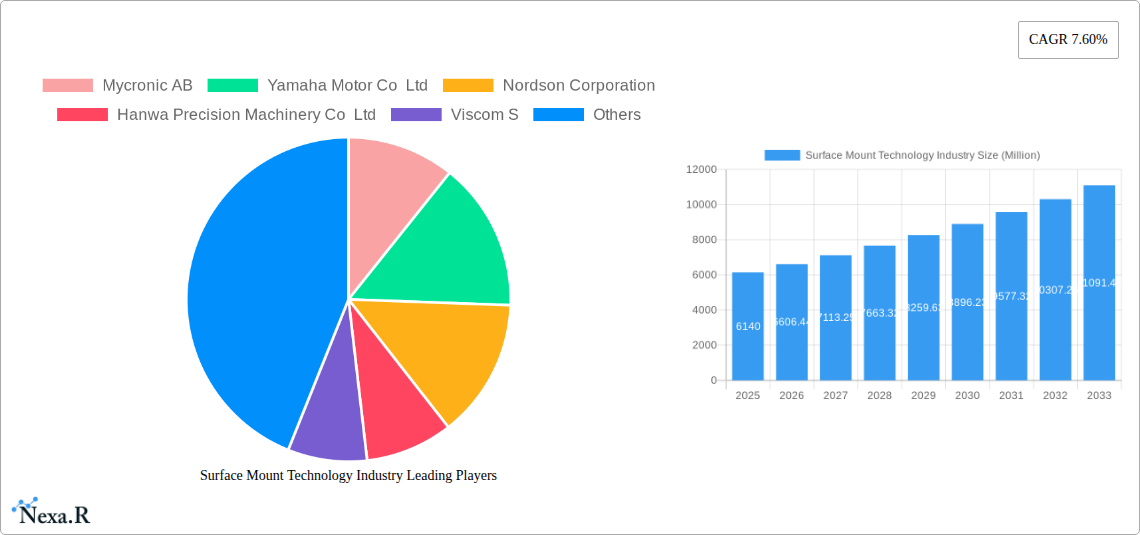
The Surface Mount Technology (SMT) industry, valued at $6.14 billion in 2025, is poised for robust growth, exhibiting a Compound Annual Growth Rate (CAGR) of 7.60% from 2025 to 2033. This expansion is fueled by several key drivers. The increasing demand for miniaturized and sophisticated electronic devices in consumer electronics, particularly smartphones and wearables, is a significant catalyst. Furthermore, the automotive industry's shift towards electric vehicles and advanced driver-assistance systems (ADAS) necessitates high-volume, high-precision SMT placement, boosting market growth. The industrial automation sector's adoption of smart manufacturing practices and the rise of the Internet of Things (IoT) also contribute to increased demand for SMT solutions. Growth within the aerospace and defense sectors, driven by the need for reliable and miniaturized electronics in aircraft and defense systems, further propels market expansion. While challenges such as supply chain disruptions and fluctuating raw material prices exist, the overall market outlook remains positive due to the aforementioned strong growth drivers across diverse end-use sectors.
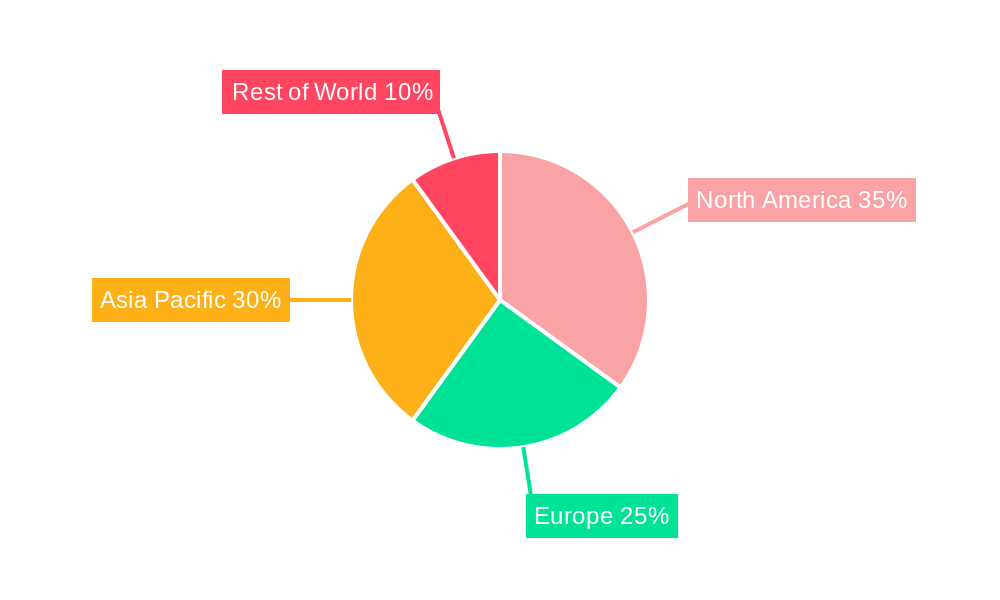
The segmentation of the SMT market reveals insightful trends. Active components, including integrated circuits and microprocessors, constitute a larger share of the market compared to passive components like resistors and capacitors, reflecting the increasing complexity of electronic devices. Geographically, North America and Asia Pacific are expected to dominate the market, driven by strong manufacturing bases and substantial demand for electronics. Within Asia Pacific, China and other Southeast Asian countries represent significant growth opportunities due to their expanding electronics manufacturing sectors. Europe also holds a considerable market share, underpinned by the presence of established electronics manufacturers and a strong focus on technological innovation. Key players in the SMT industry, including Mycronic AB, Yamaha Motor Co Ltd, and Nordson Corporation, are continually investing in research and development to enhance the precision, speed, and automation capabilities of their SMT equipment, further driving market expansion and competition. The projected market value in 2033 can be estimated by applying the CAGR to the 2025 value, indicating substantial growth over the forecast period.
Surface Mount Technology (SMT) Industry Market Report: 2019-2033
This comprehensive report provides an in-depth analysis of the Surface Mount Technology (SMT) industry, encompassing market dynamics, growth trends, regional dominance, product landscape, key players, and future outlook. The report covers the period 2019-2033, with a focus on the base year 2025 and forecast period 2025-2033. This detailed analysis is crucial for industry professionals, investors, and stakeholders seeking to understand the intricacies and future potential of this rapidly evolving market. The report segments the market by component (passive components, capacitors, active components) and end-user industry (consumer electronics, automotive, industrial electronics, aerospace & defense, healthcare, other).
Surface Mount Technology Industry Market Dynamics & Structure
The SMT industry is characterized by a moderately concentrated market structure, with key players such as Mycronic AB, Yamaha Motor Co Ltd, Nordson Corporation, and ASMPT holding significant market share. Technological innovation, driven by increasing demand for miniaturization and higher production efficiency, is a major driver. Stringent regulatory frameworks related to environmental compliance and product safety influence manufacturing processes. Competitive substitutes, such as through-hole technology, are limited due to SMT's advantages in density and cost-effectiveness. End-user demographics, particularly in rapidly growing electronics sectors like consumer electronics and automotive, significantly impact market demand. M&A activity in the SMT industry has been relatively steady, with xx deals recorded in the historical period (2019-2024), driven by the desire for market consolidation and technological access.
- Market Concentration: Moderate, with top 5 players holding approximately xx% market share in 2025.
- Technological Innovation: Focus on AI-driven automation, higher precision placement, and miniaturization.
- Regulatory Framework: Compliance with RoHS, REACH, and other environmental regulations.
- Competitive Substitutes: Limited due to SMT's advantages in miniaturization and cost-effectiveness for high-volume production.
- M&A Activity: xx deals (2019-2024), primarily focused on expanding market presence and technological capabilities.
- Innovation Barriers: High capital investment requirements for advanced equipment and skilled labor shortages.
Surface Mount Technology Industry Growth Trends & Insights
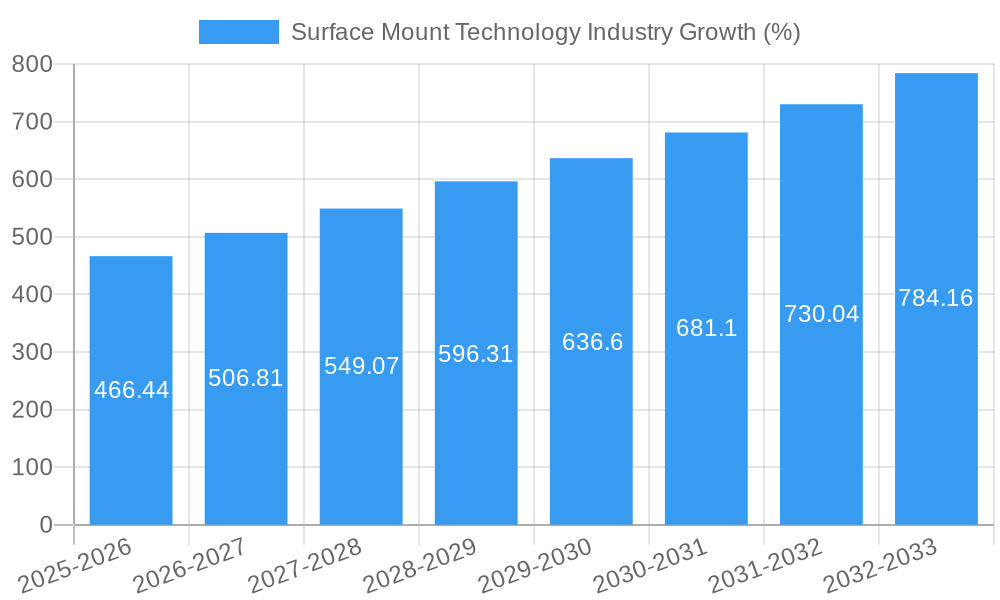
The global SMT market experienced robust growth during the historical period (2019-2024), reaching xx million units in 2024. This growth is primarily driven by the increasing demand for electronic devices across various end-user industries. The market is projected to maintain a healthy Compound Annual Growth Rate (CAGR) of xx% during the forecast period (2025-2033), reaching xx million units by 2033. The rising adoption of SMT in automotive electronics, industrial automation, and 5G infrastructure is a significant growth catalyst. Technological disruptions, such as the rise of AI-powered automated systems and advanced materials, continue to reshape the market landscape. Consumer behavior shifts, including preferences for smaller, faster, and more efficient electronics, further fuel market growth. Market penetration in emerging economies is expected to increase significantly.
Dominant Regions, Countries, or Segments in Surface Mount Technology Industry
The Asia-Pacific region, particularly China, dominates the SMT market, driven by a robust electronics manufacturing sector and strong government support for technological advancements. The region's large consumer electronics market and a rapidly expanding automotive industry fuel high demand. Within components, passive components currently hold the largest market share (xx%), followed by active components (xx%). In the end-user industry segment, consumer electronics leads with the highest volume (xx million units) due to high demand for smartphones, wearables, and other consumer electronics. Automotive is a fast-growing segment, projected to achieve a CAGR of xx% due to advancements in automotive electronics.
- Key Drivers in Asia-Pacific: Low manufacturing costs, large consumer base, government initiatives to support technological advancements.
- Consumer Electronics Dominance: Driven by the high volume of smartphones, tablets, and other electronics being manufactured.
- Automotive Segment Growth: Fueled by the increasing adoption of advanced driver-assistance systems (ADAS) and electric vehicles.
- North America Market: Moderate growth projected driven by defense and aerospace sectors and ongoing investments in semiconductor manufacturing.
Surface Mount Technology Industry Product Landscape
The SMT industry offers a wide range of products, including pick-and-place machines, reflow ovens, inspection systems, and soldering equipment. Recent innovations focus on higher precision, faster throughput, and increased automation. Key features include AI-powered vision systems for improved accuracy, flexible automated systems for swift changeovers, and advanced materials for better thermal management. These advancements improve efficiency and reduce production costs while enhancing product quality.
Key Drivers, Barriers & Challenges in Surface Mount Technology Industry
Key Drivers:
- Increasing demand for miniaturized electronics across various end-user industries.
- Growing adoption of advanced driver-assistance systems (ADAS) and electric vehicles in the automotive sector.
- Investments in 5G infrastructure and related technologies.
- Government initiatives and incentives to promote technological advancements in electronics manufacturing.
Challenges & Restraints:
- Supply chain disruptions and component shortages, potentially impacting production output and costs.
- Fluctuations in raw material prices.
- Increasing competition among established players and the emergence of new entrants.
- Regulatory compliance and environmental concerns.
Emerging Opportunities in Surface Mount Technology Industry
- Expansion into emerging markets with high growth potential.
- Development of innovative applications for SMT technology in emerging sectors, such as medical devices and wearable technology.
- Focus on sustainable and environmentally friendly manufacturing processes.
- Growing demand for advanced packaging technologies.
Growth Accelerators in the Surface Mount Technology Industry
Long-term growth will be propelled by advancements in AI-powered automation, enabling higher precision and throughput. Strategic partnerships between SMT equipment manufacturers and electronics companies will drive innovation and adoption. Expansion into new markets, particularly in emerging economies, offers significant growth potential.
Key Players Shaping the Surface Mount Technology Industry Market
- Mycronic AB
- Yamaha Motor Co Ltd
- Nordson Corporation
- Hanwa Precision Machinery Co Ltd
- Viscom S
- Juki Corporation
- Zhejiang Neoden Technology Co Ltd
- Fuji Corporation
- Europlacer Limited
- ASMPT
- Panasonic Corporation
Notable Milestones in Surface Mount Technology Industry Sector
- June 2024: Beifu Electronic Technology Co. Ltd. integrates Europlacer's Atom pick-and-place technology, significantly improving production efficiency.
- April 2024: TVS Electronics plans to expand its SMT line to six operational lines by 2028, focusing on defense and railway products.
In-Depth Surface Mount Technology Industry Market Outlook
The SMT industry is poised for continued growth, driven by technological innovation and expanding applications across various sectors. The increasing demand for miniaturized electronics, coupled with advancements in automation and AI, will create lucrative opportunities for market players. Strategic partnerships and expansion into emerging markets will further propel the market's long-term growth trajectory. Companies that invest in R&D and adapt to evolving consumer preferences will be best positioned for success.
Surface Mount Technology Industry Segmentation
-
1. Component
-
1.1. Passive Components
- 1.1.1. Resistors
- 1.1.2. Capacitors
-
1.2. Active Components
- 1.2.1. Transistors
- 1.2.2. Integrated Circuits
-
1.1. Passive Components
-
2. End-user Industry
- 2.1. Consumer Electronics
- 2.2. Automotive
- 2.3. Industrial Electronics
- 2.4. Aerospace and Defense
- 2.5. Healthcare
- 2.6. Other End-user Industries
Surface Mount Technology Industry Segmentation By Geography
- 1. North America
- 2. Europe
- 3. Asia
- 4. Australia and New Zealand
- 5. Latin America
- 6. Middle East and Africa
Surface Mount Technology Industry REPORT HIGHLIGHTS
| Aspects | Details |
|---|---|
| Study Period | 2019-2033 |
| Base Year | 2024 |
| Estimated Year | 2025 |
| Forecast Period | 2025-2033 |
| Historical Period | 2019-2024 |
| Growth Rate | CAGR of 7.60% from 2019-2033 |
| Segmentation |
|
Table of Contents
- 1. Introduction
- 1.1. Research Scope
- 1.2. Market Segmentation
- 1.3. Research Methodology
- 1.4. Definitions and Assumptions
- 2. Executive Summary
- 2.1. Introduction
- 3. Market Dynamics
- 3.1. Introduction
- 3.2. Market Drivers
- 3.2.1. Increase in Defense Budgets Across Geographies
- 3.3. Market Restrains
- 3.3.1. Highly Consolidated Market
- 3.4. Market Trends
- 3.4.1. Consumer Electronics End-user Industry Segment is Expected to Hold Significant Market Share
- 4. Market Factor Analysis
- 4.1. Porters Five Forces
- 4.2. Supply/Value Chain
- 4.3. PESTEL analysis
- 4.4. Market Entropy
- 4.5. Patent/Trademark Analysis
- 5. Global Surface Mount Technology Industry Analysis, Insights and Forecast, 2019-2031
- 5.1. Market Analysis, Insights and Forecast - by Component
- 5.1.1. Passive Components
- 5.1.1.1. Resistors
- 5.1.1.2. Capacitors
- 5.1.2. Active Components
- 5.1.2.1. Transistors
- 5.1.2.2. Integrated Circuits
- 5.1.1. Passive Components
- 5.2. Market Analysis, Insights and Forecast - by End-user Industry
- 5.2.1. Consumer Electronics
- 5.2.2. Automotive
- 5.2.3. Industrial Electronics
- 5.2.4. Aerospace and Defense
- 5.2.5. Healthcare
- 5.2.6. Other End-user Industries
- 5.3. Market Analysis, Insights and Forecast - by Region
- 5.3.1. North America
- 5.3.2. Europe
- 5.3.3. Asia
- 5.3.4. Australia and New Zealand
- 5.3.5. Latin America
- 5.3.6. Middle East and Africa
- 5.1. Market Analysis, Insights and Forecast - by Component
- 6. North America Surface Mount Technology Industry Analysis, Insights and Forecast, 2019-2031
- 6.1. Market Analysis, Insights and Forecast - by Component
- 6.1.1. Passive Components
- 6.1.1.1. Resistors
- 6.1.1.2. Capacitors
- 6.1.2. Active Components
- 6.1.2.1. Transistors
- 6.1.2.2. Integrated Circuits
- 6.1.1. Passive Components
- 6.2. Market Analysis, Insights and Forecast - by End-user Industry
- 6.2.1. Consumer Electronics
- 6.2.2. Automotive
- 6.2.3. Industrial Electronics
- 6.2.4. Aerospace and Defense
- 6.2.5. Healthcare
- 6.2.6. Other End-user Industries
- 6.1. Market Analysis, Insights and Forecast - by Component
- 7. Europe Surface Mount Technology Industry Analysis, Insights and Forecast, 2019-2031
- 7.1. Market Analysis, Insights and Forecast - by Component
- 7.1.1. Passive Components
- 7.1.1.1. Resistors
- 7.1.1.2. Capacitors
- 7.1.2. Active Components
- 7.1.2.1. Transistors
- 7.1.2.2. Integrated Circuits
- 7.1.1. Passive Components
- 7.2. Market Analysis, Insights and Forecast - by End-user Industry
- 7.2.1. Consumer Electronics
- 7.2.2. Automotive
- 7.2.3. Industrial Electronics
- 7.2.4. Aerospace and Defense
- 7.2.5. Healthcare
- 7.2.6. Other End-user Industries
- 7.1. Market Analysis, Insights and Forecast - by Component
- 8. Asia Surface Mount Technology Industry Analysis, Insights and Forecast, 2019-2031
- 8.1. Market Analysis, Insights and Forecast - by Component
- 8.1.1. Passive Components
- 8.1.1.1. Resistors
- 8.1.1.2. Capacitors
- 8.1.2. Active Components
- 8.1.2.1. Transistors
- 8.1.2.2. Integrated Circuits
- 8.1.1. Passive Components
- 8.2. Market Analysis, Insights and Forecast - by End-user Industry
- 8.2.1. Consumer Electronics
- 8.2.2. Automotive
- 8.2.3. Industrial Electronics
- 8.2.4. Aerospace and Defense
- 8.2.5. Healthcare
- 8.2.6. Other End-user Industries
- 8.1. Market Analysis, Insights and Forecast - by Component
- 9. Australia and New Zealand Surface Mount Technology Industry Analysis, Insights and Forecast, 2019-2031
- 9.1. Market Analysis, Insights and Forecast - by Component
- 9.1.1. Passive Components
- 9.1.1.1. Resistors
- 9.1.1.2. Capacitors
- 9.1.2. Active Components
- 9.1.2.1. Transistors
- 9.1.2.2. Integrated Circuits
- 9.1.1. Passive Components
- 9.2. Market Analysis, Insights and Forecast - by End-user Industry
- 9.2.1. Consumer Electronics
- 9.2.2. Automotive
- 9.2.3. Industrial Electronics
- 9.2.4. Aerospace and Defense
- 9.2.5. Healthcare
- 9.2.6. Other End-user Industries
- 9.1. Market Analysis, Insights and Forecast - by Component
- 10. Latin America Surface Mount Technology Industry Analysis, Insights and Forecast, 2019-2031
- 10.1. Market Analysis, Insights and Forecast - by Component
- 10.1.1. Passive Components
- 10.1.1.1. Resistors
- 10.1.1.2. Capacitors
- 10.1.2. Active Components
- 10.1.2.1. Transistors
- 10.1.2.2. Integrated Circuits
- 10.1.1. Passive Components
- 10.2. Market Analysis, Insights and Forecast - by End-user Industry
- 10.2.1. Consumer Electronics
- 10.2.2. Automotive
- 10.2.3. Industrial Electronics
- 10.2.4. Aerospace and Defense
- 10.2.5. Healthcare
- 10.2.6. Other End-user Industries
- 10.1. Market Analysis, Insights and Forecast - by Component
- 11. Middle East and Africa Surface Mount Technology Industry Analysis, Insights and Forecast, 2019-2031
- 11.1. Market Analysis, Insights and Forecast - by Component
- 11.1.1. Passive Components
- 11.1.1.1. Resistors
- 11.1.1.2. Capacitors
- 11.1.2. Active Components
- 11.1.2.1. Transistors
- 11.1.2.2. Integrated Circuits
- 11.1.1. Passive Components
- 11.2. Market Analysis, Insights and Forecast - by End-user Industry
- 11.2.1. Consumer Electronics
- 11.2.2. Automotive
- 11.2.3. Industrial Electronics
- 11.2.4. Aerospace and Defense
- 11.2.5. Healthcare
- 11.2.6. Other End-user Industries
- 11.1. Market Analysis, Insights and Forecast - by Component
- 12. North America Surface Mount Technology Industry Analysis, Insights and Forecast, 2019-2031
- 12.1. Market Analysis, Insights and Forecast - By Country/Sub-region
- 12.1.1 United States
- 12.1.2 Canada
- 12.1.3 Mexico
- 13. Europe Surface Mount Technology Industry Analysis, Insights and Forecast, 2019-2031
- 13.1. Market Analysis, Insights and Forecast - By Country/Sub-region
- 13.1.1 Germany
- 13.1.2 United Kingdom
- 13.1.3 France
- 13.1.4 Spain
- 13.1.5 Italy
- 13.1.6 Spain
- 13.1.7 Belgium
- 13.1.8 Netherland
- 13.1.9 Nordics
- 13.1.10 Rest of Europe
- 14. Asia Pacific Surface Mount Technology Industry Analysis, Insights and Forecast, 2019-2031
- 14.1. Market Analysis, Insights and Forecast - By Country/Sub-region
- 14.1.1 China
- 14.1.2 Japan
- 14.1.3 India
- 14.1.4 South Korea
- 14.1.5 Southeast Asia
- 14.1.6 Australia
- 14.1.7 Indonesia
- 14.1.8 Phillipes
- 14.1.9 Singapore
- 14.1.10 Thailandc
- 14.1.11 Rest of Asia Pacific
- 15. South America Surface Mount Technology Industry Analysis, Insights and Forecast, 2019-2031
- 15.1. Market Analysis, Insights and Forecast - By Country/Sub-region
- 15.1.1 Brazil
- 15.1.2 Argentina
- 15.1.3 Peru
- 15.1.4 Chile
- 15.1.5 Colombia
- 15.1.6 Ecuador
- 15.1.7 Venezuela
- 15.1.8 Rest of South America
- 16. North America Surface Mount Technology Industry Analysis, Insights and Forecast, 2019-2031
- 16.1. Market Analysis, Insights and Forecast - By Country/Sub-region
- 16.1.1 United States
- 16.1.2 Canada
- 16.1.3 Mexico
- 17. MEA Surface Mount Technology Industry Analysis, Insights and Forecast, 2019-2031
- 17.1. Market Analysis, Insights and Forecast - By Country/Sub-region
- 17.1.1 United Arab Emirates
- 17.1.2 Saudi Arabia
- 17.1.3 South Africa
- 17.1.4 Rest of Middle East and Africa
- 18. Competitive Analysis
- 18.1. Global Market Share Analysis 2024
- 18.2. Company Profiles
- 18.2.1 Mycronic AB
- 18.2.1.1. Overview
- 18.2.1.2. Products
- 18.2.1.3. SWOT Analysis
- 18.2.1.4. Recent Developments
- 18.2.1.5. Financials (Based on Availability)
- 18.2.2 Yamaha Motor Co Ltd
- 18.2.2.1. Overview
- 18.2.2.2. Products
- 18.2.2.3. SWOT Analysis
- 18.2.2.4. Recent Developments
- 18.2.2.5. Financials (Based on Availability)
- 18.2.3 Nordson Corporation
- 18.2.3.1. Overview
- 18.2.3.2. Products
- 18.2.3.3. SWOT Analysis
- 18.2.3.4. Recent Developments
- 18.2.3.5. Financials (Based on Availability)
- 18.2.4 Hanwa Precision Machinery Co Ltd
- 18.2.4.1. Overview
- 18.2.4.2. Products
- 18.2.4.3. SWOT Analysis
- 18.2.4.4. Recent Developments
- 18.2.4.5. Financials (Based on Availability)
- 18.2.5 Viscom S
- 18.2.5.1. Overview
- 18.2.5.2. Products
- 18.2.5.3. SWOT Analysis
- 18.2.5.4. Recent Developments
- 18.2.5.5. Financials (Based on Availability)
- 18.2.6 Juki Corporation
- 18.2.6.1. Overview
- 18.2.6.2. Products
- 18.2.6.3. SWOT Analysis
- 18.2.6.4. Recent Developments
- 18.2.6.5. Financials (Based on Availability)
- 18.2.7 Zhejiang Neoden Technology Co Ltd
- 18.2.7.1. Overview
- 18.2.7.2. Products
- 18.2.7.3. SWOT Analysis
- 18.2.7.4. Recent Developments
- 18.2.7.5. Financials (Based on Availability)
- 18.2.8 Fuji Corporation
- 18.2.8.1. Overview
- 18.2.8.2. Products
- 18.2.8.3. SWOT Analysis
- 18.2.8.4. Recent Developments
- 18.2.8.5. Financials (Based on Availability)
- 18.2.9 Europlacer Limited
- 18.2.9.1. Overview
- 18.2.9.2. Products
- 18.2.9.3. SWOT Analysis
- 18.2.9.4. Recent Developments
- 18.2.9.5. Financials (Based on Availability)
- 18.2.10 ASMPT
- 18.2.10.1. Overview
- 18.2.10.2. Products
- 18.2.10.3. SWOT Analysis
- 18.2.10.4. Recent Developments
- 18.2.10.5. Financials (Based on Availability)
- 18.2.11 Panasonic Corporation
- 18.2.11.1. Overview
- 18.2.11.2. Products
- 18.2.11.3. SWOT Analysis
- 18.2.11.4. Recent Developments
- 18.2.11.5. Financials (Based on Availability)
- 18.2.1 Mycronic AB
List of Figures
- Figure 1: Global Surface Mount Technology Industry Revenue Breakdown (Million, %) by Region 2024 & 2032
- Figure 2: North America Surface Mount Technology Industry Revenue (Million), by Country 2024 & 2032
- Figure 3: North America Surface Mount Technology Industry Revenue Share (%), by Country 2024 & 2032
- Figure 4: Europe Surface Mount Technology Industry Revenue (Million), by Country 2024 & 2032
- Figure 5: Europe Surface Mount Technology Industry Revenue Share (%), by Country 2024 & 2032
- Figure 6: Asia Pacific Surface Mount Technology Industry Revenue (Million), by Country 2024 & 2032
- Figure 7: Asia Pacific Surface Mount Technology Industry Revenue Share (%), by Country 2024 & 2032
- Figure 8: South America Surface Mount Technology Industry Revenue (Million), by Country 2024 & 2032
- Figure 9: South America Surface Mount Technology Industry Revenue Share (%), by Country 2024 & 2032
- Figure 10: North America Surface Mount Technology Industry Revenue (Million), by Country 2024 & 2032
- Figure 11: North America Surface Mount Technology Industry Revenue Share (%), by Country 2024 & 2032
- Figure 12: MEA Surface Mount Technology Industry Revenue (Million), by Country 2024 & 2032
- Figure 13: MEA Surface Mount Technology Industry Revenue Share (%), by Country 2024 & 2032
- Figure 14: North America Surface Mount Technology Industry Revenue (Million), by Component 2024 & 2032
- Figure 15: North America Surface Mount Technology Industry Revenue Share (%), by Component 2024 & 2032
- Figure 16: North America Surface Mount Technology Industry Revenue (Million), by End-user Industry 2024 & 2032
- Figure 17: North America Surface Mount Technology Industry Revenue Share (%), by End-user Industry 2024 & 2032
- Figure 18: North America Surface Mount Technology Industry Revenue (Million), by Country 2024 & 2032
- Figure 19: North America Surface Mount Technology Industry Revenue Share (%), by Country 2024 & 2032
- Figure 20: Europe Surface Mount Technology Industry Revenue (Million), by Component 2024 & 2032
- Figure 21: Europe Surface Mount Technology Industry Revenue Share (%), by Component 2024 & 2032
- Figure 22: Europe Surface Mount Technology Industry Revenue (Million), by End-user Industry 2024 & 2032
- Figure 23: Europe Surface Mount Technology Industry Revenue Share (%), by End-user Industry 2024 & 2032
- Figure 24: Europe Surface Mount Technology Industry Revenue (Million), by Country 2024 & 2032
- Figure 25: Europe Surface Mount Technology Industry Revenue Share (%), by Country 2024 & 2032
- Figure 26: Asia Surface Mount Technology Industry Revenue (Million), by Component 2024 & 2032
- Figure 27: Asia Surface Mount Technology Industry Revenue Share (%), by Component 2024 & 2032
- Figure 28: Asia Surface Mount Technology Industry Revenue (Million), by End-user Industry 2024 & 2032
- Figure 29: Asia Surface Mount Technology Industry Revenue Share (%), by End-user Industry 2024 & 2032
- Figure 30: Asia Surface Mount Technology Industry Revenue (Million), by Country 2024 & 2032
- Figure 31: Asia Surface Mount Technology Industry Revenue Share (%), by Country 2024 & 2032
- Figure 32: Australia and New Zealand Surface Mount Technology Industry Revenue (Million), by Component 2024 & 2032
- Figure 33: Australia and New Zealand Surface Mount Technology Industry Revenue Share (%), by Component 2024 & 2032
- Figure 34: Australia and New Zealand Surface Mount Technology Industry Revenue (Million), by End-user Industry 2024 & 2032
- Figure 35: Australia and New Zealand Surface Mount Technology Industry Revenue Share (%), by End-user Industry 2024 & 2032
- Figure 36: Australia and New Zealand Surface Mount Technology Industry Revenue (Million), by Country 2024 & 2032
- Figure 37: Australia and New Zealand Surface Mount Technology Industry Revenue Share (%), by Country 2024 & 2032
- Figure 38: Latin America Surface Mount Technology Industry Revenue (Million), by Component 2024 & 2032
- Figure 39: Latin America Surface Mount Technology Industry Revenue Share (%), by Component 2024 & 2032
- Figure 40: Latin America Surface Mount Technology Industry Revenue (Million), by End-user Industry 2024 & 2032
- Figure 41: Latin America Surface Mount Technology Industry Revenue Share (%), by End-user Industry 2024 & 2032
- Figure 42: Latin America Surface Mount Technology Industry Revenue (Million), by Country 2024 & 2032
- Figure 43: Latin America Surface Mount Technology Industry Revenue Share (%), by Country 2024 & 2032
- Figure 44: Middle East and Africa Surface Mount Technology Industry Revenue (Million), by Component 2024 & 2032
- Figure 45: Middle East and Africa Surface Mount Technology Industry Revenue Share (%), by Component 2024 & 2032
- Figure 46: Middle East and Africa Surface Mount Technology Industry Revenue (Million), by End-user Industry 2024 & 2032
- Figure 47: Middle East and Africa Surface Mount Technology Industry Revenue Share (%), by End-user Industry 2024 & 2032
- Figure 48: Middle East and Africa Surface Mount Technology Industry Revenue (Million), by Country 2024 & 2032
- Figure 49: Middle East and Africa Surface Mount Technology Industry Revenue Share (%), by Country 2024 & 2032
List of Tables
- Table 1: Global Surface Mount Technology Industry Revenue Million Forecast, by Region 2019 & 2032
- Table 2: Global Surface Mount Technology Industry Revenue Million Forecast, by Component 2019 & 2032
- Table 3: Global Surface Mount Technology Industry Revenue Million Forecast, by End-user Industry 2019 & 2032
- Table 4: Global Surface Mount Technology Industry Revenue Million Forecast, by Region 2019 & 2032
- Table 5: Global Surface Mount Technology Industry Revenue Million Forecast, by Country 2019 & 2032
- Table 6: United States Surface Mount Technology Industry Revenue (Million) Forecast, by Application 2019 & 2032
- Table 7: Canada Surface Mount Technology Industry Revenue (Million) Forecast, by Application 2019 & 2032
- Table 8: Mexico Surface Mount Technology Industry Revenue (Million) Forecast, by Application 2019 & 2032
- Table 9: Global Surface Mount Technology Industry Revenue Million Forecast, by Country 2019 & 2032
- Table 10: Germany Surface Mount Technology Industry Revenue (Million) Forecast, by Application 2019 & 2032
- Table 11: United Kingdom Surface Mount Technology Industry Revenue (Million) Forecast, by Application 2019 & 2032
- Table 12: France Surface Mount Technology Industry Revenue (Million) Forecast, by Application 2019 & 2032
- Table 13: Spain Surface Mount Technology Industry Revenue (Million) Forecast, by Application 2019 & 2032
- Table 14: Italy Surface Mount Technology Industry Revenue (Million) Forecast, by Application 2019 & 2032
- Table 15: Spain Surface Mount Technology Industry Revenue (Million) Forecast, by Application 2019 & 2032
- Table 16: Belgium Surface Mount Technology Industry Revenue (Million) Forecast, by Application 2019 & 2032
- Table 17: Netherland Surface Mount Technology Industry Revenue (Million) Forecast, by Application 2019 & 2032
- Table 18: Nordics Surface Mount Technology Industry Revenue (Million) Forecast, by Application 2019 & 2032
- Table 19: Rest of Europe Surface Mount Technology Industry Revenue (Million) Forecast, by Application 2019 & 2032
- Table 20: Global Surface Mount Technology Industry Revenue Million Forecast, by Country 2019 & 2032
- Table 21: China Surface Mount Technology Industry Revenue (Million) Forecast, by Application 2019 & 2032
- Table 22: Japan Surface Mount Technology Industry Revenue (Million) Forecast, by Application 2019 & 2032
- Table 23: India Surface Mount Technology Industry Revenue (Million) Forecast, by Application 2019 & 2032
- Table 24: South Korea Surface Mount Technology Industry Revenue (Million) Forecast, by Application 2019 & 2032
- Table 25: Southeast Asia Surface Mount Technology Industry Revenue (Million) Forecast, by Application 2019 & 2032
- Table 26: Australia Surface Mount Technology Industry Revenue (Million) Forecast, by Application 2019 & 2032
- Table 27: Indonesia Surface Mount Technology Industry Revenue (Million) Forecast, by Application 2019 & 2032
- Table 28: Phillipes Surface Mount Technology Industry Revenue (Million) Forecast, by Application 2019 & 2032
- Table 29: Singapore Surface Mount Technology Industry Revenue (Million) Forecast, by Application 2019 & 2032
- Table 30: Thailandc Surface Mount Technology Industry Revenue (Million) Forecast, by Application 2019 & 2032
- Table 31: Rest of Asia Pacific Surface Mount Technology Industry Revenue (Million) Forecast, by Application 2019 & 2032
- Table 32: Global Surface Mount Technology Industry Revenue Million Forecast, by Country 2019 & 2032
- Table 33: Brazil Surface Mount Technology Industry Revenue (Million) Forecast, by Application 2019 & 2032
- Table 34: Argentina Surface Mount Technology Industry Revenue (Million) Forecast, by Application 2019 & 2032
- Table 35: Peru Surface Mount Technology Industry Revenue (Million) Forecast, by Application 2019 & 2032
- Table 36: Chile Surface Mount Technology Industry Revenue (Million) Forecast, by Application 2019 & 2032
- Table 37: Colombia Surface Mount Technology Industry Revenue (Million) Forecast, by Application 2019 & 2032
- Table 38: Ecuador Surface Mount Technology Industry Revenue (Million) Forecast, by Application 2019 & 2032
- Table 39: Venezuela Surface Mount Technology Industry Revenue (Million) Forecast, by Application 2019 & 2032
- Table 40: Rest of South America Surface Mount Technology Industry Revenue (Million) Forecast, by Application 2019 & 2032
- Table 41: Global Surface Mount Technology Industry Revenue Million Forecast, by Country 2019 & 2032
- Table 42: United States Surface Mount Technology Industry Revenue (Million) Forecast, by Application 2019 & 2032
- Table 43: Canada Surface Mount Technology Industry Revenue (Million) Forecast, by Application 2019 & 2032
- Table 44: Mexico Surface Mount Technology Industry Revenue (Million) Forecast, by Application 2019 & 2032
- Table 45: Global Surface Mount Technology Industry Revenue Million Forecast, by Country 2019 & 2032
- Table 46: United Arab Emirates Surface Mount Technology Industry Revenue (Million) Forecast, by Application 2019 & 2032
- Table 47: Saudi Arabia Surface Mount Technology Industry Revenue (Million) Forecast, by Application 2019 & 2032
- Table 48: South Africa Surface Mount Technology Industry Revenue (Million) Forecast, by Application 2019 & 2032
- Table 49: Rest of Middle East and Africa Surface Mount Technology Industry Revenue (Million) Forecast, by Application 2019 & 2032
- Table 50: Global Surface Mount Technology Industry Revenue Million Forecast, by Component 2019 & 2032
- Table 51: Global Surface Mount Technology Industry Revenue Million Forecast, by End-user Industry 2019 & 2032
- Table 52: Global Surface Mount Technology Industry Revenue Million Forecast, by Country 2019 & 2032
- Table 53: Global Surface Mount Technology Industry Revenue Million Forecast, by Component 2019 & 2032
- Table 54: Global Surface Mount Technology Industry Revenue Million Forecast, by End-user Industry 2019 & 2032
- Table 55: Global Surface Mount Technology Industry Revenue Million Forecast, by Country 2019 & 2032
- Table 56: Global Surface Mount Technology Industry Revenue Million Forecast, by Component 2019 & 2032
- Table 57: Global Surface Mount Technology Industry Revenue Million Forecast, by End-user Industry 2019 & 2032
- Table 58: Global Surface Mount Technology Industry Revenue Million Forecast, by Country 2019 & 2032
- Table 59: Global Surface Mount Technology Industry Revenue Million Forecast, by Component 2019 & 2032
- Table 60: Global Surface Mount Technology Industry Revenue Million Forecast, by End-user Industry 2019 & 2032
- Table 61: Global Surface Mount Technology Industry Revenue Million Forecast, by Country 2019 & 2032
- Table 62: Global Surface Mount Technology Industry Revenue Million Forecast, by Component 2019 & 2032
- Table 63: Global Surface Mount Technology Industry Revenue Million Forecast, by End-user Industry 2019 & 2032
- Table 64: Global Surface Mount Technology Industry Revenue Million Forecast, by Country 2019 & 2032
- Table 65: Global Surface Mount Technology Industry Revenue Million Forecast, by Component 2019 & 2032
- Table 66: Global Surface Mount Technology Industry Revenue Million Forecast, by End-user Industry 2019 & 2032
- Table 67: Global Surface Mount Technology Industry Revenue Million Forecast, by Country 2019 & 2032
Frequently Asked Questions
1. What is the projected Compound Annual Growth Rate (CAGR) of the Surface Mount Technology Industry?
The projected CAGR is approximately 7.60%.
2. Which companies are prominent players in the Surface Mount Technology Industry?
Key companies in the market include Mycronic AB, Yamaha Motor Co Ltd, Nordson Corporation, Hanwa Precision Machinery Co Ltd, Viscom S, Juki Corporation, Zhejiang Neoden Technology Co Ltd, Fuji Corporation, Europlacer Limited, ASMPT, Panasonic Corporation.
3. What are the main segments of the Surface Mount Technology Industry?
The market segments include Component, End-user Industry.
4. Can you provide details about the market size?
The market size is estimated to be USD 6.14 Million as of 2022.
5. What are some drivers contributing to market growth?
Increase in Defense Budgets Across Geographies.
6. What are the notable trends driving market growth?
Consumer Electronics End-user Industry Segment is Expected to Hold Significant Market Share.
7. Are there any restraints impacting market growth?
Highly Consolidated Market.
8. Can you provide examples of recent developments in the market?
June 2024 - Beifu Electronic Technology Co. Ltd, based in Shanghai, has recently integrated Europlacer's cutting-edge pick-and-place technology into its operations. Beifu Electronic has significantly ramped up its production efficiency in the last two years, courtesy of Europlacer's Atom pick-and-place range. With a pressing need for swift changeovers and enhanced flexibility, Beifu Electronic turned to Europlacer's Atom technology, finding it the ideal fit. Due to the Atom range, Beifu Electric has bolstered its production capabilities and slashed turnaround times while upholding its stringent quality benchmarks.
9. What pricing options are available for accessing the report?
Pricing options include single-user, multi-user, and enterprise licenses priced at USD 4750, USD 5250, and USD 8750 respectively.
10. Is the market size provided in terms of value or volume?
The market size is provided in terms of value, measured in Million.
11. Are there any specific market keywords associated with the report?
Yes, the market keyword associated with the report is "Surface Mount Technology Industry," which aids in identifying and referencing the specific market segment covered.
12. How do I determine which pricing option suits my needs best?
The pricing options vary based on user requirements and access needs. Individual users may opt for single-user licenses, while businesses requiring broader access may choose multi-user or enterprise licenses for cost-effective access to the report.
13. Are there any additional resources or data provided in the Surface Mount Technology Industry report?
While the report offers comprehensive insights, it's advisable to review the specific contents or supplementary materials provided to ascertain if additional resources or data are available.
14. How can I stay updated on further developments or reports in the Surface Mount Technology Industry?
To stay informed about further developments, trends, and reports in the Surface Mount Technology Industry, consider subscribing to industry newsletters, following relevant companies and organizations, or regularly checking reputable industry news sources and publications.
Methodology
Step 1 - Identification of Relevant Samples Size from Population Database


Step 2 - Approaches for Defining Global Market Size (Value, Volume* & Price*)

Note*: In applicable scenarios
Step 3 - Data Sources
Primary Research
- Web Analytics
- Survey Reports
- Research Institute
- Latest Research Reports
- Opinion Leaders
Secondary Research
- Annual Reports
- White Paper
- Latest Press Release
- Industry Association
- Paid Database
- Investor Presentations

Step 4 - Data Triangulation
Involves using different sources of information in order to increase the validity of a study
These sources are likely to be stakeholders in a program - participants, other researchers, program staff, other community members, and so on.
Then we put all data in single framework & apply various statistical tools to find out the dynamic on the market.
During the analysis stage, feedback from the stakeholder groups would be compared to determine areas of agreement as well as areas of divergence
