

Key Insights
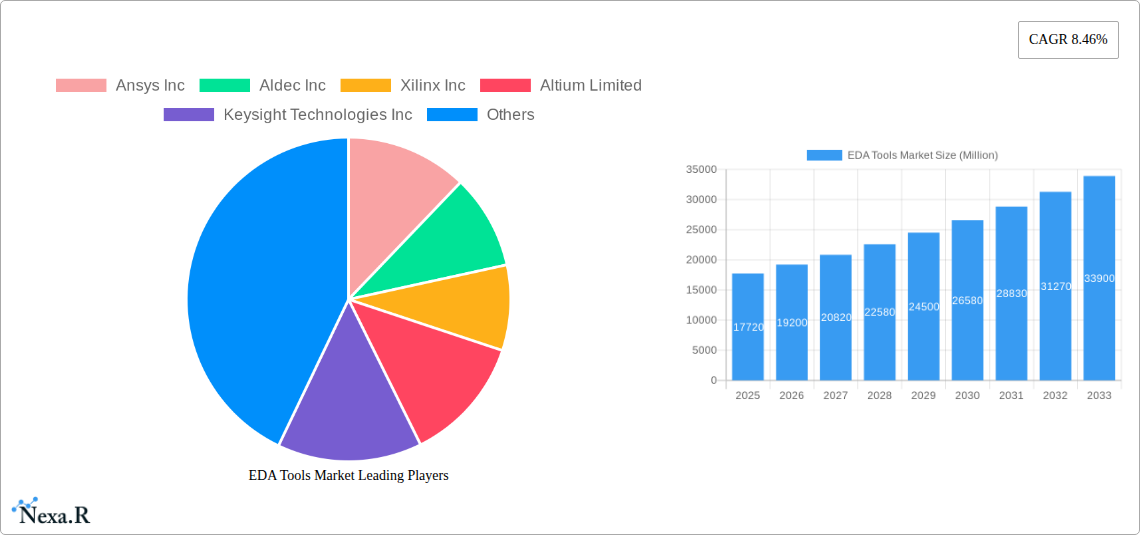
The Electronic Design Automation (EDA) tools market, valued at $17.72 billion in 2025, is projected to experience robust growth, driven by a compound annual growth rate (CAGR) of 8.46% from 2025 to 2033. This expansion is fueled by several key factors. The increasing complexity of electronic systems across diverse sectors like automotive, consumer electronics, and communication necessitates sophisticated EDA tools for efficient design and verification. The rise of 5G, Internet of Things (IoT), and artificial intelligence (AI) applications further accelerates demand for advanced EDA solutions capable of handling high-speed data processing and intricate system architectures. Furthermore, the shift towards miniaturization and power efficiency in electronics promotes the adoption of EDA tools for optimizing chip design and minimizing power consumption. The market is segmented by type (CAE, IC Physical Design, PCB & MCM, SIP, Services) and application (Communication, Consumer Electronics, Automotive, Industrial, Other). North America currently holds a significant market share, driven by strong technological advancements and a large presence of major EDA vendors. However, the Asia-Pacific region is expected to witness substantial growth in the coming years, fueled by rising electronics manufacturing and increasing investments in semiconductor technology in countries like China, India, and South Korea. Competitive rivalry among established players like Ansys, Cadence, Synopsys, and Mentor Graphics, along with the emergence of innovative startups, shapes the market landscape. While the market enjoys significant growth drivers, potential restraints include the high cost of EDA software and the need for specialized expertise to effectively utilize these tools.
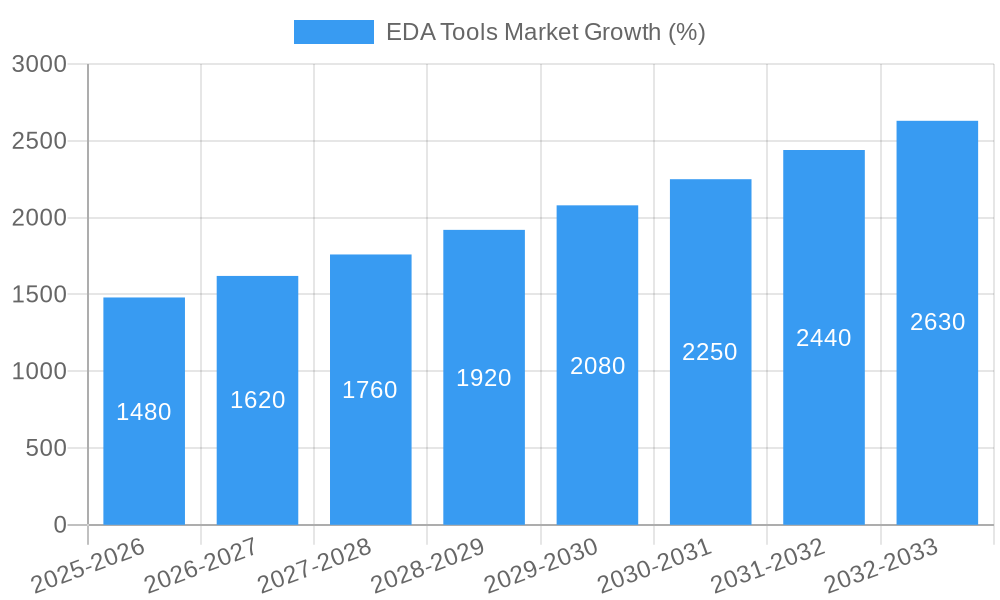
The forecast period (2025-2033) anticipates a considerable expansion of the EDA tools market, surpassing $30 billion by 2033. This growth is projected to be fueled by continued advancements in semiconductor technology, the proliferation of smart devices, and the increasing adoption of cloud-based EDA solutions. The demand for enhanced simulation capabilities, improved design automation, and faster verification processes will drive investment in advanced EDA tools. Regional variations in growth rates will reflect the varying levels of technological advancement and economic development across different geographical locations. Continued innovation, strategic partnerships, and mergers and acquisitions will likely play a crucial role in shaping the competitive landscape of this dynamic market. The market will continue to be segmented by application and type, with services and IC physical design and verification expected to remain key growth drivers.
EDA Tools Market: A Comprehensive Report (2019-2033)
This in-depth report provides a comprehensive analysis of the EDA Tools market, encompassing market dynamics, growth trends, regional segmentation, product landscape, key drivers and barriers, emerging opportunities, and a detailed overview of key players. The study period covers 2019-2033, with 2025 as the base year and a forecast period of 2025-2033. The market is segmented by type (Computer-aided Engineering (CAE), IC Physical Design and Verification, Printed Circuit Board and Multi-chip Module (PCB and MCM), Semiconductor Intellectual Property (SIP), Services) and application (Communication, Consumer Electronics, Automotive, Industrial, Other Applications). The report's findings are invaluable for industry professionals, investors, and anyone seeking a clear understanding of this rapidly evolving market. The market is expected to reach xx Million by 2033.
EDA Tools Market Dynamics & Structure
The EDA tools market is characterized by a moderately concentrated structure, with several major players holding significant market share. The market's growth is fueled by technological innovations such as AI-driven design automation, increasing demand for advanced semiconductor technologies, and the growing complexity of electronic systems. Stringent regulatory frameworks related to product safety and quality influence market practices. While there are few direct substitutes for EDA tools, the market faces indirect competition from alternative design methodologies. The end-user demographic comprises primarily technology companies in various sectors. M&A activity is significant, reflecting consolidation and expansion strategies among key players.
- Market Concentration: The top 5 players account for approximately xx% of the market share in 2025.
- Technological Innovation Drivers: Advancements in AI, machine learning, and high-performance computing are driving adoption of sophisticated EDA tools.
- Regulatory Frameworks: Compliance requirements for safety and reliability standards impact design processes and tool selection.
- Competitive Product Substitutes: Alternative design approaches like low-code/no-code platforms pose some indirect competition.
- End-User Demographics: The primary end-users are semiconductor companies, electronics manufacturers, and design houses.
- M&A Trends: The past few years have witnessed xx M&A deals in the EDA tools market, indicating industry consolidation.
EDA Tools Market Growth Trends & Insights
The EDA tools market has experienced robust growth over the historical period (2019-2024), with a CAGR of xx%. This growth is driven by the increasing adoption of advanced technologies like 5G, IoT, and AI, necessitating more sophisticated design tools. The market penetration rate for advanced EDA tools in key regions is gradually increasing. Technological disruptions, particularly the rise of cloud-based EDA solutions and the integration of AI/ML capabilities, are transforming industry practices. Consumer behavior shifts towards faster product development cycles and demand for higher-quality electronics are further fueling market expansion. The market size is projected to reach xx Million in 2025 and xx Million by 2033, exhibiting a CAGR of xx% during the forecast period.
Dominant Regions, Countries, or Segments in EDA Tools Market
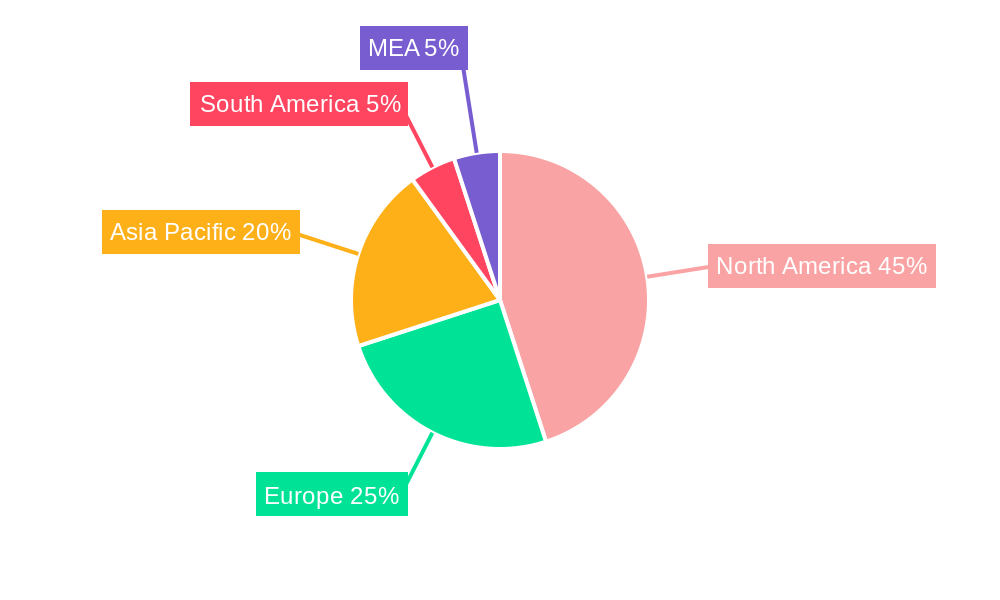
North America currently holds the largest market share in the EDA tools market, driven by the presence of major EDA vendors and a high concentration of technology companies. Asia-Pacific is projected to witness the fastest growth, fueled by rapid industrialization and increasing semiconductor manufacturing capacity.
By Type: The IC Physical Design and Verification segment holds the largest market share due to the rising complexity of integrated circuits.
By Application: The Communication segment is the leading application area, driven by the burgeoning 5G and telecommunications industries.
- North America: Strong presence of major EDA vendors and a high concentration of tech companies.
- Asia-Pacific: Rapid industrialization and expanding semiconductor manufacturing capabilities.
- Europe: Significant presence of automotive and industrial players driving demand.
- IC Physical Design and Verification: High complexity of modern ICs drives demand for advanced verification tools.
- Communication: The 5G rollout and growing telecommunications infrastructure fuel demand.
EDA Tools Market Product Landscape
The EDA tools market offers a diverse range of products, including CAE software, IC design and verification tools, PCB design software, and IP solutions. Recent innovations focus on AI-powered design automation, improved simulation accuracy, and enhanced collaboration features. These advancements lead to faster design cycles, reduced errors, and optimized performance. Key selling propositions include improved design efficiency, enhanced collaboration, and reduced time-to-market.
Key Drivers, Barriers & Challenges in EDA Tools Market
Key Drivers:
- Increasing demand for advanced semiconductor technologies.
- Growing complexity of electronic systems.
- Adoption of advanced technologies (5G, IoT, AI).
Challenges:
- High cost of software and associated services.
- Difficulty in integrating diverse EDA tools.
- Shortage of skilled professionals.
- Supply chain disruptions can impact access to critical components.
Emerging Opportunities in EDA Tools Market
- Growing adoption of cloud-based EDA solutions.
- Integration of AI/ML capabilities into EDA tools.
- Expanding applications in emerging technologies (e.g., quantum computing).
Growth Accelerators in the EDA Tools Market Industry
Technological breakthroughs in AI, machine learning, and high-performance computing are significant growth catalysts. Strategic partnerships between EDA vendors and semiconductor manufacturers accelerate innovation and market expansion. Focus on expanding into emerging markets and developing new applications for existing technologies are driving long-term growth.
Key Players Shaping the EDA Tools Market Market
- Ansys Inc
- Aldec Inc
- Xilinx Inc
- Altium Limited
- Keysight Technologies Inc
- Mentor Graphic Corporation (Siemens PLM Software)
- Synopsys Inc
- Cadence Design Systems Inc
- Lauterbach GmbH
- Agnisys Inc
- Zuken Ltd
Notable Milestones in EDA Tools Market Sector
- May 2021: Keysight Technologies Inc. acquired Quantum Benchmark, enhancing its capabilities in quantum computing software.
- May 2021: Siemens Digital Industries Software acquired Fractal Technologies, strengthening its IC verification offerings.
- April 2022: Keysight Technologies, Inc. joined the Si2 TITAN council, expanding its influence in silicon-to-system interoperability.
- July 2022: Cadence Design Systems, Inc. finalized its acquisition of Future Facilities, boosting its CFD and multiphysics capabilities.
In-Depth EDA Tools Market Market Outlook
The EDA tools market exhibits significant future growth potential, driven by the continuous evolution of semiconductor technology and the growing demand for advanced electronics. Strategic partnerships, acquisitions, and technological innovations will continue to shape the market landscape, creating opportunities for both established players and new entrants. The focus on developing AI-driven design automation, cloud-based solutions, and tools supporting emerging technologies will be crucial for long-term success.
EDA Tools Market Segmentation
-
1. Type
- 1.1. Computer-aided Engineering (CAE)
- 1.2. IC Physical Design and Verification
- 1.3. Printed
- 1.4. Semiconductor Intellectual Property (SIP)
- 1.5. Services
-
2. Application
- 2.1. Communication
- 2.2. Consumer Electronics
- 2.3. Automotive
- 2.4. Industrial
- 2.5. Other Applications
-
3. End-user
- 3.1. Semiconductor manufacturers
- 3.2. Electronics manufacturers
- 3.3. Design houses
- 3.4. Research institutions
EDA Tools Market Segmentation By Geography
- 1. North America
- 2. Europe
- 3. Asia Pacific
- 4. Rest of the World
EDA Tools Market REPORT HIGHLIGHTS
| Aspects | Details |
|---|---|
| Study Period | 2019-2033 |
| Base Year | 2024 |
| Estimated Year | 2025 |
| Forecast Period | 2025-2033 |
| Historical Period | 2019-2024 |
| Growth Rate | CAGR of 8.46% from 2019-2033 |
| Segmentation |
|
Table of Contents
- 1. Introduction
- 1.1. Research Scope
- 1.2. Market Segmentation
- 1.3. Research Methodology
- 1.4. Definitions and Assumptions
- 2. Executive Summary
- 2.1. Introduction
- 3. Market Dynamics
- 3.1. Introduction
- 3.2. Market Drivers
- 3.2.1 Booming Automotive
- 3.2.2 IoT
- 3.2.3 and AI Sectors; Upcoming Trend of EDA Toolsets Equipped with Machine Learning Capabilities
- 3.3. Market Restrains
- 3.3.1. Moore's Law about to be Proven Faulty
- 3.4. Market Trends
- 3.4.1. IC Physical Design and Verification Segment to Grow Significantly
- 4. Market Factor Analysis
- 4.1. Porters Five Forces
- 4.2. Supply/Value Chain
- 4.3. PESTEL analysis
- 4.4. Market Entropy
- 4.5. Patent/Trademark Analysis
- 5. Global EDA Tools Market Analysis, Insights and Forecast, 2019-2031
- 5.1. Market Analysis, Insights and Forecast - by Type
- 5.1.1. Computer-aided Engineering (CAE)
- 5.1.2. IC Physical Design and Verification
- 5.1.3. Printed
- 5.1.4. Semiconductor Intellectual Property (SIP)
- 5.1.5. Services
- 5.2. Market Analysis, Insights and Forecast - by Application
- 5.2.1. Communication
- 5.2.2. Consumer Electronics
- 5.2.3. Automotive
- 5.2.4. Industrial
- 5.2.5. Other Applications
- 5.3. Market Analysis, Insights and Forecast - by End-user
- 5.3.1. Semiconductor manufacturers
- 5.3.2. Electronics manufacturers
- 5.3.3. Design houses
- 5.3.4. Research institutions
- 5.4. Market Analysis, Insights and Forecast - by Region
- 5.4.1. North America
- 5.4.2. Europe
- 5.4.3. Asia Pacific
- 5.4.4. Rest of the World
- 5.1. Market Analysis, Insights and Forecast - by Type
- 6. North America EDA Tools Market Analysis, Insights and Forecast, 2019-2031
- 6.1. Market Analysis, Insights and Forecast - by Type
- 6.1.1. Computer-aided Engineering (CAE)
- 6.1.2. IC Physical Design and Verification
- 6.1.3. Printed
- 6.1.4. Semiconductor Intellectual Property (SIP)
- 6.1.5. Services
- 6.2. Market Analysis, Insights and Forecast - by Application
- 6.2.1. Communication
- 6.2.2. Consumer Electronics
- 6.2.3. Automotive
- 6.2.4. Industrial
- 6.2.5. Other Applications
- 6.3. Market Analysis, Insights and Forecast - by End-user
- 6.3.1. Semiconductor manufacturers
- 6.3.2. Electronics manufacturers
- 6.3.3. Design houses
- 6.3.4. Research institutions
- 6.1. Market Analysis, Insights and Forecast - by Type
- 7. Europe EDA Tools Market Analysis, Insights and Forecast, 2019-2031
- 7.1. Market Analysis, Insights and Forecast - by Type
- 7.1.1. Computer-aided Engineering (CAE)
- 7.1.2. IC Physical Design and Verification
- 7.1.3. Printed
- 7.1.4. Semiconductor Intellectual Property (SIP)
- 7.1.5. Services
- 7.2. Market Analysis, Insights and Forecast - by Application
- 7.2.1. Communication
- 7.2.2. Consumer Electronics
- 7.2.3. Automotive
- 7.2.4. Industrial
- 7.2.5. Other Applications
- 7.3. Market Analysis, Insights and Forecast - by End-user
- 7.3.1. Semiconductor manufacturers
- 7.3.2. Electronics manufacturers
- 7.3.3. Design houses
- 7.3.4. Research institutions
- 7.1. Market Analysis, Insights and Forecast - by Type
- 8. Asia Pacific EDA Tools Market Analysis, Insights and Forecast, 2019-2031
- 8.1. Market Analysis, Insights and Forecast - by Type
- 8.1.1. Computer-aided Engineering (CAE)
- 8.1.2. IC Physical Design and Verification
- 8.1.3. Printed
- 8.1.4. Semiconductor Intellectual Property (SIP)
- 8.1.5. Services
- 8.2. Market Analysis, Insights and Forecast - by Application
- 8.2.1. Communication
- 8.2.2. Consumer Electronics
- 8.2.3. Automotive
- 8.2.4. Industrial
- 8.2.5. Other Applications
- 8.3. Market Analysis, Insights and Forecast - by End-user
- 8.3.1. Semiconductor manufacturers
- 8.3.2. Electronics manufacturers
- 8.3.3. Design houses
- 8.3.4. Research institutions
- 8.1. Market Analysis, Insights and Forecast - by Type
- 9. Rest of the World EDA Tools Market Analysis, Insights and Forecast, 2019-2031
- 9.1. Market Analysis, Insights and Forecast - by Type
- 9.1.1. Computer-aided Engineering (CAE)
- 9.1.2. IC Physical Design and Verification
- 9.1.3. Printed
- 9.1.4. Semiconductor Intellectual Property (SIP)
- 9.1.5. Services
- 9.2. Market Analysis, Insights and Forecast - by Application
- 9.2.1. Communication
- 9.2.2. Consumer Electronics
- 9.2.3. Automotive
- 9.2.4. Industrial
- 9.2.5. Other Applications
- 9.3. Market Analysis, Insights and Forecast - by End-user
- 9.3.1. Semiconductor manufacturers
- 9.3.2. Electronics manufacturers
- 9.3.3. Design houses
- 9.3.4. Research institutions
- 9.1. Market Analysis, Insights and Forecast - by Type
- 10. North America EDA Tools Market Analysis, Insights and Forecast, 2019-2031
- 10.1. Market Analysis, Insights and Forecast - By Country/Sub-region
- 10.1.1 United States
- 10.1.2 Canada
- 10.1.3 Mexico
- 11. Europe EDA Tools Market Analysis, Insights and Forecast, 2019-2031
- 11.1. Market Analysis, Insights and Forecast - By Country/Sub-region
- 11.1.1 Germany
- 11.1.2 United Kingdom
- 11.1.3 France
- 11.1.4 Spain
- 11.1.5 Italy
- 11.1.6 Spain
- 11.1.7 Belgium
- 11.1.8 Netherland
- 11.1.9 Nordics
- 11.1.10 Rest of Europe
- 12. Asia Pacific EDA Tools Market Analysis, Insights and Forecast, 2019-2031
- 12.1. Market Analysis, Insights and Forecast - By Country/Sub-region
- 12.1.1 China
- 12.1.2 Japan
- 12.1.3 India
- 12.1.4 South Korea
- 12.1.5 Southeast Asia
- 12.1.6 Australia
- 12.1.7 Indonesia
- 12.1.8 Phillipes
- 12.1.9 Singapore
- 12.1.10 Thailandc
- 12.1.11 Rest of Asia Pacific
- 13. South America EDA Tools Market Analysis, Insights and Forecast, 2019-2031
- 13.1. Market Analysis, Insights and Forecast - By Country/Sub-region
- 13.1.1 Brazil
- 13.1.2 Argentina
- 13.1.3 Peru
- 13.1.4 Chile
- 13.1.5 Colombia
- 13.1.6 Ecuador
- 13.1.7 Venezuela
- 13.1.8 Rest of South America
- 14. North America EDA Tools Market Analysis, Insights and Forecast, 2019-2031
- 14.1. Market Analysis, Insights and Forecast - By Country/Sub-region
- 14.1.1 United States
- 14.1.2 Canada
- 14.1.3 Mexico
- 15. MEA EDA Tools Market Analysis, Insights and Forecast, 2019-2031
- 15.1. Market Analysis, Insights and Forecast - By Country/Sub-region
- 15.1.1 United Arab Emirates
- 15.1.2 Saudi Arabia
- 15.1.3 South Africa
- 15.1.4 Rest of Middle East and Africa
- 16. Competitive Analysis
- 16.1. Global Market Share Analysis 2024
- 16.2. Company Profiles
- 16.2.1 Ansys Inc
- 16.2.1.1. Overview
- 16.2.1.2. Products
- 16.2.1.3. SWOT Analysis
- 16.2.1.4. Recent Developments
- 16.2.1.5. Financials (Based on Availability)
- 16.2.2 Aldec Inc
- 16.2.2.1. Overview
- 16.2.2.2. Products
- 16.2.2.3. SWOT Analysis
- 16.2.2.4. Recent Developments
- 16.2.2.5. Financials (Based on Availability)
- 16.2.3 Xilinx Inc
- 16.2.3.1. Overview
- 16.2.3.2. Products
- 16.2.3.3. SWOT Analysis
- 16.2.3.4. Recent Developments
- 16.2.3.5. Financials (Based on Availability)
- 16.2.4 Altium Limited
- 16.2.4.1. Overview
- 16.2.4.2. Products
- 16.2.4.3. SWOT Analysis
- 16.2.4.4. Recent Developments
- 16.2.4.5. Financials (Based on Availability)
- 16.2.5 Keysight Technologies Inc
- 16.2.5.1. Overview
- 16.2.5.2. Products
- 16.2.5.3. SWOT Analysis
- 16.2.5.4. Recent Developments
- 16.2.5.5. Financials (Based on Availability)
- 16.2.6 Mentor Graphic Corporation (Siemens PLM Software)
- 16.2.6.1. Overview
- 16.2.6.2. Products
- 16.2.6.3. SWOT Analysis
- 16.2.6.4. Recent Developments
- 16.2.6.5. Financials (Based on Availability)
- 16.2.7 Synopsys Inc
- 16.2.7.1. Overview
- 16.2.7.2. Products
- 16.2.7.3. SWOT Analysis
- 16.2.7.4. Recent Developments
- 16.2.7.5. Financials (Based on Availability)
- 16.2.8 Cadence Design Systems Inc
- 16.2.8.1. Overview
- 16.2.8.2. Products
- 16.2.8.3. SWOT Analysis
- 16.2.8.4. Recent Developments
- 16.2.8.5. Financials (Based on Availability)
- 16.2.9 Lauterbach GmbH
- 16.2.9.1. Overview
- 16.2.9.2. Products
- 16.2.9.3. SWOT Analysis
- 16.2.9.4. Recent Developments
- 16.2.9.5. Financials (Based on Availability)
- 16.2.10 Agnisys Inc
- 16.2.10.1. Overview
- 16.2.10.2. Products
- 16.2.10.3. SWOT Analysis
- 16.2.10.4. Recent Developments
- 16.2.10.5. Financials (Based on Availability)
- 16.2.11 Zuken Ltd
- 16.2.11.1. Overview
- 16.2.11.2. Products
- 16.2.11.3. SWOT Analysis
- 16.2.11.4. Recent Developments
- 16.2.11.5. Financials (Based on Availability)
- 16.2.1 Ansys Inc
List of Figures
- Figure 1: Global EDA Tools Market Revenue Breakdown (Million, %) by Region 2024 & 2032
- Figure 2: Global EDA Tools Market Volume Breakdown (K Unit, %) by Region 2024 & 2032
- Figure 3: North America EDA Tools Market Revenue (Million), by Country 2024 & 2032
- Figure 4: North America EDA Tools Market Volume (K Unit), by Country 2024 & 2032
- Figure 5: North America EDA Tools Market Revenue Share (%), by Country 2024 & 2032
- Figure 6: North America EDA Tools Market Volume Share (%), by Country 2024 & 2032
- Figure 7: Europe EDA Tools Market Revenue (Million), by Country 2024 & 2032
- Figure 8: Europe EDA Tools Market Volume (K Unit), by Country 2024 & 2032
- Figure 9: Europe EDA Tools Market Revenue Share (%), by Country 2024 & 2032
- Figure 10: Europe EDA Tools Market Volume Share (%), by Country 2024 & 2032
- Figure 11: Asia Pacific EDA Tools Market Revenue (Million), by Country 2024 & 2032
- Figure 12: Asia Pacific EDA Tools Market Volume (K Unit), by Country 2024 & 2032
- Figure 13: Asia Pacific EDA Tools Market Revenue Share (%), by Country 2024 & 2032
- Figure 14: Asia Pacific EDA Tools Market Volume Share (%), by Country 2024 & 2032
- Figure 15: South America EDA Tools Market Revenue (Million), by Country 2024 & 2032
- Figure 16: South America EDA Tools Market Volume (K Unit), by Country 2024 & 2032
- Figure 17: South America EDA Tools Market Revenue Share (%), by Country 2024 & 2032
- Figure 18: South America EDA Tools Market Volume Share (%), by Country 2024 & 2032
- Figure 19: North America EDA Tools Market Revenue (Million), by Country 2024 & 2032
- Figure 20: North America EDA Tools Market Volume (K Unit), by Country 2024 & 2032
- Figure 21: North America EDA Tools Market Revenue Share (%), by Country 2024 & 2032
- Figure 22: North America EDA Tools Market Volume Share (%), by Country 2024 & 2032
- Figure 23: MEA EDA Tools Market Revenue (Million), by Country 2024 & 2032
- Figure 24: MEA EDA Tools Market Volume (K Unit), by Country 2024 & 2032
- Figure 25: MEA EDA Tools Market Revenue Share (%), by Country 2024 & 2032
- Figure 26: MEA EDA Tools Market Volume Share (%), by Country 2024 & 2032
- Figure 27: North America EDA Tools Market Revenue (Million), by Type 2024 & 2032
- Figure 28: North America EDA Tools Market Volume (K Unit), by Type 2024 & 2032
- Figure 29: North America EDA Tools Market Revenue Share (%), by Type 2024 & 2032
- Figure 30: North America EDA Tools Market Volume Share (%), by Type 2024 & 2032
- Figure 31: North America EDA Tools Market Revenue (Million), by Application 2024 & 2032
- Figure 32: North America EDA Tools Market Volume (K Unit), by Application 2024 & 2032
- Figure 33: North America EDA Tools Market Revenue Share (%), by Application 2024 & 2032
- Figure 34: North America EDA Tools Market Volume Share (%), by Application 2024 & 2032
- Figure 35: North America EDA Tools Market Revenue (Million), by End-user 2024 & 2032
- Figure 36: North America EDA Tools Market Volume (K Unit), by End-user 2024 & 2032
- Figure 37: North America EDA Tools Market Revenue Share (%), by End-user 2024 & 2032
- Figure 38: North America EDA Tools Market Volume Share (%), by End-user 2024 & 2032
- Figure 39: North America EDA Tools Market Revenue (Million), by Country 2024 & 2032
- Figure 40: North America EDA Tools Market Volume (K Unit), by Country 2024 & 2032
- Figure 41: North America EDA Tools Market Revenue Share (%), by Country 2024 & 2032
- Figure 42: North America EDA Tools Market Volume Share (%), by Country 2024 & 2032
- Figure 43: Europe EDA Tools Market Revenue (Million), by Type 2024 & 2032
- Figure 44: Europe EDA Tools Market Volume (K Unit), by Type 2024 & 2032
- Figure 45: Europe EDA Tools Market Revenue Share (%), by Type 2024 & 2032
- Figure 46: Europe EDA Tools Market Volume Share (%), by Type 2024 & 2032
- Figure 47: Europe EDA Tools Market Revenue (Million), by Application 2024 & 2032
- Figure 48: Europe EDA Tools Market Volume (K Unit), by Application 2024 & 2032
- Figure 49: Europe EDA Tools Market Revenue Share (%), by Application 2024 & 2032
- Figure 50: Europe EDA Tools Market Volume Share (%), by Application 2024 & 2032
- Figure 51: Europe EDA Tools Market Revenue (Million), by End-user 2024 & 2032
- Figure 52: Europe EDA Tools Market Volume (K Unit), by End-user 2024 & 2032
- Figure 53: Europe EDA Tools Market Revenue Share (%), by End-user 2024 & 2032
- Figure 54: Europe EDA Tools Market Volume Share (%), by End-user 2024 & 2032
- Figure 55: Europe EDA Tools Market Revenue (Million), by Country 2024 & 2032
- Figure 56: Europe EDA Tools Market Volume (K Unit), by Country 2024 & 2032
- Figure 57: Europe EDA Tools Market Revenue Share (%), by Country 2024 & 2032
- Figure 58: Europe EDA Tools Market Volume Share (%), by Country 2024 & 2032
- Figure 59: Asia Pacific EDA Tools Market Revenue (Million), by Type 2024 & 2032
- Figure 60: Asia Pacific EDA Tools Market Volume (K Unit), by Type 2024 & 2032
- Figure 61: Asia Pacific EDA Tools Market Revenue Share (%), by Type 2024 & 2032
- Figure 62: Asia Pacific EDA Tools Market Volume Share (%), by Type 2024 & 2032
- Figure 63: Asia Pacific EDA Tools Market Revenue (Million), by Application 2024 & 2032
- Figure 64: Asia Pacific EDA Tools Market Volume (K Unit), by Application 2024 & 2032
- Figure 65: Asia Pacific EDA Tools Market Revenue Share (%), by Application 2024 & 2032
- Figure 66: Asia Pacific EDA Tools Market Volume Share (%), by Application 2024 & 2032
- Figure 67: Asia Pacific EDA Tools Market Revenue (Million), by End-user 2024 & 2032
- Figure 68: Asia Pacific EDA Tools Market Volume (K Unit), by End-user 2024 & 2032
- Figure 69: Asia Pacific EDA Tools Market Revenue Share (%), by End-user 2024 & 2032
- Figure 70: Asia Pacific EDA Tools Market Volume Share (%), by End-user 2024 & 2032
- Figure 71: Asia Pacific EDA Tools Market Revenue (Million), by Country 2024 & 2032
- Figure 72: Asia Pacific EDA Tools Market Volume (K Unit), by Country 2024 & 2032
- Figure 73: Asia Pacific EDA Tools Market Revenue Share (%), by Country 2024 & 2032
- Figure 74: Asia Pacific EDA Tools Market Volume Share (%), by Country 2024 & 2032
- Figure 75: Rest of the World EDA Tools Market Revenue (Million), by Type 2024 & 2032
- Figure 76: Rest of the World EDA Tools Market Volume (K Unit), by Type 2024 & 2032
- Figure 77: Rest of the World EDA Tools Market Revenue Share (%), by Type 2024 & 2032
- Figure 78: Rest of the World EDA Tools Market Volume Share (%), by Type 2024 & 2032
- Figure 79: Rest of the World EDA Tools Market Revenue (Million), by Application 2024 & 2032
- Figure 80: Rest of the World EDA Tools Market Volume (K Unit), by Application 2024 & 2032
- Figure 81: Rest of the World EDA Tools Market Revenue Share (%), by Application 2024 & 2032
- Figure 82: Rest of the World EDA Tools Market Volume Share (%), by Application 2024 & 2032
- Figure 83: Rest of the World EDA Tools Market Revenue (Million), by End-user 2024 & 2032
- Figure 84: Rest of the World EDA Tools Market Volume (K Unit), by End-user 2024 & 2032
- Figure 85: Rest of the World EDA Tools Market Revenue Share (%), by End-user 2024 & 2032
- Figure 86: Rest of the World EDA Tools Market Volume Share (%), by End-user 2024 & 2032
- Figure 87: Rest of the World EDA Tools Market Revenue (Million), by Country 2024 & 2032
- Figure 88: Rest of the World EDA Tools Market Volume (K Unit), by Country 2024 & 2032
- Figure 89: Rest of the World EDA Tools Market Revenue Share (%), by Country 2024 & 2032
- Figure 90: Rest of the World EDA Tools Market Volume Share (%), by Country 2024 & 2032
List of Tables
- Table 1: Global EDA Tools Market Revenue Million Forecast, by Region 2019 & 2032
- Table 2: Global EDA Tools Market Volume K Unit Forecast, by Region 2019 & 2032
- Table 3: Global EDA Tools Market Revenue Million Forecast, by Type 2019 & 2032
- Table 4: Global EDA Tools Market Volume K Unit Forecast, by Type 2019 & 2032
- Table 5: Global EDA Tools Market Revenue Million Forecast, by Application 2019 & 2032
- Table 6: Global EDA Tools Market Volume K Unit Forecast, by Application 2019 & 2032
- Table 7: Global EDA Tools Market Revenue Million Forecast, by End-user 2019 & 2032
- Table 8: Global EDA Tools Market Volume K Unit Forecast, by End-user 2019 & 2032
- Table 9: Global EDA Tools Market Revenue Million Forecast, by Region 2019 & 2032
- Table 10: Global EDA Tools Market Volume K Unit Forecast, by Region 2019 & 2032
- Table 11: Global EDA Tools Market Revenue Million Forecast, by Country 2019 & 2032
- Table 12: Global EDA Tools Market Volume K Unit Forecast, by Country 2019 & 2032
- Table 13: United States EDA Tools Market Revenue (Million) Forecast, by Application 2019 & 2032
- Table 14: United States EDA Tools Market Volume (K Unit) Forecast, by Application 2019 & 2032
- Table 15: Canada EDA Tools Market Revenue (Million) Forecast, by Application 2019 & 2032
- Table 16: Canada EDA Tools Market Volume (K Unit) Forecast, by Application 2019 & 2032
- Table 17: Mexico EDA Tools Market Revenue (Million) Forecast, by Application 2019 & 2032
- Table 18: Mexico EDA Tools Market Volume (K Unit) Forecast, by Application 2019 & 2032
- Table 19: Global EDA Tools Market Revenue Million Forecast, by Country 2019 & 2032
- Table 20: Global EDA Tools Market Volume K Unit Forecast, by Country 2019 & 2032
- Table 21: Germany EDA Tools Market Revenue (Million) Forecast, by Application 2019 & 2032
- Table 22: Germany EDA Tools Market Volume (K Unit) Forecast, by Application 2019 & 2032
- Table 23: United Kingdom EDA Tools Market Revenue (Million) Forecast, by Application 2019 & 2032
- Table 24: United Kingdom EDA Tools Market Volume (K Unit) Forecast, by Application 2019 & 2032
- Table 25: France EDA Tools Market Revenue (Million) Forecast, by Application 2019 & 2032
- Table 26: France EDA Tools Market Volume (K Unit) Forecast, by Application 2019 & 2032
- Table 27: Spain EDA Tools Market Revenue (Million) Forecast, by Application 2019 & 2032
- Table 28: Spain EDA Tools Market Volume (K Unit) Forecast, by Application 2019 & 2032
- Table 29: Italy EDA Tools Market Revenue (Million) Forecast, by Application 2019 & 2032
- Table 30: Italy EDA Tools Market Volume (K Unit) Forecast, by Application 2019 & 2032
- Table 31: Spain EDA Tools Market Revenue (Million) Forecast, by Application 2019 & 2032
- Table 32: Spain EDA Tools Market Volume (K Unit) Forecast, by Application 2019 & 2032
- Table 33: Belgium EDA Tools Market Revenue (Million) Forecast, by Application 2019 & 2032
- Table 34: Belgium EDA Tools Market Volume (K Unit) Forecast, by Application 2019 & 2032
- Table 35: Netherland EDA Tools Market Revenue (Million) Forecast, by Application 2019 & 2032
- Table 36: Netherland EDA Tools Market Volume (K Unit) Forecast, by Application 2019 & 2032
- Table 37: Nordics EDA Tools Market Revenue (Million) Forecast, by Application 2019 & 2032
- Table 38: Nordics EDA Tools Market Volume (K Unit) Forecast, by Application 2019 & 2032
- Table 39: Rest of Europe EDA Tools Market Revenue (Million) Forecast, by Application 2019 & 2032
- Table 40: Rest of Europe EDA Tools Market Volume (K Unit) Forecast, by Application 2019 & 2032
- Table 41: Global EDA Tools Market Revenue Million Forecast, by Country 2019 & 2032
- Table 42: Global EDA Tools Market Volume K Unit Forecast, by Country 2019 & 2032
- Table 43: China EDA Tools Market Revenue (Million) Forecast, by Application 2019 & 2032
- Table 44: China EDA Tools Market Volume (K Unit) Forecast, by Application 2019 & 2032
- Table 45: Japan EDA Tools Market Revenue (Million) Forecast, by Application 2019 & 2032
- Table 46: Japan EDA Tools Market Volume (K Unit) Forecast, by Application 2019 & 2032
- Table 47: India EDA Tools Market Revenue (Million) Forecast, by Application 2019 & 2032
- Table 48: India EDA Tools Market Volume (K Unit) Forecast, by Application 2019 & 2032
- Table 49: South Korea EDA Tools Market Revenue (Million) Forecast, by Application 2019 & 2032
- Table 50: South Korea EDA Tools Market Volume (K Unit) Forecast, by Application 2019 & 2032
- Table 51: Southeast Asia EDA Tools Market Revenue (Million) Forecast, by Application 2019 & 2032
- Table 52: Southeast Asia EDA Tools Market Volume (K Unit) Forecast, by Application 2019 & 2032
- Table 53: Australia EDA Tools Market Revenue (Million) Forecast, by Application 2019 & 2032
- Table 54: Australia EDA Tools Market Volume (K Unit) Forecast, by Application 2019 & 2032
- Table 55: Indonesia EDA Tools Market Revenue (Million) Forecast, by Application 2019 & 2032
- Table 56: Indonesia EDA Tools Market Volume (K Unit) Forecast, by Application 2019 & 2032
- Table 57: Phillipes EDA Tools Market Revenue (Million) Forecast, by Application 2019 & 2032
- Table 58: Phillipes EDA Tools Market Volume (K Unit) Forecast, by Application 2019 & 2032
- Table 59: Singapore EDA Tools Market Revenue (Million) Forecast, by Application 2019 & 2032
- Table 60: Singapore EDA Tools Market Volume (K Unit) Forecast, by Application 2019 & 2032
- Table 61: Thailandc EDA Tools Market Revenue (Million) Forecast, by Application 2019 & 2032
- Table 62: Thailandc EDA Tools Market Volume (K Unit) Forecast, by Application 2019 & 2032
- Table 63: Rest of Asia Pacific EDA Tools Market Revenue (Million) Forecast, by Application 2019 & 2032
- Table 64: Rest of Asia Pacific EDA Tools Market Volume (K Unit) Forecast, by Application 2019 & 2032
- Table 65: Global EDA Tools Market Revenue Million Forecast, by Country 2019 & 2032
- Table 66: Global EDA Tools Market Volume K Unit Forecast, by Country 2019 & 2032
- Table 67: Brazil EDA Tools Market Revenue (Million) Forecast, by Application 2019 & 2032
- Table 68: Brazil EDA Tools Market Volume (K Unit) Forecast, by Application 2019 & 2032
- Table 69: Argentina EDA Tools Market Revenue (Million) Forecast, by Application 2019 & 2032
- Table 70: Argentina EDA Tools Market Volume (K Unit) Forecast, by Application 2019 & 2032
- Table 71: Peru EDA Tools Market Revenue (Million) Forecast, by Application 2019 & 2032
- Table 72: Peru EDA Tools Market Volume (K Unit) Forecast, by Application 2019 & 2032
- Table 73: Chile EDA Tools Market Revenue (Million) Forecast, by Application 2019 & 2032
- Table 74: Chile EDA Tools Market Volume (K Unit) Forecast, by Application 2019 & 2032
- Table 75: Colombia EDA Tools Market Revenue (Million) Forecast, by Application 2019 & 2032
- Table 76: Colombia EDA Tools Market Volume (K Unit) Forecast, by Application 2019 & 2032
- Table 77: Ecuador EDA Tools Market Revenue (Million) Forecast, by Application 2019 & 2032
- Table 78: Ecuador EDA Tools Market Volume (K Unit) Forecast, by Application 2019 & 2032
- Table 79: Venezuela EDA Tools Market Revenue (Million) Forecast, by Application 2019 & 2032
- Table 80: Venezuela EDA Tools Market Volume (K Unit) Forecast, by Application 2019 & 2032
- Table 81: Rest of South America EDA Tools Market Revenue (Million) Forecast, by Application 2019 & 2032
- Table 82: Rest of South America EDA Tools Market Volume (K Unit) Forecast, by Application 2019 & 2032
- Table 83: Global EDA Tools Market Revenue Million Forecast, by Country 2019 & 2032
- Table 84: Global EDA Tools Market Volume K Unit Forecast, by Country 2019 & 2032
- Table 85: United States EDA Tools Market Revenue (Million) Forecast, by Application 2019 & 2032
- Table 86: United States EDA Tools Market Volume (K Unit) Forecast, by Application 2019 & 2032
- Table 87: Canada EDA Tools Market Revenue (Million) Forecast, by Application 2019 & 2032
- Table 88: Canada EDA Tools Market Volume (K Unit) Forecast, by Application 2019 & 2032
- Table 89: Mexico EDA Tools Market Revenue (Million) Forecast, by Application 2019 & 2032
- Table 90: Mexico EDA Tools Market Volume (K Unit) Forecast, by Application 2019 & 2032
- Table 91: Global EDA Tools Market Revenue Million Forecast, by Country 2019 & 2032
- Table 92: Global EDA Tools Market Volume K Unit Forecast, by Country 2019 & 2032
- Table 93: United Arab Emirates EDA Tools Market Revenue (Million) Forecast, by Application 2019 & 2032
- Table 94: United Arab Emirates EDA Tools Market Volume (K Unit) Forecast, by Application 2019 & 2032
- Table 95: Saudi Arabia EDA Tools Market Revenue (Million) Forecast, by Application 2019 & 2032
- Table 96: Saudi Arabia EDA Tools Market Volume (K Unit) Forecast, by Application 2019 & 2032
- Table 97: South Africa EDA Tools Market Revenue (Million) Forecast, by Application 2019 & 2032
- Table 98: South Africa EDA Tools Market Volume (K Unit) Forecast, by Application 2019 & 2032
- Table 99: Rest of Middle East and Africa EDA Tools Market Revenue (Million) Forecast, by Application 2019 & 2032
- Table 100: Rest of Middle East and Africa EDA Tools Market Volume (K Unit) Forecast, by Application 2019 & 2032
- Table 101: Global EDA Tools Market Revenue Million Forecast, by Type 2019 & 2032
- Table 102: Global EDA Tools Market Volume K Unit Forecast, by Type 2019 & 2032
- Table 103: Global EDA Tools Market Revenue Million Forecast, by Application 2019 & 2032
- Table 104: Global EDA Tools Market Volume K Unit Forecast, by Application 2019 & 2032
- Table 105: Global EDA Tools Market Revenue Million Forecast, by End-user 2019 & 2032
- Table 106: Global EDA Tools Market Volume K Unit Forecast, by End-user 2019 & 2032
- Table 107: Global EDA Tools Market Revenue Million Forecast, by Country 2019 & 2032
- Table 108: Global EDA Tools Market Volume K Unit Forecast, by Country 2019 & 2032
- Table 109: Global EDA Tools Market Revenue Million Forecast, by Type 2019 & 2032
- Table 110: Global EDA Tools Market Volume K Unit Forecast, by Type 2019 & 2032
- Table 111: Global EDA Tools Market Revenue Million Forecast, by Application 2019 & 2032
- Table 112: Global EDA Tools Market Volume K Unit Forecast, by Application 2019 & 2032
- Table 113: Global EDA Tools Market Revenue Million Forecast, by End-user 2019 & 2032
- Table 114: Global EDA Tools Market Volume K Unit Forecast, by End-user 2019 & 2032
- Table 115: Global EDA Tools Market Revenue Million Forecast, by Country 2019 & 2032
- Table 116: Global EDA Tools Market Volume K Unit Forecast, by Country 2019 & 2032
- Table 117: Global EDA Tools Market Revenue Million Forecast, by Type 2019 & 2032
- Table 118: Global EDA Tools Market Volume K Unit Forecast, by Type 2019 & 2032
- Table 119: Global EDA Tools Market Revenue Million Forecast, by Application 2019 & 2032
- Table 120: Global EDA Tools Market Volume K Unit Forecast, by Application 2019 & 2032
- Table 121: Global EDA Tools Market Revenue Million Forecast, by End-user 2019 & 2032
- Table 122: Global EDA Tools Market Volume K Unit Forecast, by End-user 2019 & 2032
- Table 123: Global EDA Tools Market Revenue Million Forecast, by Country 2019 & 2032
- Table 124: Global EDA Tools Market Volume K Unit Forecast, by Country 2019 & 2032
- Table 125: Global EDA Tools Market Revenue Million Forecast, by Type 2019 & 2032
- Table 126: Global EDA Tools Market Volume K Unit Forecast, by Type 2019 & 2032
- Table 127: Global EDA Tools Market Revenue Million Forecast, by Application 2019 & 2032
- Table 128: Global EDA Tools Market Volume K Unit Forecast, by Application 2019 & 2032
- Table 129: Global EDA Tools Market Revenue Million Forecast, by End-user 2019 & 2032
- Table 130: Global EDA Tools Market Volume K Unit Forecast, by End-user 2019 & 2032
- Table 131: Global EDA Tools Market Revenue Million Forecast, by Country 2019 & 2032
- Table 132: Global EDA Tools Market Volume K Unit Forecast, by Country 2019 & 2032
Frequently Asked Questions
1. What is the projected Compound Annual Growth Rate (CAGR) of the EDA Tools Market?
The projected CAGR is approximately 8.46%.
2. Which companies are prominent players in the EDA Tools Market?
Key companies in the market include Ansys Inc, Aldec Inc, Xilinx Inc, Altium Limited, Keysight Technologies Inc, Mentor Graphic Corporation (Siemens PLM Software), Synopsys Inc, Cadence Design Systems Inc, Lauterbach GmbH, Agnisys Inc, Zuken Ltd.
3. What are the main segments of the EDA Tools Market?
The market segments include Type, Application, End-user .
4. Can you provide details about the market size?
The market size is estimated to be USD 17.72 Million as of 2022.
5. What are some drivers contributing to market growth?
Booming Automotive. IoT. and AI Sectors; Upcoming Trend of EDA Toolsets Equipped with Machine Learning Capabilities.
6. What are the notable trends driving market growth?
IC Physical Design and Verification Segment to Grow Significantly.
7. Are there any restraints impacting market growth?
Moore's Law about to be Proven Faulty.
8. Can you provide examples of recent developments in the market?
July 2022 - Future Facilities' acquisition by Cadence Design Systems, Inc. has been finalized, the company announced. The inclusion of Future Facilities technologies and experience bolsters Cadence's approach to intelligent system design and expands its capabilities in computational fluid dynamics (CFD) and multiphysics system analysis. Leading technology companies can make wise business decisions about data center design, operations, and lifecycle management and lessen their carbon footprint thanks to Future Facilities' electronics cooling analysis and energy performance optimization solutions for data center design and operation using physics-based 3D digital twins.
9. What pricing options are available for accessing the report?
Pricing options include single-user, multi-user, and enterprise licenses priced at USD 4750, USD 5250, and USD 8750 respectively.
10. Is the market size provided in terms of value or volume?
The market size is provided in terms of value, measured in Million and volume, measured in K Unit.
11. Are there any specific market keywords associated with the report?
Yes, the market keyword associated with the report is "EDA Tools Market," which aids in identifying and referencing the specific market segment covered.
12. How do I determine which pricing option suits my needs best?
The pricing options vary based on user requirements and access needs. Individual users may opt for single-user licenses, while businesses requiring broader access may choose multi-user or enterprise licenses for cost-effective access to the report.
13. Are there any additional resources or data provided in the EDA Tools Market report?
While the report offers comprehensive insights, it's advisable to review the specific contents or supplementary materials provided to ascertain if additional resources or data are available.
14. How can I stay updated on further developments or reports in the EDA Tools Market?
To stay informed about further developments, trends, and reports in the EDA Tools Market, consider subscribing to industry newsletters, following relevant companies and organizations, or regularly checking reputable industry news sources and publications.
Methodology
Step 1 - Identification of Relevant Samples Size from Population Database


Step 2 - Approaches for Defining Global Market Size (Value, Volume* & Price*)

Note*: In applicable scenarios
Step 3 - Data Sources
Primary Research
- Web Analytics
- Survey Reports
- Research Institute
- Latest Research Reports
- Opinion Leaders
Secondary Research
- Annual Reports
- White Paper
- Latest Press Release
- Industry Association
- Paid Database
- Investor Presentations

Step 4 - Data Triangulation
Involves using different sources of information in order to increase the validity of a study
These sources are likely to be stakeholders in a program - participants, other researchers, program staff, other community members, and so on.
Then we put all data in single framework & apply various statistical tools to find out the dynamic on the market.
During the analysis stage, feedback from the stakeholder groups would be compared to determine areas of agreement as well as areas of divergence
