

Key Insights
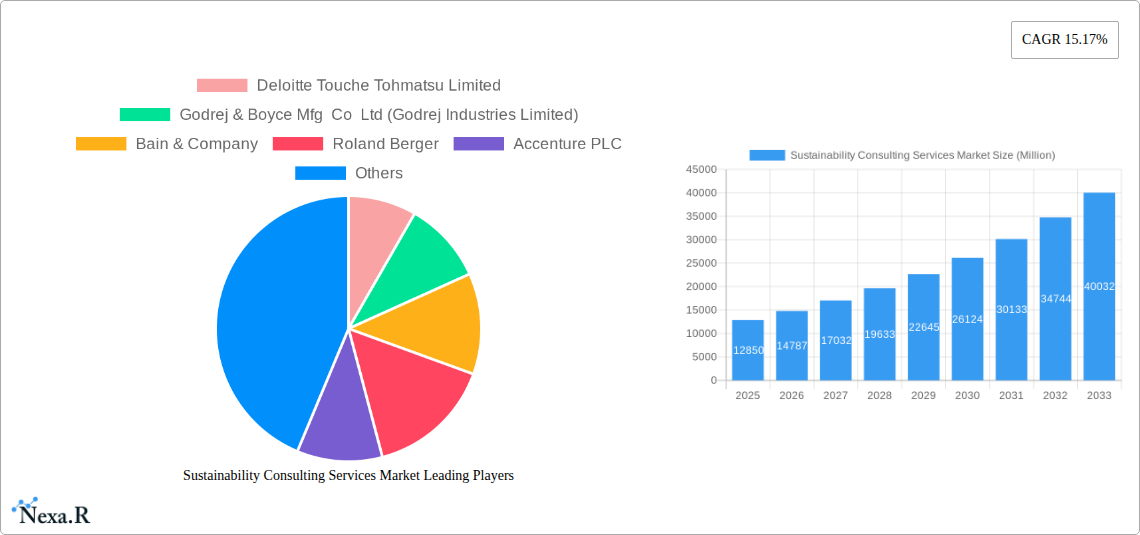
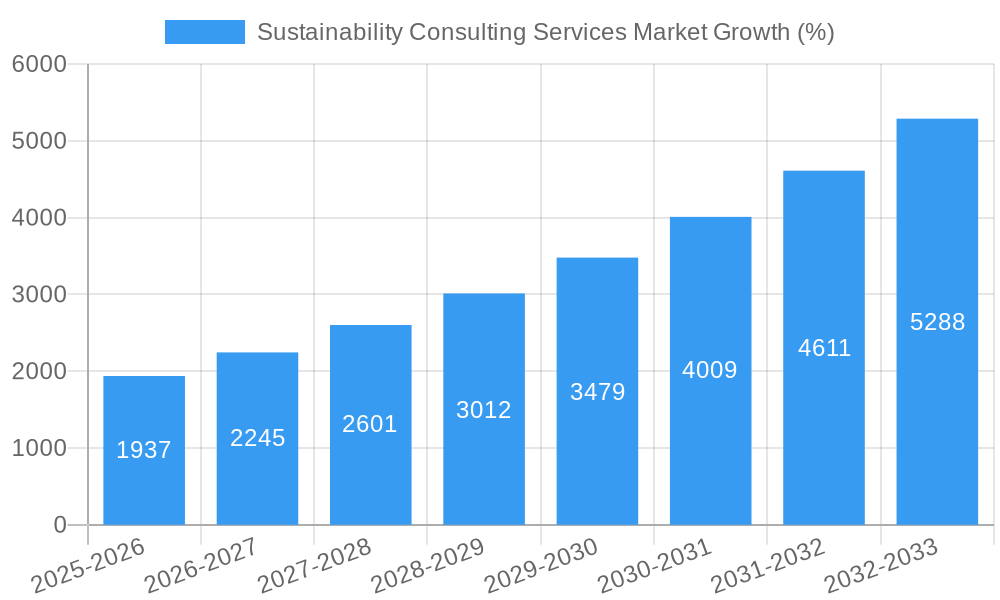
The global Sustainability Consulting Services market is experiencing robust growth, projected to reach a market size of $12.85 billion in 2025, expanding at a Compound Annual Growth Rate (CAGR) of 15.17% from 2025 to 2033. This significant expansion is driven by increasing regulatory pressures for Environmental, Social, and Governance (ESG) compliance, rising corporate social responsibility initiatives, and growing awareness of climate change among businesses and governments worldwide. The demand for services such as climate change consultancy, green building consultancy, and ESG consultancy is particularly strong, with the construction and real estate sectors representing key end-users. North America and Europe currently dominate the market, but rapid economic growth and increasing environmental concerns in Asia-Pacific are fueling substantial growth in this region. The competitive landscape is characterized by a mix of large multinational consulting firms like Deloitte, McKinsey, and PwC, alongside specialized boutique firms catering to niche sustainability needs. The market's future growth hinges on continued government support for sustainable practices, technological advancements in sustainability measurement and reporting, and evolving consumer preferences favoring environmentally and socially responsible businesses.
The market segmentation reveals a dynamic interplay of service types and end-user industries. Climate change consultancy services are expected to maintain a leading position, driven by escalating climate risks and the urgency for effective mitigation and adaptation strategies. Similarly, ESG consultancy services will witness strong growth due to increased investor scrutiny and growing stakeholder demands for transparent ESG reporting. The construction and real estate sector's significant contribution to greenhouse gas emissions is driving strong demand for green building consultancy services. Emerging economies in Asia-Pacific and South America present lucrative opportunities for expansion, while continued innovation in sustainability technologies and data analytics will shape the future evolution of the market. Competition will intensify as established players expand their services and new entrants emerge, focusing on specific sustainability niches. This will create opportunities for specialized firms with advanced expertise and a tailored approach to meet specific client needs.
Sustainability Consulting Services Market: A Comprehensive Report (2019-2033)
This comprehensive report provides an in-depth analysis of the Sustainability Consulting Services Market, encompassing market dynamics, growth trends, regional dominance, product landscape, key players, and future outlook. The report covers the period 2019-2033, with a focus on the 2025-2033 forecast period. The market is segmented by service type (Climate Change Consultancy Services, Green Building Consultancy Services, ESG Consultancy Services, Other Sustainability Consultancy Services) and end-user (Construction and Real Estate, etc.), providing granular insights into market performance across various segments. The market size is valued in Millions of units.
Sustainability Consulting Services Market Dynamics & Structure
The Sustainability Consulting Services Market is experiencing robust growth driven by increasing regulatory pressures, heightened consumer awareness of environmental issues, and a growing corporate focus on ESG (Environmental, Social, and Governance) performance. Market concentration is moderate, with several large multinational firms and specialized boutiques competing for market share. Technological innovation, particularly in areas like AI-driven data analytics and LCA (Life Cycle Assessment) tools, is a key driver, while regulatory frameworks, particularly those related to carbon emissions and sustainability reporting, are shaping market demand. The market also witnesses significant M&A activity, with larger firms consolidating their position and acquiring smaller, specialized consultancies.
- Market Concentration: Moderate, with a few major players holding significant shares but numerous smaller firms also contributing. (Exact market share percentages for top players will be detailed in the full report).
- Technological Innovation: Rapid advancements in data analytics, AI, and LCA software are boosting efficiency and enhancing the value proposition of sustainability consulting services.
- Regulatory Frameworks: Stringent environmental regulations and mandatory ESG reporting requirements are creating significant market demand across various sectors.
- Competitive Substitutes: Limited direct substitutes exist; however, internal corporate sustainability departments can potentially compete for some projects.
- End-User Demographics: Primarily corporations across various industries, with a growing segment of government and non-profit organizations.
- M&A Trends: A steady stream of mergers and acquisitions, particularly among larger firms seeking to expand their service offerings and geographic reach. (Precise M&A deal volumes will be detailed in the full report. Estimated XX deals in the past 5 years).
Sustainability Consulting Services Market Growth Trends & Insights
The Sustainability Consulting Services Market exhibits strong growth, driven by heightened awareness of climate change and the need for robust ESG strategies. The market is expanding at a Compound Annual Growth Rate (CAGR) of xx% during the forecast period (2025-2033), building upon historical growth in the 2019-2024 period. Market penetration remains relatively low in certain sectors, indicating significant growth potential. Technological disruptions, such as the adoption of AI-powered solutions and advanced LCA modeling, are influencing service offerings and driving efficiency improvements. Shifts in consumer behavior, particularly a preference for sustainable products and services, are also fueling the expansion of the market. Market size is projected to reach xx Million by 2033, significantly up from xx Million in 2025.
Dominant Regions, Countries, or Segments in Sustainability Consulting Services Market
North America and Europe currently dominate the Sustainability Consulting Services Market, driven by robust regulatory frameworks, strong corporate commitment to sustainability, and high levels of environmental awareness. However, the Asia-Pacific region is poised for significant growth, fueled by increasing industrialization, rising disposable incomes, and government initiatives promoting sustainable development. Within segments, ESG Consultancy Services are experiencing the fastest growth, followed by Climate Change Consultancy Services. The Construction and Real Estate end-user segment is a particularly strong driver due to the need for sustainable building practices and environmentally responsible development.
- Key Drivers (North America & Europe): Stringent environmental regulations, strong corporate ESG commitments, high consumer awareness.
- Key Drivers (Asia-Pacific): Rapid industrialization, increasing disposable incomes, government-led sustainability initiatives.
- Dominant Segment: ESG Consultancy Services, exhibiting the highest growth rate.
- Dominant End-User: Construction and Real Estate, with large-scale projects requiring comprehensive sustainability strategies.
Sustainability Consulting Services Market Product Landscape
The Sustainability Consulting Services market is characterized by a diverse range of offerings, including tailored strategies for carbon footprint reduction, ESG reporting frameworks, green building certifications, and supply chain sustainability assessments. Product innovations focus on integrating data analytics, AI-powered solutions, and sophisticated modeling techniques to provide more precise, data-driven insights. Unique selling propositions often revolve around specialized expertise, tailored solutions, and a commitment to delivering measurable results. Recent innovations like TCS's Product Life Cycle Profiler represent a significant advancement in LCA technology, offering scalability and dynamic environmental impact assessments across entire product lines.
Key Drivers, Barriers & Challenges in Sustainability Consulting Services Market
Key Drivers:
- Growing awareness of climate change and environmental degradation.
- Increasing regulatory pressure demanding sustainability reporting and compliance.
- Growing corporate focus on Environmental, Social, and Governance (ESG) performance.
- Technological advancements in data analytics and modeling.
Key Challenges:
- Difficulty in accurately measuring and quantifying the impact of sustainability initiatives.
- Data scarcity and inconsistency can hinder accurate assessments.
- The high cost of implementing and maintaining sustainability programs can be a barrier for some businesses, especially SMEs.
- Competition from both large established firms and smaller niche players. (Estimated impact: xx% reduction in profit margins for smaller firms).
Emerging Opportunities in Sustainability Consulting Services Market
- Growing demand for comprehensive ESG advisory services.
- Expansion into emerging markets with less developed sustainability infrastructure.
- Development of innovative data analytics and AI-powered solutions to enhance services.
- Focus on specific niche areas, such as circular economy strategies or sustainable supply chain management.
Growth Accelerators in the Sustainability Consulting Services Market Industry
Long-term growth will be fueled by technological breakthroughs in sustainability measurement and modeling, strategic partnerships between consulting firms and technology providers, and successful market expansion into emerging economies. Furthermore, increasing government incentives and collaborative initiatives aimed at promoting sustainable business practices will significantly impact market development.
Key Players Shaping the Sustainability Consulting Services Market Market
- Deloitte Touche Tohmatsu Limited
- Godrej & Boyce Mfg Co Ltd (Godrej Industries Limited)
- Bain & Company
- Roland Berger
- Accenture PLC
- McKinsey & Company Inc
- RPS Group (Tetra Tech Inc)
- Boston Consulting Group
- Capgemini SE
- PricewaterhouseCoopers LLP
- A T Kearney Inc
- KPMG
- Tata Consultancy Services
- Ernst & Young
- SEA Energy
Notable Milestones in Sustainability Consulting Services Market Sector
- October 2023: KPMG launched a dedicated ESG Academy, enhancing industry education and expertise.
- September 2023: Tata Consultancy Services (TCS) launched the TCS Product Life Cycle Profiler, advancing LCA technology and market offerings.
In-Depth Sustainability Consulting Services Market Market Outlook
The Sustainability Consulting Services Market is poised for continued strong growth, driven by accelerating demand for ESG expertise and technological advancements that enable more precise and efficient sustainability management. Strategic partnerships, expansion into emerging markets, and the development of innovative solutions will further fuel market expansion, creating lucrative opportunities for established firms and new entrants alike. The market is expected to witness a substantial increase in both size and complexity in the coming years, presenting both challenges and significant opportunities for market participants.
Sustainability Consulting Services Market Segmentation
-
1. Service Type
- 1.1. Climate Change Consultancy Services
- 1.2. Green Building Consultancy Services
- 1.3. ESG Consultancy Services
- 1.4. Other Sustainability Consultancy Services
-
2. End User
- 2.1. Construction and Real Estate
- 2.2. Energy and Power
- 2.3. Public Sector
- 2.4. Other End Users
Sustainability Consulting Services Market Segmentation By Geography
- 1. North America
-
2. Europe
- 2.1. United Kingdom
- 2.2. Germany
- 2.3. Benelux
- 2.4. Spain
- 2.5. France
- 2.6. Nordics
- 3. Asia
- 4. Australia and New Zealand
- 5. Latin America
- 6. Middle East and Africa

Sustainability Consulting Services Market REPORT HIGHLIGHTS
| Aspects | Details |
|---|---|
| Study Period | 2019-2033 |
| Base Year | 2024 |
| Estimated Year | 2025 |
| Forecast Period | 2025-2033 |
| Historical Period | 2019-2024 |
| Growth Rate | CAGR of 15.17% from 2019-2033 |
| Segmentation |
|
Table of Contents
- 1. Introduction
- 1.1. Research Scope
- 1.2. Market Segmentation
- 1.3. Research Methodology
- 1.4. Definitions and Assumptions
- 2. Executive Summary
- 2.1. Introduction
- 3. Market Dynamics
- 3.1. Introduction
- 3.2. Market Drivers
- 3.2.1. Increased Focus on the Reduction of Carbon Footprint and Fulfilment of Net Zero Targets; National Goals Across the Globe to Combat Climate Change
- 3.3. Market Restrains
- 3.3.1. Interoperability With Existing Systems; Varying Structure of Regulatory Policies
- 3.4. Market Trends
- 3.4.1. Energy and Power to be the Largest End User Segment
- 4. Market Factor Analysis
- 4.1. Porters Five Forces
- 4.2. Supply/Value Chain
- 4.3. PESTEL analysis
- 4.4. Market Entropy
- 4.5. Patent/Trademark Analysis
- 5. Global Sustainability Consulting Services Market Analysis, Insights and Forecast, 2019-2031
- 5.1. Market Analysis, Insights and Forecast - by Service Type
- 5.1.1. Climate Change Consultancy Services
- 5.1.2. Green Building Consultancy Services
- 5.1.3. ESG Consultancy Services
- 5.1.4. Other Sustainability Consultancy Services
- 5.2. Market Analysis, Insights and Forecast - by End User
- 5.2.1. Construction and Real Estate
- 5.2.2. Energy and Power
- 5.2.3. Public Sector
- 5.2.4. Other End Users
- 5.3. Market Analysis, Insights and Forecast - by Region
- 5.3.1. North America
- 5.3.2. Europe
- 5.3.3. Asia
- 5.3.4. Australia and New Zealand
- 5.3.5. Latin America
- 5.3.6. Middle East and Africa
- 5.1. Market Analysis, Insights and Forecast - by Service Type
- 6. North America Sustainability Consulting Services Market Analysis, Insights and Forecast, 2019-2031
- 6.1. Market Analysis, Insights and Forecast - by Service Type
- 6.1.1. Climate Change Consultancy Services
- 6.1.2. Green Building Consultancy Services
- 6.1.3. ESG Consultancy Services
- 6.1.4. Other Sustainability Consultancy Services
- 6.2. Market Analysis, Insights and Forecast - by End User
- 6.2.1. Construction and Real Estate
- 6.2.2. Energy and Power
- 6.2.3. Public Sector
- 6.2.4. Other End Users
- 6.1. Market Analysis, Insights and Forecast - by Service Type
- 7. Europe Sustainability Consulting Services Market Analysis, Insights and Forecast, 2019-2031
- 7.1. Market Analysis, Insights and Forecast - by Service Type
- 7.1.1. Climate Change Consultancy Services
- 7.1.2. Green Building Consultancy Services
- 7.1.3. ESG Consultancy Services
- 7.1.4. Other Sustainability Consultancy Services
- 7.2. Market Analysis, Insights and Forecast - by End User
- 7.2.1. Construction and Real Estate
- 7.2.2. Energy and Power
- 7.2.3. Public Sector
- 7.2.4. Other End Users
- 7.1. Market Analysis, Insights and Forecast - by Service Type
- 8. Asia Sustainability Consulting Services Market Analysis, Insights and Forecast, 2019-2031
- 8.1. Market Analysis, Insights and Forecast - by Service Type
- 8.1.1. Climate Change Consultancy Services
- 8.1.2. Green Building Consultancy Services
- 8.1.3. ESG Consultancy Services
- 8.1.4. Other Sustainability Consultancy Services
- 8.2. Market Analysis, Insights and Forecast - by End User
- 8.2.1. Construction and Real Estate
- 8.2.2. Energy and Power
- 8.2.3. Public Sector
- 8.2.4. Other End Users
- 8.1. Market Analysis, Insights and Forecast - by Service Type
- 9. Australia and New Zealand Sustainability Consulting Services Market Analysis, Insights and Forecast, 2019-2031
- 9.1. Market Analysis, Insights and Forecast - by Service Type
- 9.1.1. Climate Change Consultancy Services
- 9.1.2. Green Building Consultancy Services
- 9.1.3. ESG Consultancy Services
- 9.1.4. Other Sustainability Consultancy Services
- 9.2. Market Analysis, Insights and Forecast - by End User
- 9.2.1. Construction and Real Estate
- 9.2.2. Energy and Power
- 9.2.3. Public Sector
- 9.2.4. Other End Users
- 9.1. Market Analysis, Insights and Forecast - by Service Type
- 10. Latin America Sustainability Consulting Services Market Analysis, Insights and Forecast, 2019-2031
- 10.1. Market Analysis, Insights and Forecast - by Service Type
- 10.1.1. Climate Change Consultancy Services
- 10.1.2. Green Building Consultancy Services
- 10.1.3. ESG Consultancy Services
- 10.1.4. Other Sustainability Consultancy Services
- 10.2. Market Analysis, Insights and Forecast - by End User
- 10.2.1. Construction and Real Estate
- 10.2.2. Energy and Power
- 10.2.3. Public Sector
- 10.2.4. Other End Users
- 10.1. Market Analysis, Insights and Forecast - by Service Type
- 11. Middle East and Africa Sustainability Consulting Services Market Analysis, Insights and Forecast, 2019-2031
- 11.1. Market Analysis, Insights and Forecast - by Service Type
- 11.1.1. Climate Change Consultancy Services
- 11.1.2. Green Building Consultancy Services
- 11.1.3. ESG Consultancy Services
- 11.1.4. Other Sustainability Consultancy Services
- 11.2. Market Analysis, Insights and Forecast - by End User
- 11.2.1. Construction and Real Estate
- 11.2.2. Energy and Power
- 11.2.3. Public Sector
- 11.2.4. Other End Users
- 11.1. Market Analysis, Insights and Forecast - by Service Type
- 12. North America Sustainability Consulting Services Market Analysis, Insights and Forecast, 2019-2031
- 12.1. Market Analysis, Insights and Forecast - By Country/Sub-region
- 12.1.1 United States
- 12.1.2 Canada
- 12.1.3 Mexico
- 13. Europe Sustainability Consulting Services Market Analysis, Insights and Forecast, 2019-2031
- 13.1. Market Analysis, Insights and Forecast - By Country/Sub-region
- 13.1.1 Germany
- 13.1.2 United Kingdom
- 13.1.3 France
- 13.1.4 Spain
- 13.1.5 Italy
- 13.1.6 Spain
- 13.1.7 Belgium
- 13.1.8 Netherland
- 13.1.9 Nordics
- 13.1.10 Rest of Europe
- 14. Asia Pacific Sustainability Consulting Services Market Analysis, Insights and Forecast, 2019-2031
- 14.1. Market Analysis, Insights and Forecast - By Country/Sub-region
- 14.1.1 China
- 14.1.2 Japan
- 14.1.3 India
- 14.1.4 South Korea
- 14.1.5 Southeast Asia
- 14.1.6 Australia
- 14.1.7 Indonesia
- 14.1.8 Phillipes
- 14.1.9 Singapore
- 14.1.10 Thailandc
- 14.1.11 Rest of Asia Pacific
- 15. South America Sustainability Consulting Services Market Analysis, Insights and Forecast, 2019-2031
- 15.1. Market Analysis, Insights and Forecast - By Country/Sub-region
- 15.1.1 Brazil
- 15.1.2 Argentina
- 15.1.3 Peru
- 15.1.4 Chile
- 15.1.5 Colombia
- 15.1.6 Ecuador
- 15.1.7 Venezuela
- 15.1.8 Rest of South America
- 16. North America Sustainability Consulting Services Market Analysis, Insights and Forecast, 2019-2031
- 16.1. Market Analysis, Insights and Forecast - By Country/Sub-region
- 16.1.1 United States
- 16.1.2 Canada
- 16.1.3 Mexico
- 17. MEA Sustainability Consulting Services Market Analysis, Insights and Forecast, 2019-2031
- 17.1. Market Analysis, Insights and Forecast - By Country/Sub-region
- 17.1.1 United Arab Emirates
- 17.1.2 Saudi Arabia
- 17.1.3 South Africa
- 17.1.4 Rest of Middle East and Africa
- 18. Competitive Analysis
- 18.1. Global Market Share Analysis 2024
- 18.2. Company Profiles
- 18.2.1 Deloitte Touche Tohmatsu Limited
- 18.2.1.1. Overview
- 18.2.1.2. Products
- 18.2.1.3. SWOT Analysis
- 18.2.1.4. Recent Developments
- 18.2.1.5. Financials (Based on Availability)
- 18.2.2 Godrej & Boyce Mfg Co Ltd (Godrej Industries Limited)
- 18.2.2.1. Overview
- 18.2.2.2. Products
- 18.2.2.3. SWOT Analysis
- 18.2.2.4. Recent Developments
- 18.2.2.5. Financials (Based on Availability)
- 18.2.3 Bain & Company
- 18.2.3.1. Overview
- 18.2.3.2. Products
- 18.2.3.3. SWOT Analysis
- 18.2.3.4. Recent Developments
- 18.2.3.5. Financials (Based on Availability)
- 18.2.4 Roland Berger
- 18.2.4.1. Overview
- 18.2.4.2. Products
- 18.2.4.3. SWOT Analysis
- 18.2.4.4. Recent Developments
- 18.2.4.5. Financials (Based on Availability)
- 18.2.5 Accenture PLC
- 18.2.5.1. Overview
- 18.2.5.2. Products
- 18.2.5.3. SWOT Analysis
- 18.2.5.4. Recent Developments
- 18.2.5.5. Financials (Based on Availability)
- 18.2.6 McKinsey & Company Inc
- 18.2.6.1. Overview
- 18.2.6.2. Products
- 18.2.6.3. SWOT Analysis
- 18.2.6.4. Recent Developments
- 18.2.6.5. Financials (Based on Availability)
- 18.2.7 RPS Group (Tetra Tech Inc )
- 18.2.7.1. Overview
- 18.2.7.2. Products
- 18.2.7.3. SWOT Analysis
- 18.2.7.4. Recent Developments
- 18.2.7.5. Financials (Based on Availability)
- 18.2.8 Boston Consulting Group
- 18.2.8.1. Overview
- 18.2.8.2. Products
- 18.2.8.3. SWOT Analysis
- 18.2.8.4. Recent Developments
- 18.2.8.5. Financials (Based on Availability)
- 18.2.9 Capgemini SE
- 18.2.9.1. Overview
- 18.2.9.2. Products
- 18.2.9.3. SWOT Analysis
- 18.2.9.4. Recent Developments
- 18.2.9.5. Financials (Based on Availability)
- 18.2.10 PricewaterhouseCoopers LLP
- 18.2.10.1. Overview
- 18.2.10.2. Products
- 18.2.10.3. SWOT Analysis
- 18.2.10.4. Recent Developments
- 18.2.10.5. Financials (Based on Availability)
- 18.2.11 A T Kearney Inc
- 18.2.11.1. Overview
- 18.2.11.2. Products
- 18.2.11.3. SWOT Analysis
- 18.2.11.4. Recent Developments
- 18.2.11.5. Financials (Based on Availability)
- 18.2.12 KPMG
- 18.2.12.1. Overview
- 18.2.12.2. Products
- 18.2.12.3. SWOT Analysis
- 18.2.12.4. Recent Developments
- 18.2.12.5. Financials (Based on Availability)
- 18.2.13 Tata Consultancy Services
- 18.2.13.1. Overview
- 18.2.13.2. Products
- 18.2.13.3. SWOT Analysis
- 18.2.13.4. Recent Developments
- 18.2.13.5. Financials (Based on Availability)
- 18.2.14 Ernst & Young
- 18.2.14.1. Overview
- 18.2.14.2. Products
- 18.2.14.3. SWOT Analysis
- 18.2.14.4. Recent Developments
- 18.2.14.5. Financials (Based on Availability)
- 18.2.15 SEA Energy
- 18.2.15.1. Overview
- 18.2.15.2. Products
- 18.2.15.3. SWOT Analysis
- 18.2.15.4. Recent Developments
- 18.2.15.5. Financials (Based on Availability)
- 18.2.1 Deloitte Touche Tohmatsu Limited
List of Figures
- Figure 1: Global Sustainability Consulting Services Market Revenue Breakdown (Million, %) by Region 2024 & 2032
- Figure 2: Global Sustainability Consulting Services Market Volume Breakdown (K Unit, %) by Region 2024 & 2032
- Figure 3: North America Sustainability Consulting Services Market Revenue (Million), by Country 2024 & 2032
- Figure 4: North America Sustainability Consulting Services Market Volume (K Unit), by Country 2024 & 2032
- Figure 5: North America Sustainability Consulting Services Market Revenue Share (%), by Country 2024 & 2032
- Figure 6: North America Sustainability Consulting Services Market Volume Share (%), by Country 2024 & 2032
- Figure 7: Europe Sustainability Consulting Services Market Revenue (Million), by Country 2024 & 2032
- Figure 8: Europe Sustainability Consulting Services Market Volume (K Unit), by Country 2024 & 2032
- Figure 9: Europe Sustainability Consulting Services Market Revenue Share (%), by Country 2024 & 2032
- Figure 10: Europe Sustainability Consulting Services Market Volume Share (%), by Country 2024 & 2032
- Figure 11: Asia Pacific Sustainability Consulting Services Market Revenue (Million), by Country 2024 & 2032
- Figure 12: Asia Pacific Sustainability Consulting Services Market Volume (K Unit), by Country 2024 & 2032
- Figure 13: Asia Pacific Sustainability Consulting Services Market Revenue Share (%), by Country 2024 & 2032
- Figure 14: Asia Pacific Sustainability Consulting Services Market Volume Share (%), by Country 2024 & 2032
- Figure 15: South America Sustainability Consulting Services Market Revenue (Million), by Country 2024 & 2032
- Figure 16: South America Sustainability Consulting Services Market Volume (K Unit), by Country 2024 & 2032
- Figure 17: South America Sustainability Consulting Services Market Revenue Share (%), by Country 2024 & 2032
- Figure 18: South America Sustainability Consulting Services Market Volume Share (%), by Country 2024 & 2032
- Figure 19: North America Sustainability Consulting Services Market Revenue (Million), by Country 2024 & 2032
- Figure 20: North America Sustainability Consulting Services Market Volume (K Unit), by Country 2024 & 2032
- Figure 21: North America Sustainability Consulting Services Market Revenue Share (%), by Country 2024 & 2032
- Figure 22: North America Sustainability Consulting Services Market Volume Share (%), by Country 2024 & 2032
- Figure 23: MEA Sustainability Consulting Services Market Revenue (Million), by Country 2024 & 2032
- Figure 24: MEA Sustainability Consulting Services Market Volume (K Unit), by Country 2024 & 2032
- Figure 25: MEA Sustainability Consulting Services Market Revenue Share (%), by Country 2024 & 2032
- Figure 26: MEA Sustainability Consulting Services Market Volume Share (%), by Country 2024 & 2032
- Figure 27: North America Sustainability Consulting Services Market Revenue (Million), by Service Type 2024 & 2032
- Figure 28: North America Sustainability Consulting Services Market Volume (K Unit), by Service Type 2024 & 2032
- Figure 29: North America Sustainability Consulting Services Market Revenue Share (%), by Service Type 2024 & 2032
- Figure 30: North America Sustainability Consulting Services Market Volume Share (%), by Service Type 2024 & 2032
- Figure 31: North America Sustainability Consulting Services Market Revenue (Million), by End User 2024 & 2032
- Figure 32: North America Sustainability Consulting Services Market Volume (K Unit), by End User 2024 & 2032
- Figure 33: North America Sustainability Consulting Services Market Revenue Share (%), by End User 2024 & 2032
- Figure 34: North America Sustainability Consulting Services Market Volume Share (%), by End User 2024 & 2032
- Figure 35: North America Sustainability Consulting Services Market Revenue (Million), by Country 2024 & 2032
- Figure 36: North America Sustainability Consulting Services Market Volume (K Unit), by Country 2024 & 2032
- Figure 37: North America Sustainability Consulting Services Market Revenue Share (%), by Country 2024 & 2032
- Figure 38: North America Sustainability Consulting Services Market Volume Share (%), by Country 2024 & 2032
- Figure 39: Europe Sustainability Consulting Services Market Revenue (Million), by Service Type 2024 & 2032
- Figure 40: Europe Sustainability Consulting Services Market Volume (K Unit), by Service Type 2024 & 2032
- Figure 41: Europe Sustainability Consulting Services Market Revenue Share (%), by Service Type 2024 & 2032
- Figure 42: Europe Sustainability Consulting Services Market Volume Share (%), by Service Type 2024 & 2032
- Figure 43: Europe Sustainability Consulting Services Market Revenue (Million), by End User 2024 & 2032
- Figure 44: Europe Sustainability Consulting Services Market Volume (K Unit), by End User 2024 & 2032
- Figure 45: Europe Sustainability Consulting Services Market Revenue Share (%), by End User 2024 & 2032
- Figure 46: Europe Sustainability Consulting Services Market Volume Share (%), by End User 2024 & 2032
- Figure 47: Europe Sustainability Consulting Services Market Revenue (Million), by Country 2024 & 2032
- Figure 48: Europe Sustainability Consulting Services Market Volume (K Unit), by Country 2024 & 2032
- Figure 49: Europe Sustainability Consulting Services Market Revenue Share (%), by Country 2024 & 2032
- Figure 50: Europe Sustainability Consulting Services Market Volume Share (%), by Country 2024 & 2032
- Figure 51: Asia Sustainability Consulting Services Market Revenue (Million), by Service Type 2024 & 2032
- Figure 52: Asia Sustainability Consulting Services Market Volume (K Unit), by Service Type 2024 & 2032
- Figure 53: Asia Sustainability Consulting Services Market Revenue Share (%), by Service Type 2024 & 2032
- Figure 54: Asia Sustainability Consulting Services Market Volume Share (%), by Service Type 2024 & 2032
- Figure 55: Asia Sustainability Consulting Services Market Revenue (Million), by End User 2024 & 2032
- Figure 56: Asia Sustainability Consulting Services Market Volume (K Unit), by End User 2024 & 2032
- Figure 57: Asia Sustainability Consulting Services Market Revenue Share (%), by End User 2024 & 2032
- Figure 58: Asia Sustainability Consulting Services Market Volume Share (%), by End User 2024 & 2032
- Figure 59: Asia Sustainability Consulting Services Market Revenue (Million), by Country 2024 & 2032
- Figure 60: Asia Sustainability Consulting Services Market Volume (K Unit), by Country 2024 & 2032
- Figure 61: Asia Sustainability Consulting Services Market Revenue Share (%), by Country 2024 & 2032
- Figure 62: Asia Sustainability Consulting Services Market Volume Share (%), by Country 2024 & 2032
- Figure 63: Australia and New Zealand Sustainability Consulting Services Market Revenue (Million), by Service Type 2024 & 2032
- Figure 64: Australia and New Zealand Sustainability Consulting Services Market Volume (K Unit), by Service Type 2024 & 2032
- Figure 65: Australia and New Zealand Sustainability Consulting Services Market Revenue Share (%), by Service Type 2024 & 2032
- Figure 66: Australia and New Zealand Sustainability Consulting Services Market Volume Share (%), by Service Type 2024 & 2032
- Figure 67: Australia and New Zealand Sustainability Consulting Services Market Revenue (Million), by End User 2024 & 2032
- Figure 68: Australia and New Zealand Sustainability Consulting Services Market Volume (K Unit), by End User 2024 & 2032
- Figure 69: Australia and New Zealand Sustainability Consulting Services Market Revenue Share (%), by End User 2024 & 2032
- Figure 70: Australia and New Zealand Sustainability Consulting Services Market Volume Share (%), by End User 2024 & 2032
- Figure 71: Australia and New Zealand Sustainability Consulting Services Market Revenue (Million), by Country 2024 & 2032
- Figure 72: Australia and New Zealand Sustainability Consulting Services Market Volume (K Unit), by Country 2024 & 2032
- Figure 73: Australia and New Zealand Sustainability Consulting Services Market Revenue Share (%), by Country 2024 & 2032
- Figure 74: Australia and New Zealand Sustainability Consulting Services Market Volume Share (%), by Country 2024 & 2032
- Figure 75: Latin America Sustainability Consulting Services Market Revenue (Million), by Service Type 2024 & 2032
- Figure 76: Latin America Sustainability Consulting Services Market Volume (K Unit), by Service Type 2024 & 2032
- Figure 77: Latin America Sustainability Consulting Services Market Revenue Share (%), by Service Type 2024 & 2032
- Figure 78: Latin America Sustainability Consulting Services Market Volume Share (%), by Service Type 2024 & 2032
- Figure 79: Latin America Sustainability Consulting Services Market Revenue (Million), by End User 2024 & 2032
- Figure 80: Latin America Sustainability Consulting Services Market Volume (K Unit), by End User 2024 & 2032
- Figure 81: Latin America Sustainability Consulting Services Market Revenue Share (%), by End User 2024 & 2032
- Figure 82: Latin America Sustainability Consulting Services Market Volume Share (%), by End User 2024 & 2032
- Figure 83: Latin America Sustainability Consulting Services Market Revenue (Million), by Country 2024 & 2032
- Figure 84: Latin America Sustainability Consulting Services Market Volume (K Unit), by Country 2024 & 2032
- Figure 85: Latin America Sustainability Consulting Services Market Revenue Share (%), by Country 2024 & 2032
- Figure 86: Latin America Sustainability Consulting Services Market Volume Share (%), by Country 2024 & 2032
- Figure 87: Middle East and Africa Sustainability Consulting Services Market Revenue (Million), by Service Type 2024 & 2032
- Figure 88: Middle East and Africa Sustainability Consulting Services Market Volume (K Unit), by Service Type 2024 & 2032
- Figure 89: Middle East and Africa Sustainability Consulting Services Market Revenue Share (%), by Service Type 2024 & 2032
- Figure 90: Middle East and Africa Sustainability Consulting Services Market Volume Share (%), by Service Type 2024 & 2032
- Figure 91: Middle East and Africa Sustainability Consulting Services Market Revenue (Million), by End User 2024 & 2032
- Figure 92: Middle East and Africa Sustainability Consulting Services Market Volume (K Unit), by End User 2024 & 2032
- Figure 93: Middle East and Africa Sustainability Consulting Services Market Revenue Share (%), by End User 2024 & 2032
- Figure 94: Middle East and Africa Sustainability Consulting Services Market Volume Share (%), by End User 2024 & 2032
- Figure 95: Middle East and Africa Sustainability Consulting Services Market Revenue (Million), by Country 2024 & 2032
- Figure 96: Middle East and Africa Sustainability Consulting Services Market Volume (K Unit), by Country 2024 & 2032
- Figure 97: Middle East and Africa Sustainability Consulting Services Market Revenue Share (%), by Country 2024 & 2032
- Figure 98: Middle East and Africa Sustainability Consulting Services Market Volume Share (%), by Country 2024 & 2032
List of Tables
- Table 1: Global Sustainability Consulting Services Market Revenue Million Forecast, by Region 2019 & 2032
- Table 2: Global Sustainability Consulting Services Market Volume K Unit Forecast, by Region 2019 & 2032
- Table 3: Global Sustainability Consulting Services Market Revenue Million Forecast, by Service Type 2019 & 2032
- Table 4: Global Sustainability Consulting Services Market Volume K Unit Forecast, by Service Type 2019 & 2032
- Table 5: Global Sustainability Consulting Services Market Revenue Million Forecast, by End User 2019 & 2032
- Table 6: Global Sustainability Consulting Services Market Volume K Unit Forecast, by End User 2019 & 2032
- Table 7: Global Sustainability Consulting Services Market Revenue Million Forecast, by Region 2019 & 2032
- Table 8: Global Sustainability Consulting Services Market Volume K Unit Forecast, by Region 2019 & 2032
- Table 9: Global Sustainability Consulting Services Market Revenue Million Forecast, by Country 2019 & 2032
- Table 10: Global Sustainability Consulting Services Market Volume K Unit Forecast, by Country 2019 & 2032
- Table 11: United States Sustainability Consulting Services Market Revenue (Million) Forecast, by Application 2019 & 2032
- Table 12: United States Sustainability Consulting Services Market Volume (K Unit) Forecast, by Application 2019 & 2032
- Table 13: Canada Sustainability Consulting Services Market Revenue (Million) Forecast, by Application 2019 & 2032
- Table 14: Canada Sustainability Consulting Services Market Volume (K Unit) Forecast, by Application 2019 & 2032
- Table 15: Mexico Sustainability Consulting Services Market Revenue (Million) Forecast, by Application 2019 & 2032
- Table 16: Mexico Sustainability Consulting Services Market Volume (K Unit) Forecast, by Application 2019 & 2032
- Table 17: Global Sustainability Consulting Services Market Revenue Million Forecast, by Country 2019 & 2032
- Table 18: Global Sustainability Consulting Services Market Volume K Unit Forecast, by Country 2019 & 2032
- Table 19: Germany Sustainability Consulting Services Market Revenue (Million) Forecast, by Application 2019 & 2032
- Table 20: Germany Sustainability Consulting Services Market Volume (K Unit) Forecast, by Application 2019 & 2032
- Table 21: United Kingdom Sustainability Consulting Services Market Revenue (Million) Forecast, by Application 2019 & 2032
- Table 22: United Kingdom Sustainability Consulting Services Market Volume (K Unit) Forecast, by Application 2019 & 2032
- Table 23: France Sustainability Consulting Services Market Revenue (Million) Forecast, by Application 2019 & 2032
- Table 24: France Sustainability Consulting Services Market Volume (K Unit) Forecast, by Application 2019 & 2032
- Table 25: Spain Sustainability Consulting Services Market Revenue (Million) Forecast, by Application 2019 & 2032
- Table 26: Spain Sustainability Consulting Services Market Volume (K Unit) Forecast, by Application 2019 & 2032
- Table 27: Italy Sustainability Consulting Services Market Revenue (Million) Forecast, by Application 2019 & 2032
- Table 28: Italy Sustainability Consulting Services Market Volume (K Unit) Forecast, by Application 2019 & 2032
- Table 29: Spain Sustainability Consulting Services Market Revenue (Million) Forecast, by Application 2019 & 2032
- Table 30: Spain Sustainability Consulting Services Market Volume (K Unit) Forecast, by Application 2019 & 2032
- Table 31: Belgium Sustainability Consulting Services Market Revenue (Million) Forecast, by Application 2019 & 2032
- Table 32: Belgium Sustainability Consulting Services Market Volume (K Unit) Forecast, by Application 2019 & 2032
- Table 33: Netherland Sustainability Consulting Services Market Revenue (Million) Forecast, by Application 2019 & 2032
- Table 34: Netherland Sustainability Consulting Services Market Volume (K Unit) Forecast, by Application 2019 & 2032
- Table 35: Nordics Sustainability Consulting Services Market Revenue (Million) Forecast, by Application 2019 & 2032
- Table 36: Nordics Sustainability Consulting Services Market Volume (K Unit) Forecast, by Application 2019 & 2032
- Table 37: Rest of Europe Sustainability Consulting Services Market Revenue (Million) Forecast, by Application 2019 & 2032
- Table 38: Rest of Europe Sustainability Consulting Services Market Volume (K Unit) Forecast, by Application 2019 & 2032
- Table 39: Global Sustainability Consulting Services Market Revenue Million Forecast, by Country 2019 & 2032
- Table 40: Global Sustainability Consulting Services Market Volume K Unit Forecast, by Country 2019 & 2032
- Table 41: China Sustainability Consulting Services Market Revenue (Million) Forecast, by Application 2019 & 2032
- Table 42: China Sustainability Consulting Services Market Volume (K Unit) Forecast, by Application 2019 & 2032
- Table 43: Japan Sustainability Consulting Services Market Revenue (Million) Forecast, by Application 2019 & 2032
- Table 44: Japan Sustainability Consulting Services Market Volume (K Unit) Forecast, by Application 2019 & 2032
- Table 45: India Sustainability Consulting Services Market Revenue (Million) Forecast, by Application 2019 & 2032
- Table 46: India Sustainability Consulting Services Market Volume (K Unit) Forecast, by Application 2019 & 2032
- Table 47: South Korea Sustainability Consulting Services Market Revenue (Million) Forecast, by Application 2019 & 2032
- Table 48: South Korea Sustainability Consulting Services Market Volume (K Unit) Forecast, by Application 2019 & 2032
- Table 49: Southeast Asia Sustainability Consulting Services Market Revenue (Million) Forecast, by Application 2019 & 2032
- Table 50: Southeast Asia Sustainability Consulting Services Market Volume (K Unit) Forecast, by Application 2019 & 2032
- Table 51: Australia Sustainability Consulting Services Market Revenue (Million) Forecast, by Application 2019 & 2032
- Table 52: Australia Sustainability Consulting Services Market Volume (K Unit) Forecast, by Application 2019 & 2032
- Table 53: Indonesia Sustainability Consulting Services Market Revenue (Million) Forecast, by Application 2019 & 2032
- Table 54: Indonesia Sustainability Consulting Services Market Volume (K Unit) Forecast, by Application 2019 & 2032
- Table 55: Phillipes Sustainability Consulting Services Market Revenue (Million) Forecast, by Application 2019 & 2032
- Table 56: Phillipes Sustainability Consulting Services Market Volume (K Unit) Forecast, by Application 2019 & 2032
- Table 57: Singapore Sustainability Consulting Services Market Revenue (Million) Forecast, by Application 2019 & 2032
- Table 58: Singapore Sustainability Consulting Services Market Volume (K Unit) Forecast, by Application 2019 & 2032
- Table 59: Thailandc Sustainability Consulting Services Market Revenue (Million) Forecast, by Application 2019 & 2032
- Table 60: Thailandc Sustainability Consulting Services Market Volume (K Unit) Forecast, by Application 2019 & 2032
- Table 61: Rest of Asia Pacific Sustainability Consulting Services Market Revenue (Million) Forecast, by Application 2019 & 2032
- Table 62: Rest of Asia Pacific Sustainability Consulting Services Market Volume (K Unit) Forecast, by Application 2019 & 2032
- Table 63: Global Sustainability Consulting Services Market Revenue Million Forecast, by Country 2019 & 2032
- Table 64: Global Sustainability Consulting Services Market Volume K Unit Forecast, by Country 2019 & 2032
- Table 65: Brazil Sustainability Consulting Services Market Revenue (Million) Forecast, by Application 2019 & 2032
- Table 66: Brazil Sustainability Consulting Services Market Volume (K Unit) Forecast, by Application 2019 & 2032
- Table 67: Argentina Sustainability Consulting Services Market Revenue (Million) Forecast, by Application 2019 & 2032
- Table 68: Argentina Sustainability Consulting Services Market Volume (K Unit) Forecast, by Application 2019 & 2032
- Table 69: Peru Sustainability Consulting Services Market Revenue (Million) Forecast, by Application 2019 & 2032
- Table 70: Peru Sustainability Consulting Services Market Volume (K Unit) Forecast, by Application 2019 & 2032
- Table 71: Chile Sustainability Consulting Services Market Revenue (Million) Forecast, by Application 2019 & 2032
- Table 72: Chile Sustainability Consulting Services Market Volume (K Unit) Forecast, by Application 2019 & 2032
- Table 73: Colombia Sustainability Consulting Services Market Revenue (Million) Forecast, by Application 2019 & 2032
- Table 74: Colombia Sustainability Consulting Services Market Volume (K Unit) Forecast, by Application 2019 & 2032
- Table 75: Ecuador Sustainability Consulting Services Market Revenue (Million) Forecast, by Application 2019 & 2032
- Table 76: Ecuador Sustainability Consulting Services Market Volume (K Unit) Forecast, by Application 2019 & 2032
- Table 77: Venezuela Sustainability Consulting Services Market Revenue (Million) Forecast, by Application 2019 & 2032
- Table 78: Venezuela Sustainability Consulting Services Market Volume (K Unit) Forecast, by Application 2019 & 2032
- Table 79: Rest of South America Sustainability Consulting Services Market Revenue (Million) Forecast, by Application 2019 & 2032
- Table 80: Rest of South America Sustainability Consulting Services Market Volume (K Unit) Forecast, by Application 2019 & 2032
- Table 81: Global Sustainability Consulting Services Market Revenue Million Forecast, by Country 2019 & 2032
- Table 82: Global Sustainability Consulting Services Market Volume K Unit Forecast, by Country 2019 & 2032
- Table 83: United States Sustainability Consulting Services Market Revenue (Million) Forecast, by Application 2019 & 2032
- Table 84: United States Sustainability Consulting Services Market Volume (K Unit) Forecast, by Application 2019 & 2032
- Table 85: Canada Sustainability Consulting Services Market Revenue (Million) Forecast, by Application 2019 & 2032
- Table 86: Canada Sustainability Consulting Services Market Volume (K Unit) Forecast, by Application 2019 & 2032
- Table 87: Mexico Sustainability Consulting Services Market Revenue (Million) Forecast, by Application 2019 & 2032
- Table 88: Mexico Sustainability Consulting Services Market Volume (K Unit) Forecast, by Application 2019 & 2032
- Table 89: Global Sustainability Consulting Services Market Revenue Million Forecast, by Country 2019 & 2032
- Table 90: Global Sustainability Consulting Services Market Volume K Unit Forecast, by Country 2019 & 2032
- Table 91: United Arab Emirates Sustainability Consulting Services Market Revenue (Million) Forecast, by Application 2019 & 2032
- Table 92: United Arab Emirates Sustainability Consulting Services Market Volume (K Unit) Forecast, by Application 2019 & 2032
- Table 93: Saudi Arabia Sustainability Consulting Services Market Revenue (Million) Forecast, by Application 2019 & 2032
- Table 94: Saudi Arabia Sustainability Consulting Services Market Volume (K Unit) Forecast, by Application 2019 & 2032
- Table 95: South Africa Sustainability Consulting Services Market Revenue (Million) Forecast, by Application 2019 & 2032
- Table 96: South Africa Sustainability Consulting Services Market Volume (K Unit) Forecast, by Application 2019 & 2032
- Table 97: Rest of Middle East and Africa Sustainability Consulting Services Market Revenue (Million) Forecast, by Application 2019 & 2032
- Table 98: Rest of Middle East and Africa Sustainability Consulting Services Market Volume (K Unit) Forecast, by Application 2019 & 2032
- Table 99: Global Sustainability Consulting Services Market Revenue Million Forecast, by Service Type 2019 & 2032
- Table 100: Global Sustainability Consulting Services Market Volume K Unit Forecast, by Service Type 2019 & 2032
- Table 101: Global Sustainability Consulting Services Market Revenue Million Forecast, by End User 2019 & 2032
- Table 102: Global Sustainability Consulting Services Market Volume K Unit Forecast, by End User 2019 & 2032
- Table 103: Global Sustainability Consulting Services Market Revenue Million Forecast, by Country 2019 & 2032
- Table 104: Global Sustainability Consulting Services Market Volume K Unit Forecast, by Country 2019 & 2032
- Table 105: Global Sustainability Consulting Services Market Revenue Million Forecast, by Service Type 2019 & 2032
- Table 106: Global Sustainability Consulting Services Market Volume K Unit Forecast, by Service Type 2019 & 2032
- Table 107: Global Sustainability Consulting Services Market Revenue Million Forecast, by End User 2019 & 2032
- Table 108: Global Sustainability Consulting Services Market Volume K Unit Forecast, by End User 2019 & 2032
- Table 109: Global Sustainability Consulting Services Market Revenue Million Forecast, by Country 2019 & 2032
- Table 110: Global Sustainability Consulting Services Market Volume K Unit Forecast, by Country 2019 & 2032
- Table 111: United Kingdom Sustainability Consulting Services Market Revenue (Million) Forecast, by Application 2019 & 2032
- Table 112: United Kingdom Sustainability Consulting Services Market Volume (K Unit) Forecast, by Application 2019 & 2032
- Table 113: Germany Sustainability Consulting Services Market Revenue (Million) Forecast, by Application 2019 & 2032
- Table 114: Germany Sustainability Consulting Services Market Volume (K Unit) Forecast, by Application 2019 & 2032
- Table 115: Benelux Sustainability Consulting Services Market Revenue (Million) Forecast, by Application 2019 & 2032
- Table 116: Benelux Sustainability Consulting Services Market Volume (K Unit) Forecast, by Application 2019 & 2032
- Table 117: Spain Sustainability Consulting Services Market Revenue (Million) Forecast, by Application 2019 & 2032
- Table 118: Spain Sustainability Consulting Services Market Volume (K Unit) Forecast, by Application 2019 & 2032
- Table 119: France Sustainability Consulting Services Market Revenue (Million) Forecast, by Application 2019 & 2032
- Table 120: France Sustainability Consulting Services Market Volume (K Unit) Forecast, by Application 2019 & 2032
- Table 121: Nordics Sustainability Consulting Services Market Revenue (Million) Forecast, by Application 2019 & 2032
- Table 122: Nordics Sustainability Consulting Services Market Volume (K Unit) Forecast, by Application 2019 & 2032
- Table 123: Global Sustainability Consulting Services Market Revenue Million Forecast, by Service Type 2019 & 2032
- Table 124: Global Sustainability Consulting Services Market Volume K Unit Forecast, by Service Type 2019 & 2032
- Table 125: Global Sustainability Consulting Services Market Revenue Million Forecast, by End User 2019 & 2032
- Table 126: Global Sustainability Consulting Services Market Volume K Unit Forecast, by End User 2019 & 2032
- Table 127: Global Sustainability Consulting Services Market Revenue Million Forecast, by Country 2019 & 2032
- Table 128: Global Sustainability Consulting Services Market Volume K Unit Forecast, by Country 2019 & 2032
- Table 129: Global Sustainability Consulting Services Market Revenue Million Forecast, by Service Type 2019 & 2032
- Table 130: Global Sustainability Consulting Services Market Volume K Unit Forecast, by Service Type 2019 & 2032
- Table 131: Global Sustainability Consulting Services Market Revenue Million Forecast, by End User 2019 & 2032
- Table 132: Global Sustainability Consulting Services Market Volume K Unit Forecast, by End User 2019 & 2032
- Table 133: Global Sustainability Consulting Services Market Revenue Million Forecast, by Country 2019 & 2032
- Table 134: Global Sustainability Consulting Services Market Volume K Unit Forecast, by Country 2019 & 2032
- Table 135: Global Sustainability Consulting Services Market Revenue Million Forecast, by Service Type 2019 & 2032
- Table 136: Global Sustainability Consulting Services Market Volume K Unit Forecast, by Service Type 2019 & 2032
- Table 137: Global Sustainability Consulting Services Market Revenue Million Forecast, by End User 2019 & 2032
- Table 138: Global Sustainability Consulting Services Market Volume K Unit Forecast, by End User 2019 & 2032
- Table 139: Global Sustainability Consulting Services Market Revenue Million Forecast, by Country 2019 & 2032
- Table 140: Global Sustainability Consulting Services Market Volume K Unit Forecast, by Country 2019 & 2032
- Table 141: Global Sustainability Consulting Services Market Revenue Million Forecast, by Service Type 2019 & 2032
- Table 142: Global Sustainability Consulting Services Market Volume K Unit Forecast, by Service Type 2019 & 2032
- Table 143: Global Sustainability Consulting Services Market Revenue Million Forecast, by End User 2019 & 2032
- Table 144: Global Sustainability Consulting Services Market Volume K Unit Forecast, by End User 2019 & 2032
- Table 145: Global Sustainability Consulting Services Market Revenue Million Forecast, by Country 2019 & 2032
- Table 146: Global Sustainability Consulting Services Market Volume K Unit Forecast, by Country 2019 & 2032
Frequently Asked Questions
1. What is the projected Compound Annual Growth Rate (CAGR) of the Sustainability Consulting Services Market?
The projected CAGR is approximately 15.17%.
2. Which companies are prominent players in the Sustainability Consulting Services Market?
Key companies in the market include Deloitte Touche Tohmatsu Limited, Godrej & Boyce Mfg Co Ltd (Godrej Industries Limited), Bain & Company, Roland Berger, Accenture PLC, McKinsey & Company Inc, RPS Group (Tetra Tech Inc ), Boston Consulting Group, Capgemini SE, PricewaterhouseCoopers LLP, A T Kearney Inc, KPMG, Tata Consultancy Services, Ernst & Young, SEA Energy.
3. What are the main segments of the Sustainability Consulting Services Market?
The market segments include Service Type, End User.
4. Can you provide details about the market size?
The market size is estimated to be USD 12.85 Million as of 2022.
5. What are some drivers contributing to market growth?
Increased Focus on the Reduction of Carbon Footprint and Fulfilment of Net Zero Targets; National Goals Across the Globe to Combat Climate Change.
6. What are the notable trends driving market growth?
Energy and Power to be the Largest End User Segment.
7. Are there any restraints impacting market growth?
Interoperability With Existing Systems; Varying Structure of Regulatory Policies.
8. Can you provide examples of recent developments in the market?
October 2023 - KPMG launched a dedicated ESG Academy, in collaboration with Microsoft and leading universities, to empower and educate business leaders on climate and sustainability. The Academy course material is structured around the latest business thought leadership in environmental, social, and governance (ESG) topics, with content developed by globally recognized ESG specialists from leading universities and institutions in collaboration with KPMG subject matter professionals in sustainability.
9. What pricing options are available for accessing the report?
Pricing options include single-user, multi-user, and enterprise licenses priced at USD 4750, USD 5250, and USD 8750 respectively.
10. Is the market size provided in terms of value or volume?
The market size is provided in terms of value, measured in Million and volume, measured in K Unit.
11. Are there any specific market keywords associated with the report?
Yes, the market keyword associated with the report is "Sustainability Consulting Services Market," which aids in identifying and referencing the specific market segment covered.
12. How do I determine which pricing option suits my needs best?
The pricing options vary based on user requirements and access needs. Individual users may opt for single-user licenses, while businesses requiring broader access may choose multi-user or enterprise licenses for cost-effective access to the report.
13. Are there any additional resources or data provided in the Sustainability Consulting Services Market report?
While the report offers comprehensive insights, it's advisable to review the specific contents or supplementary materials provided to ascertain if additional resources or data are available.
14. How can I stay updated on further developments or reports in the Sustainability Consulting Services Market?
To stay informed about further developments, trends, and reports in the Sustainability Consulting Services Market, consider subscribing to industry newsletters, following relevant companies and organizations, or regularly checking reputable industry news sources and publications.
Methodology
Step 1 - Identification of Relevant Samples Size from Population Database


Step 2 - Approaches for Defining Global Market Size (Value, Volume* & Price*)

Note*: In applicable scenarios
Step 3 - Data Sources
Primary Research
- Web Analytics
- Survey Reports
- Research Institute
- Latest Research Reports
- Opinion Leaders
Secondary Research
- Annual Reports
- White Paper
- Latest Press Release
- Industry Association
- Paid Database
- Investor Presentations

Step 4 - Data Triangulation
Involves using different sources of information in order to increase the validity of a study
These sources are likely to be stakeholders in a program - participants, other researchers, program staff, other community members, and so on.
Then we put all data in single framework & apply various statistical tools to find out the dynamic on the market.
During the analysis stage, feedback from the stakeholder groups would be compared to determine areas of agreement as well as areas of divergence
