

Key Insights
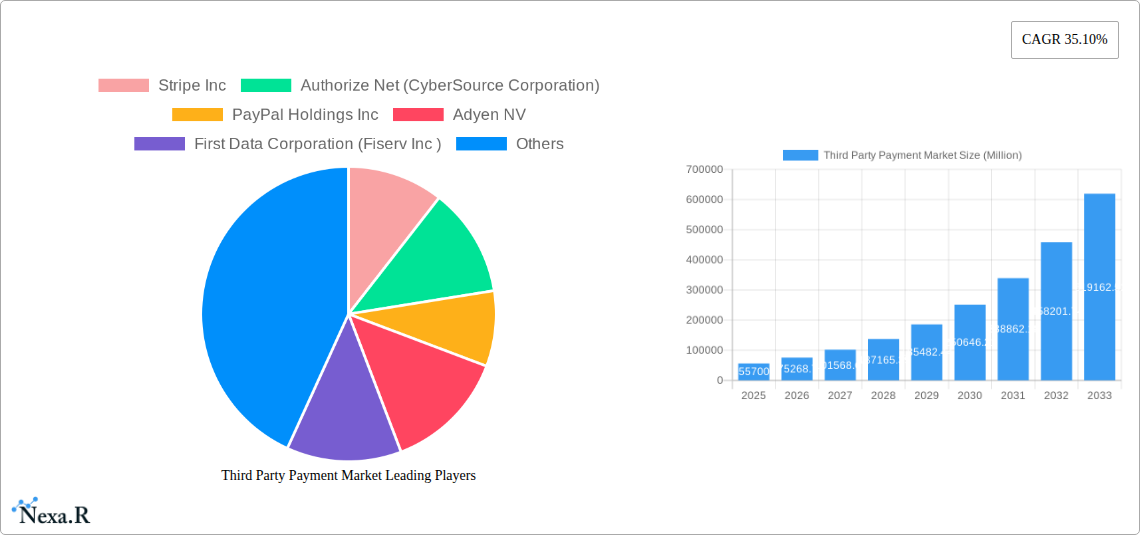
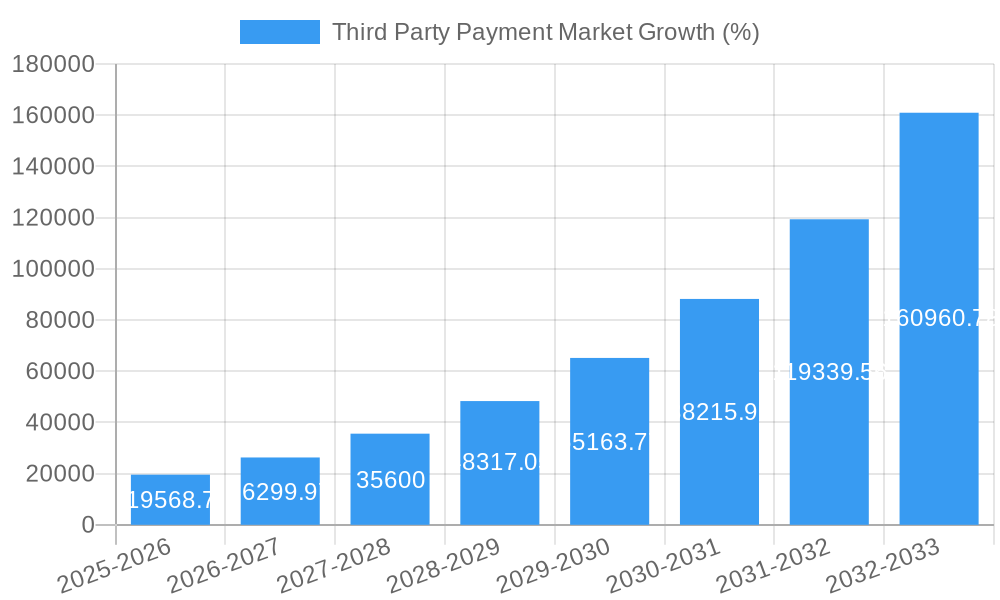
The third-party payment market is experiencing explosive growth, projected to reach $55.70 billion in 2025 and exhibiting a remarkable Compound Annual Growth Rate (CAGR) of 35.10%. This expansion is fueled by several key factors. The rising adoption of e-commerce and online transactions across various sectors like BFSI (Banking, Financial Services, and Insurance), retail, and e-commerce is a primary driver. Furthermore, the increasing preference for mobile payment solutions, coupled with the enhanced security and convenience offered by these platforms, is significantly boosting market growth. The proliferation of innovative payment technologies, such as contactless payments and digital wallets, further contributes to this upward trend. While regulatory challenges and security concerns represent potential restraints, the overall market momentum suggests robust growth in the foreseeable future. The market is segmented by type (online, mobile, point of sale) and end-user (BFSI, retail, e-commerce, others), providing various entry points for players. Major companies like Stripe, PayPal, Adyen, and others are actively competing in this dynamic landscape, constantly innovating to capture market share and cater to evolving customer demands. The Asia-Pacific region, driven by its rapidly expanding digital economy and large consumer base, is likely to witness the most significant growth. North America and Europe are expected to maintain substantial market shares due to established digital infrastructure and high consumer adoption rates. The forecast period of 2025-2033 promises continued expansion, propelled by ongoing technological advancements and increasing digitalization across various industries.
The competitive landscape is characterized by both established players and emerging fintech companies. Existing giants leverage their extensive networks and brand recognition, while innovative startups bring disruptive technologies and agile business models. Strategic partnerships and mergers and acquisitions are prevalent, reflecting the intense competition and the desire for market consolidation. The future of the third-party payment market hinges on factors such as the adoption of new technologies, regulatory frameworks, and evolving consumer preferences. The continued expansion of mobile commerce and the integration of payment solutions within diverse platforms and applications will remain key drivers. Effective security measures and consumer trust will continue to be critical elements for sustainable market growth. The ongoing development of innovative solutions like embedded finance further accelerates the market trajectory, leading to a multifaceted and increasingly sophisticated payment ecosystem.
Third Party Payment Market: A Comprehensive Report (2019-2033)
This in-depth report provides a comprehensive analysis of the global Third Party Payment Market, encompassing market dynamics, growth trends, regional analysis, and key player strategies. With a study period spanning 2019-2033, a base year of 2025, and a forecast period of 2025-2033, this report is an essential resource for industry professionals, investors, and strategic decision-makers. The market is segmented by type (Online, Mobile, Point of Sale) and end-user (BFSI, Retail, E-commerce, Other). The total market size in 2025 is estimated at xx Million.
Third Party Payment Market Dynamics & Structure
The Third Party Payment Market is characterized by intense competition, rapid technological innovation, and evolving regulatory landscapes. Market concentration is moderate, with several major players holding significant shares, but also room for smaller, niche players. The market is witnessing continuous M&A activity, with larger players strategically acquiring smaller firms to expand their capabilities and market reach. Technological innovations, such as advancements in mobile payment technologies and the rise of digital wallets, are key growth drivers. Regulatory frameworks, varying significantly across geographies, present both opportunities and challenges for market participants. The increasing adoption of e-commerce and digital transactions fuels market growth, while traditional payment methods remain significant competitive substitutes.
- Market Concentration: Moderately concentrated, with top 5 players holding approximately xx% market share in 2025.
- Technological Innovation: Focus on enhanced security, faster processing speeds, and seamless integration with other platforms.
- Regulatory Frameworks: Varying compliance requirements across regions pose significant challenges.
- Competitive Substitutes: Traditional payment methods like cash and checks still hold a share, but their dominance is declining.
- M&A Activity: A high number of mergers and acquisitions are expected in the next few years, leading to further market consolidation. Approximately xx M&A deals were recorded between 2019 and 2024.
- End-User Demographics: Shift towards younger demographics driving mobile payment adoption.
Third Party Payment Market Growth Trends & Insights
The Third Party Payment Market is experiencing robust growth, driven by several key factors. The increasing adoption of e-commerce and mobile commerce is a significant catalyst. Technological advancements, such as the rise of contactless payments, biometric authentication, and AI-powered fraud prevention, are further accelerating market expansion. Consumer behavior is shifting towards cashless transactions, which is positively impacting market growth. The market size is projected to reach xx Million by 2033, exhibiting a Compound Annual Growth Rate (CAGR) of xx% during the forecast period. Market penetration is expected to increase from xx% in 2025 to xx% by 2033.
Dominant Regions, Countries, or Segments in Third Party Payment Market
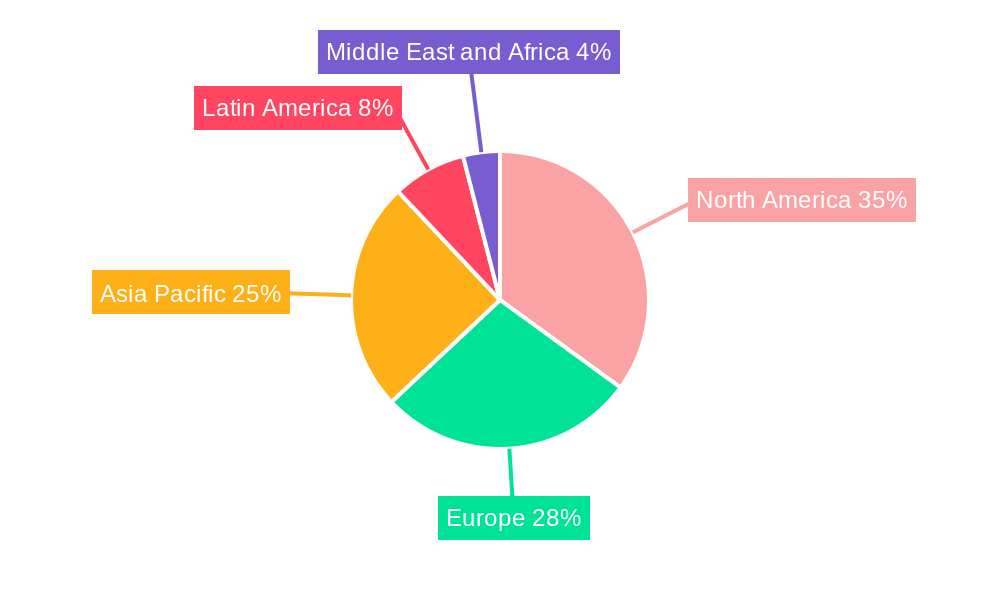
North America currently dominates the Third Party Payment Market, followed by Europe and Asia-Pacific. However, Asia-Pacific is poised for significant growth driven by rapid smartphone penetration and increasing internet usage. Within the segments, the online payment segment holds the largest market share, followed by mobile and point-of-sale payments. The E-commerce sector is the largest end-user segment, with substantial contributions from BFSI and Retail sectors.
- North America Dominance: Driven by strong e-commerce adoption, advanced technology infrastructure, and a robust regulatory environment.
- Asia-Pacific Growth Potential: High smartphone penetration, expanding internet access, and a large and young population fuel growth.
- Online Payment Segment Leadership: Convenience, accessibility, and wide acceptance drive its dominance.
- E-commerce Sector as a Major Driver: The rapid growth of online shopping fuels demand for third-party payment solutions.
- BFSI and Retail Sector Contributions: Growing adoption of digital payment systems within these sectors also significantly contributes to market growth.
Third Party Payment Market Product Landscape
The Third Party Payment Market offers a diverse range of products, including online payment gateways, mobile payment apps, point-of-sale systems, and digital wallets. These products emphasize user-friendliness, security, and seamless integration with various platforms. Key innovations include biometrics, blockchain technology, and AI-powered fraud detection systems, enhancing security and improving the overall user experience. Competition is fierce, with companies continuously striving to differentiate their offerings through unique value propositions and technological advancements.
Key Drivers, Barriers & Challenges in Third Party Payment Market
Key Drivers:
- The increasing adoption of e-commerce and mobile commerce is driving the growth of third-party payment solutions.
- Technological advancements, such as contactless payments and biometric authentication, enhance convenience and security.
- Favorable government regulations and policies promote the growth of digital payment systems.
Challenges and Restraints:
- Security concerns and fraud remain significant challenges for the industry. Losses due to fraud are estimated at xx Million annually.
- Regulatory complexities and compliance requirements across different regions create hurdles.
- Intense competition and pricing pressures from established players and new entrants create challenges.
Emerging Opportunities in Third Party Payment Market
- Growing adoption of Buy Now Pay Later (BNPL) services presents a significant opportunity.
- Expansion into underserved markets, particularly in developing economies, offers untapped potential.
- Integration of emerging technologies, such as AI and blockchain, can enhance security and efficiency.
Growth Accelerators in the Third Party Payment Market Industry
Technological advancements, strategic partnerships, and expansion into new markets are key growth accelerators. The development of innovative payment solutions, such as embedded finance and super apps, will further drive market growth.
Key Players Shaping the Third Party Payment Market Market
- Stripe Inc
- Authorize.Net (CyberSource Corporation)
- PayPal Holdings Inc
- Adyen NV
- First Data Corporation (Fiserv Inc)
- Amazon Payments Inc
- Alipay com Co Ltd
- 2checkout Com Inc (Avangate BV)
- One 97 Communications Limite
- WePay Inc (JPMorgan Chase & Co)
Notable Milestones in Third Party Payment Market Sector
- October 2023: PayPal Holdings Inc. announced Apple Wallet integration for PayPal and Venmo cards, enhancing in-store, online, and app-based payments.
- May 2023: Stripe Inc. partnered with Lotus, integrating payment solutions into the sales process for their electric vehicles, streamlining the customer experience.
In-Depth Third Party Payment Market Market Outlook
The Third Party Payment Market is poised for sustained growth, driven by technological innovation, expanding e-commerce adoption, and increased consumer preference for digital payments. Strategic partnerships and expansion into emerging markets will further accelerate growth. The market presents significant opportunities for established players and new entrants alike.
Third Party Payment Market Segmentation
-
1. Type
- 1.1. Online
- 1.2. Mobile
- 1.3. Point of Sale
-
2. End User
- 2.1. BFSI
- 2.2. Retail
- 2.3. E-Commerce
- 2.4. Other End Users
Third Party Payment Market Segmentation By Geography
- 1. North America
- 2. Europe
- 3. Asia
- 4. Australia and New Zealand
- 5. Latin America
- 6. Middle East and Africa
Third Party Payment Market REPORT HIGHLIGHTS
| Aspects | Details |
|---|---|
| Study Period | 2019-2033 |
| Base Year | 2024 |
| Estimated Year | 2025 |
| Forecast Period | 2025-2033 |
| Historical Period | 2019-2024 |
| Growth Rate | CAGR of 35.10% from 2019-2033 |
| Segmentation |
|
Table of Contents
- 1. Introduction
- 1.1. Research Scope
- 1.2. Market Segmentation
- 1.3. Research Methodology
- 1.4. Definitions and Assumptions
- 2. Executive Summary
- 2.1. Introduction
- 3. Market Dynamics
- 3.1. Introduction
- 3.2. Market Drivers
- 3.2.1. Penetration of Internet Leading to Proliferation of Digital Payments; Cloud Based Systems Leading to Growth of B2B Sales and also Higher Sales in the POS Segment; Growth of E-Commerce Across the High Growth Regions of the World
- 3.3. Market Restrains
- 3.3.1. Security and Privacy Concerns to Restrain the Market
- 3.4. Market Trends
- 3.4.1. The Point of Sale Segment is Expected to Drive the Market
- 4. Market Factor Analysis
- 4.1. Porters Five Forces
- 4.2. Supply/Value Chain
- 4.3. PESTEL analysis
- 4.4. Market Entropy
- 4.5. Patent/Trademark Analysis
- 5. Global Third Party Payment Market Analysis, Insights and Forecast, 2019-2031
- 5.1. Market Analysis, Insights and Forecast - by Type
- 5.1.1. Online
- 5.1.2. Mobile
- 5.1.3. Point of Sale
- 5.2. Market Analysis, Insights and Forecast - by End User
- 5.2.1. BFSI
- 5.2.2. Retail
- 5.2.3. E-Commerce
- 5.2.4. Other End Users
- 5.3. Market Analysis, Insights and Forecast - by Region
- 5.3.1. North America
- 5.3.2. Europe
- 5.3.3. Asia
- 5.3.4. Australia and New Zealand
- 5.3.5. Latin America
- 5.3.6. Middle East and Africa
- 5.1. Market Analysis, Insights and Forecast - by Type
- 6. North America Third Party Payment Market Analysis, Insights and Forecast, 2019-2031
- 6.1. Market Analysis, Insights and Forecast - by Type
- 6.1.1. Online
- 6.1.2. Mobile
- 6.1.3. Point of Sale
- 6.2. Market Analysis, Insights and Forecast - by End User
- 6.2.1. BFSI
- 6.2.2. Retail
- 6.2.3. E-Commerce
- 6.2.4. Other End Users
- 6.1. Market Analysis, Insights and Forecast - by Type
- 7. Europe Third Party Payment Market Analysis, Insights and Forecast, 2019-2031
- 7.1. Market Analysis, Insights and Forecast - by Type
- 7.1.1. Online
- 7.1.2. Mobile
- 7.1.3. Point of Sale
- 7.2. Market Analysis, Insights and Forecast - by End User
- 7.2.1. BFSI
- 7.2.2. Retail
- 7.2.3. E-Commerce
- 7.2.4. Other End Users
- 7.1. Market Analysis, Insights and Forecast - by Type
- 8. Asia Third Party Payment Market Analysis, Insights and Forecast, 2019-2031
- 8.1. Market Analysis, Insights and Forecast - by Type
- 8.1.1. Online
- 8.1.2. Mobile
- 8.1.3. Point of Sale
- 8.2. Market Analysis, Insights and Forecast - by End User
- 8.2.1. BFSI
- 8.2.2. Retail
- 8.2.3. E-Commerce
- 8.2.4. Other End Users
- 8.1. Market Analysis, Insights and Forecast - by Type
- 9. Australia and New Zealand Third Party Payment Market Analysis, Insights and Forecast, 2019-2031
- 9.1. Market Analysis, Insights and Forecast - by Type
- 9.1.1. Online
- 9.1.2. Mobile
- 9.1.3. Point of Sale
- 9.2. Market Analysis, Insights and Forecast - by End User
- 9.2.1. BFSI
- 9.2.2. Retail
- 9.2.3. E-Commerce
- 9.2.4. Other End Users
- 9.1. Market Analysis, Insights and Forecast - by Type
- 10. Latin America Third Party Payment Market Analysis, Insights and Forecast, 2019-2031
- 10.1. Market Analysis, Insights and Forecast - by Type
- 10.1.1. Online
- 10.1.2. Mobile
- 10.1.3. Point of Sale
- 10.2. Market Analysis, Insights and Forecast - by End User
- 10.2.1. BFSI
- 10.2.2. Retail
- 10.2.3. E-Commerce
- 10.2.4. Other End Users
- 10.1. Market Analysis, Insights and Forecast - by Type
- 11. Middle East and Africa Third Party Payment Market Analysis, Insights and Forecast, 2019-2031
- 11.1. Market Analysis, Insights and Forecast - by Type
- 11.1.1. Online
- 11.1.2. Mobile
- 11.1.3. Point of Sale
- 11.2. Market Analysis, Insights and Forecast - by End User
- 11.2.1. BFSI
- 11.2.2. Retail
- 11.2.3. E-Commerce
- 11.2.4. Other End Users
- 11.1. Market Analysis, Insights and Forecast - by Type
- 12. North America Third Party Payment Market Analysis, Insights and Forecast, 2019-2031
- 12.1. Market Analysis, Insights and Forecast - By Country/Sub-region
- 12.1.1.
- 13. Europe Third Party Payment Market Analysis, Insights and Forecast, 2019-2031
- 13.1. Market Analysis, Insights and Forecast - By Country/Sub-region
- 13.1.1.
- 14. Asia Pacific Third Party Payment Market Analysis, Insights and Forecast, 2019-2031
- 14.1. Market Analysis, Insights and Forecast - By Country/Sub-region
- 14.1.1.
- 15. Latin America Third Party Payment Market Analysis, Insights and Forecast, 2019-2031
- 15.1. Market Analysis, Insights and Forecast - By Country/Sub-region
- 15.1.1.
- 16. Middle East and Africa Third Party Payment Market Analysis, Insights and Forecast, 2019-2031
- 16.1. Market Analysis, Insights and Forecast - By Country/Sub-region
- 16.1.1.
- 17. Competitive Analysis
- 17.1. Global Market Share Analysis 2024
- 17.2. Company Profiles
- 17.2.1 Stripe Inc
- 17.2.1.1. Overview
- 17.2.1.2. Products
- 17.2.1.3. SWOT Analysis
- 17.2.1.4. Recent Developments
- 17.2.1.5. Financials (Based on Availability)
- 17.2.2 Authorize Net (CyberSource Corporation)
- 17.2.2.1. Overview
- 17.2.2.2. Products
- 17.2.2.3. SWOT Analysis
- 17.2.2.4. Recent Developments
- 17.2.2.5. Financials (Based on Availability)
- 17.2.3 PayPal Holdings Inc
- 17.2.3.1. Overview
- 17.2.3.2. Products
- 17.2.3.3. SWOT Analysis
- 17.2.3.4. Recent Developments
- 17.2.3.5. Financials (Based on Availability)
- 17.2.4 Adyen NV
- 17.2.4.1. Overview
- 17.2.4.2. Products
- 17.2.4.3. SWOT Analysis
- 17.2.4.4. Recent Developments
- 17.2.4.5. Financials (Based on Availability)
- 17.2.5 First Data Corporation (Fiserv Inc )
- 17.2.5.1. Overview
- 17.2.5.2. Products
- 17.2.5.3. SWOT Analysis
- 17.2.5.4. Recent Developments
- 17.2.5.5. Financials (Based on Availability)
- 17.2.6 Amazon Payments Inc
- 17.2.6.1. Overview
- 17.2.6.2. Products
- 17.2.6.3. SWOT Analysis
- 17.2.6.4. Recent Developments
- 17.2.6.5. Financials (Based on Availability)
- 17.2.7 Alipay com Co Ltd
- 17.2.7.1. Overview
- 17.2.7.2. Products
- 17.2.7.3. SWOT Analysis
- 17.2.7.4. Recent Developments
- 17.2.7.5. Financials (Based on Availability)
- 17.2.8 2checkout Com Inc (Avangate BV)
- 17.2.8.1. Overview
- 17.2.8.2. Products
- 17.2.8.3. SWOT Analysis
- 17.2.8.4. Recent Developments
- 17.2.8.5. Financials (Based on Availability)
- 17.2.9 One 97 Communications Limite
- 17.2.9.1. Overview
- 17.2.9.2. Products
- 17.2.9.3. SWOT Analysis
- 17.2.9.4. Recent Developments
- 17.2.9.5. Financials (Based on Availability)
- 17.2.10 WePay Inc (JPMorgan Chase & Co )
- 17.2.10.1. Overview
- 17.2.10.2. Products
- 17.2.10.3. SWOT Analysis
- 17.2.10.4. Recent Developments
- 17.2.10.5. Financials (Based on Availability)
- 17.2.1 Stripe Inc
List of Figures
- Figure 1: Global Third Party Payment Market Revenue Breakdown (Million, %) by Region 2024 & 2032
- Figure 2: North America Third Party Payment Market Revenue (Million), by Country 2024 & 2032
- Figure 3: North America Third Party Payment Market Revenue Share (%), by Country 2024 & 2032
- Figure 4: Europe Third Party Payment Market Revenue (Million), by Country 2024 & 2032
- Figure 5: Europe Third Party Payment Market Revenue Share (%), by Country 2024 & 2032
- Figure 6: Asia Pacific Third Party Payment Market Revenue (Million), by Country 2024 & 2032
- Figure 7: Asia Pacific Third Party Payment Market Revenue Share (%), by Country 2024 & 2032
- Figure 8: Latin America Third Party Payment Market Revenue (Million), by Country 2024 & 2032
- Figure 9: Latin America Third Party Payment Market Revenue Share (%), by Country 2024 & 2032
- Figure 10: Middle East and Africa Third Party Payment Market Revenue (Million), by Country 2024 & 2032
- Figure 11: Middle East and Africa Third Party Payment Market Revenue Share (%), by Country 2024 & 2032
- Figure 12: North America Third Party Payment Market Revenue (Million), by Type 2024 & 2032
- Figure 13: North America Third Party Payment Market Revenue Share (%), by Type 2024 & 2032
- Figure 14: North America Third Party Payment Market Revenue (Million), by End User 2024 & 2032
- Figure 15: North America Third Party Payment Market Revenue Share (%), by End User 2024 & 2032
- Figure 16: North America Third Party Payment Market Revenue (Million), by Country 2024 & 2032
- Figure 17: North America Third Party Payment Market Revenue Share (%), by Country 2024 & 2032
- Figure 18: Europe Third Party Payment Market Revenue (Million), by Type 2024 & 2032
- Figure 19: Europe Third Party Payment Market Revenue Share (%), by Type 2024 & 2032
- Figure 20: Europe Third Party Payment Market Revenue (Million), by End User 2024 & 2032
- Figure 21: Europe Third Party Payment Market Revenue Share (%), by End User 2024 & 2032
- Figure 22: Europe Third Party Payment Market Revenue (Million), by Country 2024 & 2032
- Figure 23: Europe Third Party Payment Market Revenue Share (%), by Country 2024 & 2032
- Figure 24: Asia Third Party Payment Market Revenue (Million), by Type 2024 & 2032
- Figure 25: Asia Third Party Payment Market Revenue Share (%), by Type 2024 & 2032
- Figure 26: Asia Third Party Payment Market Revenue (Million), by End User 2024 & 2032
- Figure 27: Asia Third Party Payment Market Revenue Share (%), by End User 2024 & 2032
- Figure 28: Asia Third Party Payment Market Revenue (Million), by Country 2024 & 2032
- Figure 29: Asia Third Party Payment Market Revenue Share (%), by Country 2024 & 2032
- Figure 30: Australia and New Zealand Third Party Payment Market Revenue (Million), by Type 2024 & 2032
- Figure 31: Australia and New Zealand Third Party Payment Market Revenue Share (%), by Type 2024 & 2032
- Figure 32: Australia and New Zealand Third Party Payment Market Revenue (Million), by End User 2024 & 2032
- Figure 33: Australia and New Zealand Third Party Payment Market Revenue Share (%), by End User 2024 & 2032
- Figure 34: Australia and New Zealand Third Party Payment Market Revenue (Million), by Country 2024 & 2032
- Figure 35: Australia and New Zealand Third Party Payment Market Revenue Share (%), by Country 2024 & 2032
- Figure 36: Latin America Third Party Payment Market Revenue (Million), by Type 2024 & 2032
- Figure 37: Latin America Third Party Payment Market Revenue Share (%), by Type 2024 & 2032
- Figure 38: Latin America Third Party Payment Market Revenue (Million), by End User 2024 & 2032
- Figure 39: Latin America Third Party Payment Market Revenue Share (%), by End User 2024 & 2032
- Figure 40: Latin America Third Party Payment Market Revenue (Million), by Country 2024 & 2032
- Figure 41: Latin America Third Party Payment Market Revenue Share (%), by Country 2024 & 2032
- Figure 42: Middle East and Africa Third Party Payment Market Revenue (Million), by Type 2024 & 2032
- Figure 43: Middle East and Africa Third Party Payment Market Revenue Share (%), by Type 2024 & 2032
- Figure 44: Middle East and Africa Third Party Payment Market Revenue (Million), by End User 2024 & 2032
- Figure 45: Middle East and Africa Third Party Payment Market Revenue Share (%), by End User 2024 & 2032
- Figure 46: Middle East and Africa Third Party Payment Market Revenue (Million), by Country 2024 & 2032
- Figure 47: Middle East and Africa Third Party Payment Market Revenue Share (%), by Country 2024 & 2032
List of Tables
- Table 1: Global Third Party Payment Market Revenue Million Forecast, by Region 2019 & 2032
- Table 2: Global Third Party Payment Market Revenue Million Forecast, by Type 2019 & 2032
- Table 3: Global Third Party Payment Market Revenue Million Forecast, by End User 2019 & 2032
- Table 4: Global Third Party Payment Market Revenue Million Forecast, by Region 2019 & 2032
- Table 5: Global Third Party Payment Market Revenue Million Forecast, by Country 2019 & 2032
- Table 6: Third Party Payment Market Revenue (Million) Forecast, by Application 2019 & 2032
- Table 7: Global Third Party Payment Market Revenue Million Forecast, by Country 2019 & 2032
- Table 8: Third Party Payment Market Revenue (Million) Forecast, by Application 2019 & 2032
- Table 9: Global Third Party Payment Market Revenue Million Forecast, by Country 2019 & 2032
- Table 10: Third Party Payment Market Revenue (Million) Forecast, by Application 2019 & 2032
- Table 11: Global Third Party Payment Market Revenue Million Forecast, by Country 2019 & 2032
- Table 12: Third Party Payment Market Revenue (Million) Forecast, by Application 2019 & 2032
- Table 13: Global Third Party Payment Market Revenue Million Forecast, by Country 2019 & 2032
- Table 14: Third Party Payment Market Revenue (Million) Forecast, by Application 2019 & 2032
- Table 15: Global Third Party Payment Market Revenue Million Forecast, by Type 2019 & 2032
- Table 16: Global Third Party Payment Market Revenue Million Forecast, by End User 2019 & 2032
- Table 17: Global Third Party Payment Market Revenue Million Forecast, by Country 2019 & 2032
- Table 18: Global Third Party Payment Market Revenue Million Forecast, by Type 2019 & 2032
- Table 19: Global Third Party Payment Market Revenue Million Forecast, by End User 2019 & 2032
- Table 20: Global Third Party Payment Market Revenue Million Forecast, by Country 2019 & 2032
- Table 21: Global Third Party Payment Market Revenue Million Forecast, by Type 2019 & 2032
- Table 22: Global Third Party Payment Market Revenue Million Forecast, by End User 2019 & 2032
- Table 23: Global Third Party Payment Market Revenue Million Forecast, by Country 2019 & 2032
- Table 24: Global Third Party Payment Market Revenue Million Forecast, by Type 2019 & 2032
- Table 25: Global Third Party Payment Market Revenue Million Forecast, by End User 2019 & 2032
- Table 26: Global Third Party Payment Market Revenue Million Forecast, by Country 2019 & 2032
- Table 27: Global Third Party Payment Market Revenue Million Forecast, by Type 2019 & 2032
- Table 28: Global Third Party Payment Market Revenue Million Forecast, by End User 2019 & 2032
- Table 29: Global Third Party Payment Market Revenue Million Forecast, by Country 2019 & 2032
- Table 30: Global Third Party Payment Market Revenue Million Forecast, by Type 2019 & 2032
- Table 31: Global Third Party Payment Market Revenue Million Forecast, by End User 2019 & 2032
- Table 32: Global Third Party Payment Market Revenue Million Forecast, by Country 2019 & 2032
Frequently Asked Questions
1. What is the projected Compound Annual Growth Rate (CAGR) of the Third Party Payment Market?
The projected CAGR is approximately 35.10%.
2. Which companies are prominent players in the Third Party Payment Market?
Key companies in the market include Stripe Inc, Authorize Net (CyberSource Corporation), PayPal Holdings Inc, Adyen NV, First Data Corporation (Fiserv Inc ), Amazon Payments Inc, Alipay com Co Ltd, 2checkout Com Inc (Avangate BV), One 97 Communications Limite, WePay Inc (JPMorgan Chase & Co ).
3. What are the main segments of the Third Party Payment Market?
The market segments include Type, End User.
4. Can you provide details about the market size?
The market size is estimated to be USD 55.70 Million as of 2022.
5. What are some drivers contributing to market growth?
Penetration of Internet Leading to Proliferation of Digital Payments; Cloud Based Systems Leading to Growth of B2B Sales and also Higher Sales in the POS Segment; Growth of E-Commerce Across the High Growth Regions of the World.
6. What are the notable trends driving market growth?
The Point of Sale Segment is Expected to Drive the Market.
7. Are there any restraints impacting market growth?
Security and Privacy Concerns to Restrain the Market.
8. Can you provide examples of recent developments in the market?
October 2023: PayPal Holdings Inc. announced that customers can add their eligible PayPal and Venmo credit or debit cards to Apple Wallet and begin making payments. Customers can tap their iPhone and Apple Watch. PayPal and Venmo credit or debit card holders can make payments quickly and securely in-store, online, or on their favorite apps using Apple Pay.
9. What pricing options are available for accessing the report?
Pricing options include single-user, multi-user, and enterprise licenses priced at USD 4750, USD 5250, and USD 8750 respectively.
10. Is the market size provided in terms of value or volume?
The market size is provided in terms of value, measured in Million.
11. Are there any specific market keywords associated with the report?
Yes, the market keyword associated with the report is "Third Party Payment Market," which aids in identifying and referencing the specific market segment covered.
12. How do I determine which pricing option suits my needs best?
The pricing options vary based on user requirements and access needs. Individual users may opt for single-user licenses, while businesses requiring broader access may choose multi-user or enterprise licenses for cost-effective access to the report.
13. Are there any additional resources or data provided in the Third Party Payment Market report?
While the report offers comprehensive insights, it's advisable to review the specific contents or supplementary materials provided to ascertain if additional resources or data are available.
14. How can I stay updated on further developments or reports in the Third Party Payment Market?
To stay informed about further developments, trends, and reports in the Third Party Payment Market, consider subscribing to industry newsletters, following relevant companies and organizations, or regularly checking reputable industry news sources and publications.
Methodology
Step 1 - Identification of Relevant Samples Size from Population Database


Step 2 - Approaches for Defining Global Market Size (Value, Volume* & Price*)

Note*: In applicable scenarios
Step 3 - Data Sources
Primary Research
- Web Analytics
- Survey Reports
- Research Institute
- Latest Research Reports
- Opinion Leaders
Secondary Research
- Annual Reports
- White Paper
- Latest Press Release
- Industry Association
- Paid Database
- Investor Presentations

Step 4 - Data Triangulation
Involves using different sources of information in order to increase the validity of a study
These sources are likely to be stakeholders in a program - participants, other researchers, program staff, other community members, and so on.
Then we put all data in single framework & apply various statistical tools to find out the dynamic on the market.
During the analysis stage, feedback from the stakeholder groups would be compared to determine areas of agreement as well as areas of divergence
