

Key Insights
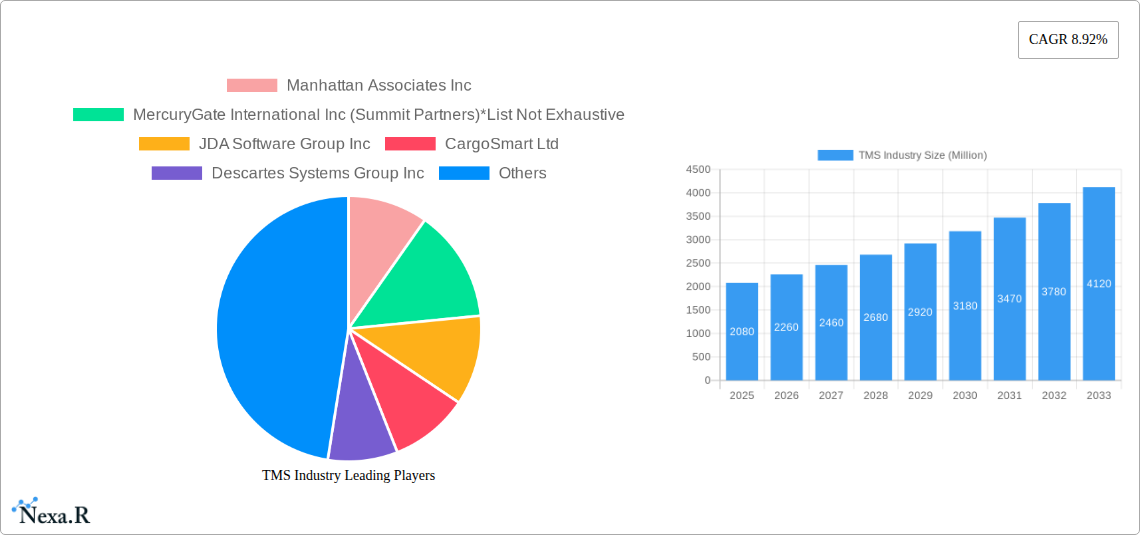
The Transportation Management System (TMS) market is experiencing robust growth, projected to reach $2.08 billion in 2025 and maintain a Compound Annual Growth Rate (CAGR) of 8.92% from 2025 to 2033. This expansion is driven by several key factors. The increasing complexity of global supply chains necessitates efficient and cost-effective transportation solutions, fueling demand for sophisticated TMS software. E-commerce's continued surge further intensifies this need, demanding real-time visibility and optimized delivery processes. Furthermore, the adoption of cloud-based TMS solutions is accelerating, offering scalability, accessibility, and reduced IT infrastructure costs for businesses of all sizes. The integration of advanced technologies like Artificial Intelligence (AI) and machine learning into TMS platforms is enhancing route optimization, predictive analytics, and overall supply chain efficiency. This trend is particularly pronounced among large enterprises, which are actively investing in comprehensive TMS solutions to streamline operations and gain a competitive edge. However, the high initial investment costs associated with implementing a TMS can act as a restraint, particularly for small and medium-sized enterprises (SMEs). Nevertheless, the long-term benefits in terms of cost savings, improved efficiency, and enhanced customer satisfaction are compelling businesses to overcome this hurdle.
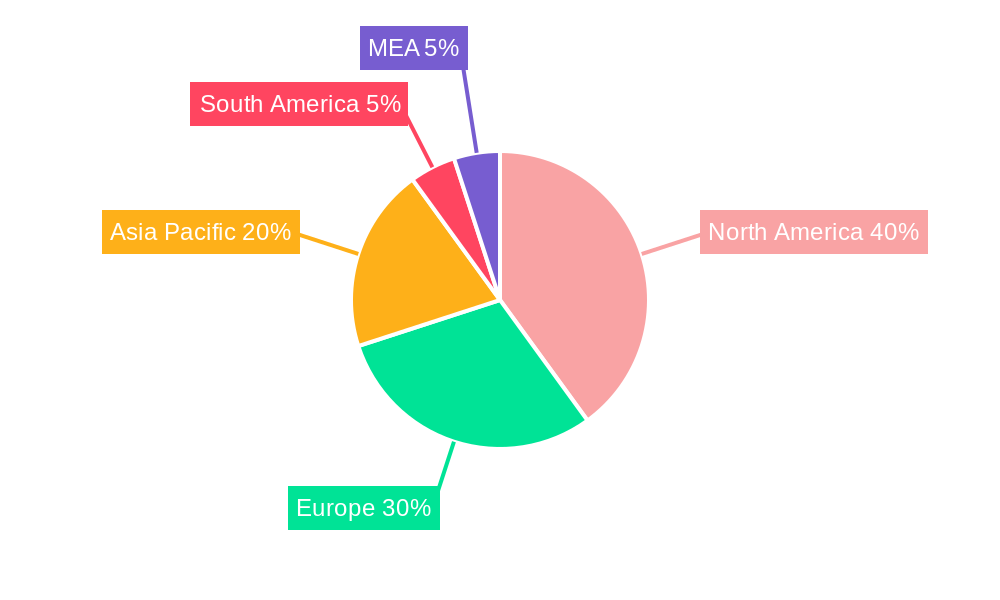
The market segmentation reveals strong growth across various modes of transportation, with roadways currently dominating, followed by railways and airways. The cloud deployment model is witnessing the fastest adoption rate, driven by its inherent advantages. While large enterprises are leading the adoption curve, SMEs are increasingly recognizing the value proposition of TMS solutions and are gradually adopting them. Geographically, North America and Europe currently hold significant market shares, driven by strong technological adoption and established supply chains. However, the Asia-Pacific region exhibits substantial growth potential, fueled by the rapid expansion of e-commerce and industrialization in countries like China and India. The Middle East and Africa region is also expected to witness steady growth, albeit at a slower pace compared to other regions. The continued expansion of global trade, coupled with advancements in TMS technology, will propel the market to even greater heights in the coming years, making it a lucrative segment for both vendors and businesses seeking optimized logistics solutions.
This comprehensive report provides an in-depth analysis of the Transportation Management System (TMS) industry, encompassing market dynamics, growth trends, regional insights, and key player strategies. With a study period spanning 2019-2033, a base year of 2025, and a forecast period of 2025-2033, this report offers crucial data for businesses and investors seeking to navigate this evolving landscape. The report also covers parent market (Supply Chain Management) and child markets (Roadways, Railways, Airways TMS).
TMS Industry Market Dynamics & Structure
The TMS market is characterized by a moderately concentrated structure, with several major players holding significant market share. The market size in 2025 is estimated at xx Million. However, the emergence of smaller, specialized TMS providers and the increasing adoption of cloud-based solutions are fostering competition. Technological innovation, particularly in areas like AI and machine learning for route optimization and predictive analytics, is a key driver. Regulatory frameworks concerning data privacy and transportation compliance also significantly impact the market. The prevalence of mergers and acquisitions (M&A) reflects the consolidation trend within the industry.
- Market Concentration: Top 5 players hold approximately xx% of the market share in 2025.
- M&A Activity: An estimated xx M&A deals occurred between 2019 and 2024.
- Technological Innovation: AI-powered route optimization and predictive analytics are key drivers.
- Regulatory Landscape: Data privacy regulations and transportation compliance standards influence market dynamics.
- Competitive Substitutes: Rudimentary in-house systems and basic spreadsheet solutions pose a competitive threat to dedicated TMS solutions.
TMS Industry Growth Trends & Insights
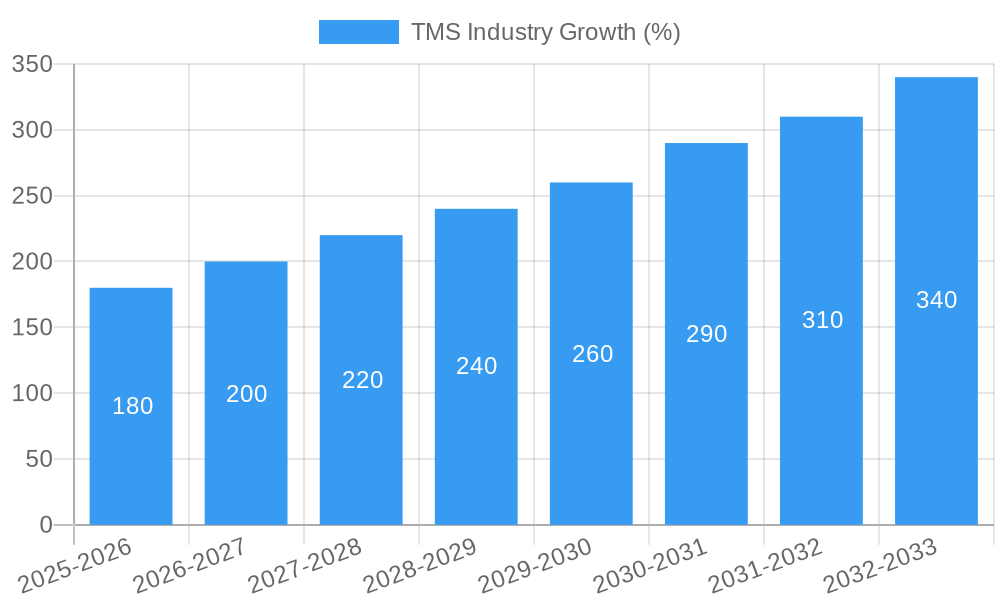
The TMS market experienced robust growth during the historical period (2019-2024), with a CAGR of xx%. This growth is attributed to factors such as the increasing adoption of cloud-based TMS solutions, the growing e-commerce sector driving demand for efficient logistics, and the increasing focus on supply chain optimization. The market is expected to continue its growth trajectory during the forecast period (2025-2033), driven by factors such as increasing digitization, the expanding adoption of IoT devices, and increasing automation in logistics. Market penetration is currently estimated at xx% among large enterprises and is expected to increase to xx% by 2033.
Dominant Regions, Countries, or Segments in TMS Industry
The North American region currently dominates the TMS market, followed by Europe. Within these regions, large enterprises are the primary adopters of TMS solutions, although SMEs are showing increased interest due to the availability of affordable cloud-based options. By mode of transportation, Roadways currently holds the largest segment of the market due to its pervasive use in logistics, however, increasing adoption across Railways and Airways is expected to broaden the sector’s reach.
- By Mode of Transportation: Roadways (xx Million), Railways (xx Million), Airways (xx Million) in 2025.
- By Deployment: Cloud deployment is experiencing rapid growth, surpassing on-premise solutions.
- By Enterprise Size: Large Enterprises dominate the market currently, but SME adoption is rising.
- Key Drivers: Increased e-commerce activity, government infrastructure investments, and technological advancements.
TMS Industry Product Landscape
TMS solutions are evolving from basic shipment tracking and routing to sophisticated platforms incorporating AI, machine learning, and real-time visibility. These advancements enable predictive analytics for better decision-making, automated processes for enhanced efficiency, and improved collaboration across the supply chain. Key features include route optimization, load planning, carrier management, and yard management. Unique selling propositions often include user-friendly interfaces, integration capabilities with existing enterprise systems, and advanced analytics dashboards.
Key Drivers, Barriers & Challenges in TMS Industry
Key Drivers:
- Growing e-commerce and globalization increasing demand for efficient logistics.
- Technological advancements in AI, machine learning, and IoT enhance TMS capabilities.
- Government initiatives promoting digitalization and infrastructure development.
Key Challenges:
- High initial investment costs for implementing sophisticated TMS solutions.
- Integration challenges with legacy systems and data silos.
- Data security and privacy concerns related to sensitive shipment information.
- The need for skilled personnel to operate and maintain these systems.
Emerging Opportunities in TMS Industry
- Expansion into untapped markets, particularly in developing economies.
- Development of specialized TMS solutions for specific industries (e.g., healthcare, food & beverage).
- Integration of blockchain technology to enhance supply chain transparency and security.
- Leveraging advanced analytics to predict and mitigate disruptions.
Growth Accelerators in the TMS Industry
Continued advancements in AI and machine learning, strategic partnerships between TMS providers and logistics companies, and expanding adoption across various industries will propel market growth. Government regulations promoting digitalization and initiatives to improve transportation infrastructure further stimulate market expansion.
Key Players Shaping the TMS Industry Market
- Manhattan Associates Inc
- MercuryGate International Inc (Summit Partners)
- JDA Software Group Inc
- CargoSmart Ltd
- Descartes Systems Group Inc
- Oracle Corporation
- Precision Software Inc (QAD Inc)
- 3Gtms Inc (Sumeru Equity Partners)
- SAP SE
Notable Milestones in TMS Industry Sector
- March 2022: Snowflake and Blue Yonder partnered to improve supply chain data access.
- February 2022: RHI Magnesita implemented Oracle Fusion Cloud Transportation Management.
In-Depth TMS Industry Market Outlook
The TMS market is poised for significant growth in the coming years, driven by technological innovation, increasing demand for efficient logistics, and expanding adoption across various industries. Strategic partnerships, expansion into new markets, and the development of innovative TMS solutions will create lucrative opportunities for businesses in this dynamic sector. The market is expected to reach xx Million by 2033.
TMS Industry Segmentation
-
1. Mode of Transportation
- 1.1. Roadways
- 1.2. Railways
- 1.3. Airways
-
2. Deployment
- 2.1. On-premise
- 2.2. Cloud
-
3. Size of Enterprise
- 3.1. SMEs
- 3.2. Large Enterprises
TMS Industry Segmentation By Geography
- 1. North America
- 2. Europe
- 3. Asia Pacific
- 4. Latin America
- 5. Middle East and Africa
TMS Industry REPORT HIGHLIGHTS
| Aspects | Details |
|---|---|
| Study Period | 2019-2033 |
| Base Year | 2024 |
| Estimated Year | 2025 |
| Forecast Period | 2025-2033 |
| Historical Period | 2019-2024 |
| Growth Rate | CAGR of 8.92% from 2019-2033 |
| Segmentation |
|
Table of Contents
- 1. Introduction
- 1.1. Research Scope
- 1.2. Market Segmentation
- 1.3. Research Methodology
- 1.4. Definitions and Assumptions
- 2. Executive Summary
- 2.1. Introduction
- 3. Market Dynamics
- 3.1. Introduction
- 3.2. Market Drivers
- 3.2.1. Integration of RFID Technologies for Managing Supply Chain Activities; Increasing Use of Cloud Computing Technologies in Supply Chain Management
- 3.3. Market Restrains
- 3.3.1. Lack of Awareness Regarding Transport Management System among Consumers
- 3.4. Market Trends
- 3.4.1. Increasing Use of Cloud and Artificial Intelligence in Supply Chain Management
- 4. Market Factor Analysis
- 4.1. Porters Five Forces
- 4.2. Supply/Value Chain
- 4.3. PESTEL analysis
- 4.4. Market Entropy
- 4.5. Patent/Trademark Analysis
- 5. Global TMS Industry Analysis, Insights and Forecast, 2019-2031
- 5.1. Market Analysis, Insights and Forecast - by Mode of Transportation
- 5.1.1. Roadways
- 5.1.2. Railways
- 5.1.3. Airways
- 5.2. Market Analysis, Insights and Forecast - by Deployment
- 5.2.1. On-premise
- 5.2.2. Cloud
- 5.3. Market Analysis, Insights and Forecast - by Size of Enterprise
- 5.3.1. SMEs
- 5.3.2. Large Enterprises
- 5.4. Market Analysis, Insights and Forecast - by Region
- 5.4.1. North America
- 5.4.2. Europe
- 5.4.3. Asia Pacific
- 5.4.4. Latin America
- 5.4.5. Middle East and Africa
- 5.1. Market Analysis, Insights and Forecast - by Mode of Transportation
- 6. North America TMS Industry Analysis, Insights and Forecast, 2019-2031
- 6.1. Market Analysis, Insights and Forecast - by Mode of Transportation
- 6.1.1. Roadways
- 6.1.2. Railways
- 6.1.3. Airways
- 6.2. Market Analysis, Insights and Forecast - by Deployment
- 6.2.1. On-premise
- 6.2.2. Cloud
- 6.3. Market Analysis, Insights and Forecast - by Size of Enterprise
- 6.3.1. SMEs
- 6.3.2. Large Enterprises
- 6.1. Market Analysis, Insights and Forecast - by Mode of Transportation
- 7. Europe TMS Industry Analysis, Insights and Forecast, 2019-2031
- 7.1. Market Analysis, Insights and Forecast - by Mode of Transportation
- 7.1.1. Roadways
- 7.1.2. Railways
- 7.1.3. Airways
- 7.2. Market Analysis, Insights and Forecast - by Deployment
- 7.2.1. On-premise
- 7.2.2. Cloud
- 7.3. Market Analysis, Insights and Forecast - by Size of Enterprise
- 7.3.1. SMEs
- 7.3.2. Large Enterprises
- 7.1. Market Analysis, Insights and Forecast - by Mode of Transportation
- 8. Asia Pacific TMS Industry Analysis, Insights and Forecast, 2019-2031
- 8.1. Market Analysis, Insights and Forecast - by Mode of Transportation
- 8.1.1. Roadways
- 8.1.2. Railways
- 8.1.3. Airways
- 8.2. Market Analysis, Insights and Forecast - by Deployment
- 8.2.1. On-premise
- 8.2.2. Cloud
- 8.3. Market Analysis, Insights and Forecast - by Size of Enterprise
- 8.3.1. SMEs
- 8.3.2. Large Enterprises
- 8.1. Market Analysis, Insights and Forecast - by Mode of Transportation
- 9. Latin America TMS Industry Analysis, Insights and Forecast, 2019-2031
- 9.1. Market Analysis, Insights and Forecast - by Mode of Transportation
- 9.1.1. Roadways
- 9.1.2. Railways
- 9.1.3. Airways
- 9.2. Market Analysis, Insights and Forecast - by Deployment
- 9.2.1. On-premise
- 9.2.2. Cloud
- 9.3. Market Analysis, Insights and Forecast - by Size of Enterprise
- 9.3.1. SMEs
- 9.3.2. Large Enterprises
- 9.1. Market Analysis, Insights and Forecast - by Mode of Transportation
- 10. Middle East and Africa TMS Industry Analysis, Insights and Forecast, 2019-2031
- 10.1. Market Analysis, Insights and Forecast - by Mode of Transportation
- 10.1.1. Roadways
- 10.1.2. Railways
- 10.1.3. Airways
- 10.2. Market Analysis, Insights and Forecast - by Deployment
- 10.2.1. On-premise
- 10.2.2. Cloud
- 10.3. Market Analysis, Insights and Forecast - by Size of Enterprise
- 10.3.1. SMEs
- 10.3.2. Large Enterprises
- 10.1. Market Analysis, Insights and Forecast - by Mode of Transportation
- 11. North America TMS Industry Analysis, Insights and Forecast, 2019-2031
- 11.1. Market Analysis, Insights and Forecast - By Country/Sub-region
- 11.1.1 United States
- 11.1.2 Canada
- 11.1.3 Mexico
- 12. Europe TMS Industry Analysis, Insights and Forecast, 2019-2031
- 12.1. Market Analysis, Insights and Forecast - By Country/Sub-region
- 12.1.1 Germany
- 12.1.2 United Kingdom
- 12.1.3 France
- 12.1.4 Spain
- 12.1.5 Italy
- 12.1.6 Spain
- 12.1.7 Belgium
- 12.1.8 Netherland
- 12.1.9 Nordics
- 12.1.10 Rest of Europe
- 13. Asia Pacific TMS Industry Analysis, Insights and Forecast, 2019-2031
- 13.1. Market Analysis, Insights and Forecast - By Country/Sub-region
- 13.1.1 China
- 13.1.2 Japan
- 13.1.3 India
- 13.1.4 South Korea
- 13.1.5 Southeast Asia
- 13.1.6 Australia
- 13.1.7 Indonesia
- 13.1.8 Phillipes
- 13.1.9 Singapore
- 13.1.10 Thailandc
- 13.1.11 Rest of Asia Pacific
- 14. South America TMS Industry Analysis, Insights and Forecast, 2019-2031
- 14.1. Market Analysis, Insights and Forecast - By Country/Sub-region
- 14.1.1 Brazil
- 14.1.2 Argentina
- 14.1.3 Peru
- 14.1.4 Chile
- 14.1.5 Colombia
- 14.1.6 Ecuador
- 14.1.7 Venezuela
- 14.1.8 Rest of South America
- 15. North America TMS Industry Analysis, Insights and Forecast, 2019-2031
- 15.1. Market Analysis, Insights and Forecast - By Country/Sub-region
- 15.1.1 United States
- 15.1.2 Canada
- 15.1.3 Mexico
- 16. MEA TMS Industry Analysis, Insights and Forecast, 2019-2031
- 16.1. Market Analysis, Insights and Forecast - By Country/Sub-region
- 16.1.1 United Arab Emirates
- 16.1.2 Saudi Arabia
- 16.1.3 South Africa
- 16.1.4 Rest of Middle East and Africa
- 17. Competitive Analysis
- 17.1. Global Market Share Analysis 2024
- 17.2. Company Profiles
- 17.2.1 Manhattan Associates Inc
- 17.2.1.1. Overview
- 17.2.1.2. Products
- 17.2.1.3. SWOT Analysis
- 17.2.1.4. Recent Developments
- 17.2.1.5. Financials (Based on Availability)
- 17.2.2 MercuryGate International Inc (Summit Partners)*List Not Exhaustive
- 17.2.2.1. Overview
- 17.2.2.2. Products
- 17.2.2.3. SWOT Analysis
- 17.2.2.4. Recent Developments
- 17.2.2.5. Financials (Based on Availability)
- 17.2.3 JDA Software Group Inc
- 17.2.3.1. Overview
- 17.2.3.2. Products
- 17.2.3.3. SWOT Analysis
- 17.2.3.4. Recent Developments
- 17.2.3.5. Financials (Based on Availability)
- 17.2.4 CargoSmart Ltd
- 17.2.4.1. Overview
- 17.2.4.2. Products
- 17.2.4.3. SWOT Analysis
- 17.2.4.4. Recent Developments
- 17.2.4.5. Financials (Based on Availability)
- 17.2.5 Descartes Systems Group Inc
- 17.2.5.1. Overview
- 17.2.5.2. Products
- 17.2.5.3. SWOT Analysis
- 17.2.5.4. Recent Developments
- 17.2.5.5. Financials (Based on Availability)
- 17.2.6 Oracle Corporation
- 17.2.6.1. Overview
- 17.2.6.2. Products
- 17.2.6.3. SWOT Analysis
- 17.2.6.4. Recent Developments
- 17.2.6.5. Financials (Based on Availability)
- 17.2.7 Precision Software Inc (QAD Inc)
- 17.2.7.1. Overview
- 17.2.7.2. Products
- 17.2.7.3. SWOT Analysis
- 17.2.7.4. Recent Developments
- 17.2.7.5. Financials (Based on Availability)
- 17.2.8 3Gtms Inc (Sumeru Equity Partners)
- 17.2.8.1. Overview
- 17.2.8.2. Products
- 17.2.8.3. SWOT Analysis
- 17.2.8.4. Recent Developments
- 17.2.8.5. Financials (Based on Availability)
- 17.2.9 SAP SE
- 17.2.9.1. Overview
- 17.2.9.2. Products
- 17.2.9.3. SWOT Analysis
- 17.2.9.4. Recent Developments
- 17.2.9.5. Financials (Based on Availability)
- 17.2.1 Manhattan Associates Inc
List of Figures
- Figure 1: Global TMS Industry Revenue Breakdown (Million, %) by Region 2024 & 2032
- Figure 2: North America TMS Industry Revenue (Million), by Country 2024 & 2032
- Figure 3: North America TMS Industry Revenue Share (%), by Country 2024 & 2032
- Figure 4: Europe TMS Industry Revenue (Million), by Country 2024 & 2032
- Figure 5: Europe TMS Industry Revenue Share (%), by Country 2024 & 2032
- Figure 6: Asia Pacific TMS Industry Revenue (Million), by Country 2024 & 2032
- Figure 7: Asia Pacific TMS Industry Revenue Share (%), by Country 2024 & 2032
- Figure 8: South America TMS Industry Revenue (Million), by Country 2024 & 2032
- Figure 9: South America TMS Industry Revenue Share (%), by Country 2024 & 2032
- Figure 10: North America TMS Industry Revenue (Million), by Country 2024 & 2032
- Figure 11: North America TMS Industry Revenue Share (%), by Country 2024 & 2032
- Figure 12: MEA TMS Industry Revenue (Million), by Country 2024 & 2032
- Figure 13: MEA TMS Industry Revenue Share (%), by Country 2024 & 2032
- Figure 14: North America TMS Industry Revenue (Million), by Mode of Transportation 2024 & 2032
- Figure 15: North America TMS Industry Revenue Share (%), by Mode of Transportation 2024 & 2032
- Figure 16: North America TMS Industry Revenue (Million), by Deployment 2024 & 2032
- Figure 17: North America TMS Industry Revenue Share (%), by Deployment 2024 & 2032
- Figure 18: North America TMS Industry Revenue (Million), by Size of Enterprise 2024 & 2032
- Figure 19: North America TMS Industry Revenue Share (%), by Size of Enterprise 2024 & 2032
- Figure 20: North America TMS Industry Revenue (Million), by Country 2024 & 2032
- Figure 21: North America TMS Industry Revenue Share (%), by Country 2024 & 2032
- Figure 22: Europe TMS Industry Revenue (Million), by Mode of Transportation 2024 & 2032
- Figure 23: Europe TMS Industry Revenue Share (%), by Mode of Transportation 2024 & 2032
- Figure 24: Europe TMS Industry Revenue (Million), by Deployment 2024 & 2032
- Figure 25: Europe TMS Industry Revenue Share (%), by Deployment 2024 & 2032
- Figure 26: Europe TMS Industry Revenue (Million), by Size of Enterprise 2024 & 2032
- Figure 27: Europe TMS Industry Revenue Share (%), by Size of Enterprise 2024 & 2032
- Figure 28: Europe TMS Industry Revenue (Million), by Country 2024 & 2032
- Figure 29: Europe TMS Industry Revenue Share (%), by Country 2024 & 2032
- Figure 30: Asia Pacific TMS Industry Revenue (Million), by Mode of Transportation 2024 & 2032
- Figure 31: Asia Pacific TMS Industry Revenue Share (%), by Mode of Transportation 2024 & 2032
- Figure 32: Asia Pacific TMS Industry Revenue (Million), by Deployment 2024 & 2032
- Figure 33: Asia Pacific TMS Industry Revenue Share (%), by Deployment 2024 & 2032
- Figure 34: Asia Pacific TMS Industry Revenue (Million), by Size of Enterprise 2024 & 2032
- Figure 35: Asia Pacific TMS Industry Revenue Share (%), by Size of Enterprise 2024 & 2032
- Figure 36: Asia Pacific TMS Industry Revenue (Million), by Country 2024 & 2032
- Figure 37: Asia Pacific TMS Industry Revenue Share (%), by Country 2024 & 2032
- Figure 38: Latin America TMS Industry Revenue (Million), by Mode of Transportation 2024 & 2032
- Figure 39: Latin America TMS Industry Revenue Share (%), by Mode of Transportation 2024 & 2032
- Figure 40: Latin America TMS Industry Revenue (Million), by Deployment 2024 & 2032
- Figure 41: Latin America TMS Industry Revenue Share (%), by Deployment 2024 & 2032
- Figure 42: Latin America TMS Industry Revenue (Million), by Size of Enterprise 2024 & 2032
- Figure 43: Latin America TMS Industry Revenue Share (%), by Size of Enterprise 2024 & 2032
- Figure 44: Latin America TMS Industry Revenue (Million), by Country 2024 & 2032
- Figure 45: Latin America TMS Industry Revenue Share (%), by Country 2024 & 2032
- Figure 46: Middle East and Africa TMS Industry Revenue (Million), by Mode of Transportation 2024 & 2032
- Figure 47: Middle East and Africa TMS Industry Revenue Share (%), by Mode of Transportation 2024 & 2032
- Figure 48: Middle East and Africa TMS Industry Revenue (Million), by Deployment 2024 & 2032
- Figure 49: Middle East and Africa TMS Industry Revenue Share (%), by Deployment 2024 & 2032
- Figure 50: Middle East and Africa TMS Industry Revenue (Million), by Size of Enterprise 2024 & 2032
- Figure 51: Middle East and Africa TMS Industry Revenue Share (%), by Size of Enterprise 2024 & 2032
- Figure 52: Middle East and Africa TMS Industry Revenue (Million), by Country 2024 & 2032
- Figure 53: Middle East and Africa TMS Industry Revenue Share (%), by Country 2024 & 2032
List of Tables
- Table 1: Global TMS Industry Revenue Million Forecast, by Region 2019 & 2032
- Table 2: Global TMS Industry Revenue Million Forecast, by Mode of Transportation 2019 & 2032
- Table 3: Global TMS Industry Revenue Million Forecast, by Deployment 2019 & 2032
- Table 4: Global TMS Industry Revenue Million Forecast, by Size of Enterprise 2019 & 2032
- Table 5: Global TMS Industry Revenue Million Forecast, by Region 2019 & 2032
- Table 6: Global TMS Industry Revenue Million Forecast, by Country 2019 & 2032
- Table 7: United States TMS Industry Revenue (Million) Forecast, by Application 2019 & 2032
- Table 8: Canada TMS Industry Revenue (Million) Forecast, by Application 2019 & 2032
- Table 9: Mexico TMS Industry Revenue (Million) Forecast, by Application 2019 & 2032
- Table 10: Global TMS Industry Revenue Million Forecast, by Country 2019 & 2032
- Table 11: Germany TMS Industry Revenue (Million) Forecast, by Application 2019 & 2032
- Table 12: United Kingdom TMS Industry Revenue (Million) Forecast, by Application 2019 & 2032
- Table 13: France TMS Industry Revenue (Million) Forecast, by Application 2019 & 2032
- Table 14: Spain TMS Industry Revenue (Million) Forecast, by Application 2019 & 2032
- Table 15: Italy TMS Industry Revenue (Million) Forecast, by Application 2019 & 2032
- Table 16: Spain TMS Industry Revenue (Million) Forecast, by Application 2019 & 2032
- Table 17: Belgium TMS Industry Revenue (Million) Forecast, by Application 2019 & 2032
- Table 18: Netherland TMS Industry Revenue (Million) Forecast, by Application 2019 & 2032
- Table 19: Nordics TMS Industry Revenue (Million) Forecast, by Application 2019 & 2032
- Table 20: Rest of Europe TMS Industry Revenue (Million) Forecast, by Application 2019 & 2032
- Table 21: Global TMS Industry Revenue Million Forecast, by Country 2019 & 2032
- Table 22: China TMS Industry Revenue (Million) Forecast, by Application 2019 & 2032
- Table 23: Japan TMS Industry Revenue (Million) Forecast, by Application 2019 & 2032
- Table 24: India TMS Industry Revenue (Million) Forecast, by Application 2019 & 2032
- Table 25: South Korea TMS Industry Revenue (Million) Forecast, by Application 2019 & 2032
- Table 26: Southeast Asia TMS Industry Revenue (Million) Forecast, by Application 2019 & 2032
- Table 27: Australia TMS Industry Revenue (Million) Forecast, by Application 2019 & 2032
- Table 28: Indonesia TMS Industry Revenue (Million) Forecast, by Application 2019 & 2032
- Table 29: Phillipes TMS Industry Revenue (Million) Forecast, by Application 2019 & 2032
- Table 30: Singapore TMS Industry Revenue (Million) Forecast, by Application 2019 & 2032
- Table 31: Thailandc TMS Industry Revenue (Million) Forecast, by Application 2019 & 2032
- Table 32: Rest of Asia Pacific TMS Industry Revenue (Million) Forecast, by Application 2019 & 2032
- Table 33: Global TMS Industry Revenue Million Forecast, by Country 2019 & 2032
- Table 34: Brazil TMS Industry Revenue (Million) Forecast, by Application 2019 & 2032
- Table 35: Argentina TMS Industry Revenue (Million) Forecast, by Application 2019 & 2032
- Table 36: Peru TMS Industry Revenue (Million) Forecast, by Application 2019 & 2032
- Table 37: Chile TMS Industry Revenue (Million) Forecast, by Application 2019 & 2032
- Table 38: Colombia TMS Industry Revenue (Million) Forecast, by Application 2019 & 2032
- Table 39: Ecuador TMS Industry Revenue (Million) Forecast, by Application 2019 & 2032
- Table 40: Venezuela TMS Industry Revenue (Million) Forecast, by Application 2019 & 2032
- Table 41: Rest of South America TMS Industry Revenue (Million) Forecast, by Application 2019 & 2032
- Table 42: Global TMS Industry Revenue Million Forecast, by Country 2019 & 2032
- Table 43: United States TMS Industry Revenue (Million) Forecast, by Application 2019 & 2032
- Table 44: Canada TMS Industry Revenue (Million) Forecast, by Application 2019 & 2032
- Table 45: Mexico TMS Industry Revenue (Million) Forecast, by Application 2019 & 2032
- Table 46: Global TMS Industry Revenue Million Forecast, by Country 2019 & 2032
- Table 47: United Arab Emirates TMS Industry Revenue (Million) Forecast, by Application 2019 & 2032
- Table 48: Saudi Arabia TMS Industry Revenue (Million) Forecast, by Application 2019 & 2032
- Table 49: South Africa TMS Industry Revenue (Million) Forecast, by Application 2019 & 2032
- Table 50: Rest of Middle East and Africa TMS Industry Revenue (Million) Forecast, by Application 2019 & 2032
- Table 51: Global TMS Industry Revenue Million Forecast, by Mode of Transportation 2019 & 2032
- Table 52: Global TMS Industry Revenue Million Forecast, by Deployment 2019 & 2032
- Table 53: Global TMS Industry Revenue Million Forecast, by Size of Enterprise 2019 & 2032
- Table 54: Global TMS Industry Revenue Million Forecast, by Country 2019 & 2032
- Table 55: Global TMS Industry Revenue Million Forecast, by Mode of Transportation 2019 & 2032
- Table 56: Global TMS Industry Revenue Million Forecast, by Deployment 2019 & 2032
- Table 57: Global TMS Industry Revenue Million Forecast, by Size of Enterprise 2019 & 2032
- Table 58: Global TMS Industry Revenue Million Forecast, by Country 2019 & 2032
- Table 59: Global TMS Industry Revenue Million Forecast, by Mode of Transportation 2019 & 2032
- Table 60: Global TMS Industry Revenue Million Forecast, by Deployment 2019 & 2032
- Table 61: Global TMS Industry Revenue Million Forecast, by Size of Enterprise 2019 & 2032
- Table 62: Global TMS Industry Revenue Million Forecast, by Country 2019 & 2032
- Table 63: Global TMS Industry Revenue Million Forecast, by Mode of Transportation 2019 & 2032
- Table 64: Global TMS Industry Revenue Million Forecast, by Deployment 2019 & 2032
- Table 65: Global TMS Industry Revenue Million Forecast, by Size of Enterprise 2019 & 2032
- Table 66: Global TMS Industry Revenue Million Forecast, by Country 2019 & 2032
- Table 67: Global TMS Industry Revenue Million Forecast, by Mode of Transportation 2019 & 2032
- Table 68: Global TMS Industry Revenue Million Forecast, by Deployment 2019 & 2032
- Table 69: Global TMS Industry Revenue Million Forecast, by Size of Enterprise 2019 & 2032
- Table 70: Global TMS Industry Revenue Million Forecast, by Country 2019 & 2032
Frequently Asked Questions
1. What is the projected Compound Annual Growth Rate (CAGR) of the TMS Industry?
The projected CAGR is approximately 8.92%.
2. Which companies are prominent players in the TMS Industry?
Key companies in the market include Manhattan Associates Inc, MercuryGate International Inc (Summit Partners)*List Not Exhaustive, JDA Software Group Inc, CargoSmart Ltd, Descartes Systems Group Inc, Oracle Corporation, Precision Software Inc (QAD Inc), 3Gtms Inc (Sumeru Equity Partners), SAP SE.
3. What are the main segments of the TMS Industry?
The market segments include Mode of Transportation, Deployment, Size of Enterprise.
4. Can you provide details about the market size?
The market size is estimated to be USD 2.08 Million as of 2022.
5. What are some drivers contributing to market growth?
Integration of RFID Technologies for Managing Supply Chain Activities; Increasing Use of Cloud Computing Technologies in Supply Chain Management.
6. What are the notable trends driving market growth?
Increasing Use of Cloud and Artificial Intelligence in Supply Chain Management.
7. Are there any restraints impacting market growth?
Lack of Awareness Regarding Transport Management System among Consumers.
8. Can you provide examples of recent developments in the market?
March 2022: The data cloud firm Snowflake and the provider of digital supply chain and omnichannel commerce fulfillment Blue Yonder announced a partnership to transform supply chain management's access to heterogeneous data sources. Retailers, manufacturers, and third-party logistics providers (3PLs) can all benefit from Blue Yonder's Luminate Platform, powered by Snowflake, an end-to-end supply chain solution that helps them better predict, prevent, and address disruptions across their entire business to reduce risks and address the expanding supply chain challenges.
9. What pricing options are available for accessing the report?
Pricing options include single-user, multi-user, and enterprise licenses priced at USD 4750, USD 5250, and USD 8750 respectively.
10. Is the market size provided in terms of value or volume?
The market size is provided in terms of value, measured in Million.
11. Are there any specific market keywords associated with the report?
Yes, the market keyword associated with the report is "TMS Industry," which aids in identifying and referencing the specific market segment covered.
12. How do I determine which pricing option suits my needs best?
The pricing options vary based on user requirements and access needs. Individual users may opt for single-user licenses, while businesses requiring broader access may choose multi-user or enterprise licenses for cost-effective access to the report.
13. Are there any additional resources or data provided in the TMS Industry report?
While the report offers comprehensive insights, it's advisable to review the specific contents or supplementary materials provided to ascertain if additional resources or data are available.
14. How can I stay updated on further developments or reports in the TMS Industry?
To stay informed about further developments, trends, and reports in the TMS Industry, consider subscribing to industry newsletters, following relevant companies and organizations, or regularly checking reputable industry news sources and publications.
Methodology
Step 1 - Identification of Relevant Samples Size from Population Database


Step 2 - Approaches for Defining Global Market Size (Value, Volume* & Price*)

Note*: In applicable scenarios
Step 3 - Data Sources
Primary Research
- Web Analytics
- Survey Reports
- Research Institute
- Latest Research Reports
- Opinion Leaders
Secondary Research
- Annual Reports
- White Paper
- Latest Press Release
- Industry Association
- Paid Database
- Investor Presentations

Step 4 - Data Triangulation
Involves using different sources of information in order to increase the validity of a study
These sources are likely to be stakeholders in a program - participants, other researchers, program staff, other community members, and so on.
Then we put all data in single framework & apply various statistical tools to find out the dynamic on the market.
During the analysis stage, feedback from the stakeholder groups would be compared to determine areas of agreement as well as areas of divergence
