

Key Insights
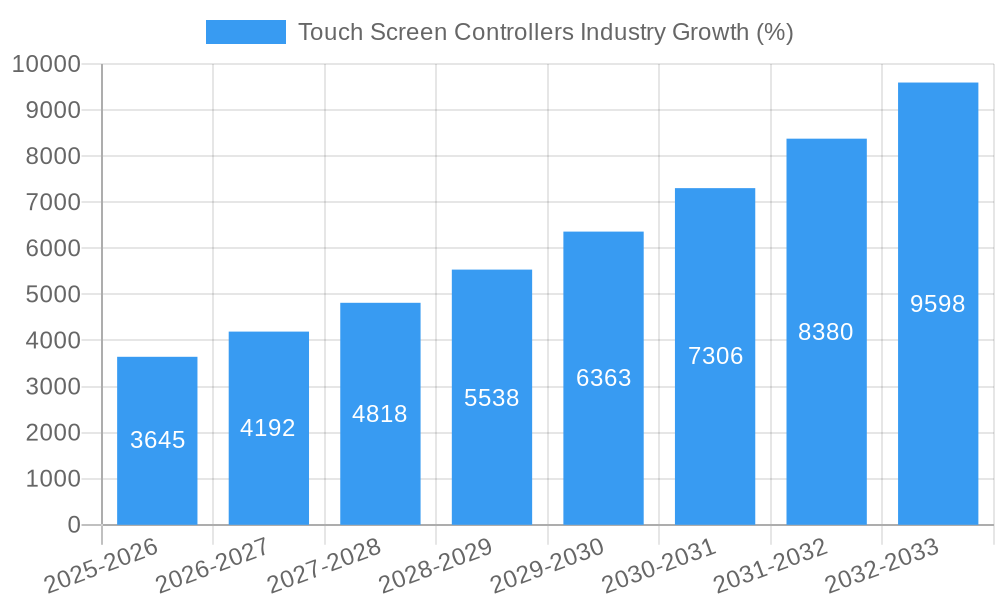
The global touchscreen controller market is experiencing robust growth, projected to reach a substantial size by 2033. The 14.90% CAGR (Compound Annual Growth Rate) from 2019-2033 indicates a significant expansion driven by several key factors. The increasing adoption of touchscreen technology across diverse sectors, including consumer electronics (smartphones, tablets, laptops), automotive (infotainment systems, instrument clusters), healthcare (medical devices, diagnostic equipment), and industrial automation (HMI panels, control systems), fuels this market expansion. Technological advancements in touch sensing technologies like capacitive and resistive controllers, along with miniaturization and improved power efficiency, are further contributing to market growth. The rising demand for sophisticated user interfaces and interactive displays across various applications presents lucrative opportunities for market players. While the market faces challenges such as component shortages and supply chain disruptions, the long-term outlook remains positive due to the ubiquitous integration of touchscreen technology into modern devices and systems. The segmentation by type (resistive and capacitive) and end-user (industrial, healthcare, consumer electronics, retail, automotive, BFSI, and others) highlights the diverse applications driving the demand for these controllers. The geographic distribution shows strong growth across North America, Europe, and Asia Pacific, with emerging economies in Asia Pacific expected to showcase significant growth potential in the coming years. The competitive landscape is characterized by established players like Renesas, Semtech, Synaptics, and others, constantly innovating to cater to the evolving demands of the industry.
The market's success is strongly correlated with technological innovations and the continuous miniaturization of devices. Capacitive touchscreen controllers currently dominate the market due to their superior performance, durability, and responsiveness. However, advancements in resistive technology and the emergence of newer sensing technologies will likely reshape the competitive dynamics within the market segments. Regional variations in growth will be influenced by factors such as technological adoption rates, economic development, and government initiatives promoting digitalization. The automotive sector is poised for significant growth, given the increasing integration of touchscreen interfaces in vehicles, adding a significant driver to the overall market expansion. Strategic partnerships, mergers, and acquisitions are expected to play a significant role in shaping the market's future landscape as companies aim to consolidate their market share and expand their product portfolios. Analyzing these factors in tandem provides a holistic view of the market's progression and potential.
This comprehensive report provides an in-depth analysis of the global touch screen controllers market, encompassing market dynamics, growth trends, regional insights, product landscape, key players, and future outlook. The study period covers 2019-2033, with a base year of 2025 and a forecast period of 2025-2033. The report utilizes data from the historical period (2019-2024) to project future market trends and offers valuable insights for industry professionals, investors, and stakeholders. Market values are presented in million units.

Touch Screen Controllers Industry Market Dynamics & Structure
The touch screen controllers market is characterized by a moderately concentrated landscape, with several key players holding significant market share. Technological innovation, particularly in areas like capacitive sensing and improved power efficiency, is a primary driver. Regulatory frameworks related to safety and performance standards in various end-use sectors (like automotive) also influence market dynamics. The market faces competition from alternative input methods like voice recognition and gesture control, although the prevalence of touchscreens remains strong. End-user demographics play a significant role; the expansion of the consumer electronics and automotive sectors fuels market growth. M&A activity in the touch screen controller industry has been moderate in recent years, with xx deals recorded between 2019 and 2024 representing a xx% increase compared to the previous period. This suggests consolidation among players seeking to expand capabilities and market reach.
- Market Concentration: Moderately concentrated, with top 5 players holding xx% market share in 2024.
- Technological Innovation: Continuous advancements in capacitive sensing technologies, power efficiency, and miniaturization are key growth drivers.
- Regulatory Frameworks: Safety and performance standards vary across regions and end-use applications, impacting product development and market access.
- Competitive Substitutes: Voice recognition, gesture control, and other input technologies present competitive challenges.
- End-User Demographics: Growth in consumer electronics, automotive, and industrial automation sectors strongly influences demand.
- M&A Trends: Moderate M&A activity with xx deals between 2019 and 2024, indicating ongoing consolidation.
Touch Screen Controllers Industry Growth Trends & Insights
The global touch screen controllers market experienced substantial growth during the historical period (2019-2024), expanding from xx million units in 2019 to xx million units in 2024. This translates to a CAGR of xx%. The market's growth is driven by increasing adoption across diverse end-use sectors, particularly in consumer electronics, automotive, and industrial automation. Technological advancements, such as the introduction of advanced capacitive touch sensing and more power-efficient controllers, further stimulate market expansion. Shifts in consumer behavior, favoring touchscreen-based devices, have significantly contributed to market growth. The forecast period (2025-2033) projects continued growth, reaching xx million units by 2033, driven by the rising demand for touch-enabled devices in emerging markets and the ongoing integration of touchscreens in various applications. Market penetration will likely increase from xx% in 2024 to xx% by 2033. Technological disruptions, such as the development of flexible and transparent touchscreens, present further growth opportunities.
Dominant Regions, Countries, or Segments in Touch Screen Controllers Industry
Asia-Pacific is the leading region for touch screen controllers, followed by North America and Europe. Within Asia-Pacific, China and South Korea are major markets due to their strong manufacturing bases for consumer electronics and automotive components. The capacitive type segment dominates the market in terms of units and value, driven by its superior performance, accuracy, and multi-touch capabilities compared to resistive technologies. In terms of end-users, the consumer electronics segment accounts for the largest share, followed by automotive and industrial applications. The growth of the automotive sector, particularly in electric vehicles and advanced driver-assistance systems (ADAS), fuels significant demand for touch screen controllers. The healthcare sector shows promising growth potential due to the increasing adoption of touch-based medical devices.
- Asia-Pacific: Dominant region driven by robust manufacturing of consumer electronics and automobiles.
- Capacitive Type: Leading segment due to superior performance and multi-touch capabilities.
- Consumer Electronics: Largest end-user segment, driven by the proliferation of smartphones, tablets, and other smart devices.
- Automotive: High-growth segment due to the increasing adoption of infotainment systems and ADAS technologies.
- Healthcare: Emerging segment with increasing adoption of touch-based medical devices.
Touch Screen Controllers Industry Product Landscape
The touch screen controllers market offers a range of products, including resistive and capacitive controllers, varying in size, resolution, and features. Capacitive controllers are becoming increasingly prevalent, offering higher accuracy, multi-touch support, and improved durability. Innovative features, such as gesture recognition and haptic feedback, are enhancing user experience. Performance metrics include response time, accuracy, power consumption, and durability, all crucial factors influencing product selection and market competition.
Key Drivers, Barriers & Challenges in Touch Screen Controllers Industry
Key Drivers: The increasing adoption of touchscreens in consumer electronics, automotive, and industrial applications is a major driver. Technological advancements like improved accuracy and power efficiency are also significant. Government initiatives promoting digitalization in various sectors further boost market growth.
Key Challenges: Intense competition among established players and emerging entrants poses challenges. Supply chain disruptions and fluctuating raw material prices impact manufacturing costs. Stringent regulatory requirements in certain industries can also create hurdles for market entry. High initial investment costs for advanced technology adoption can also act as a barrier.
Emerging Opportunities in Touch Screen Controllers Industry
The increasing demand for touchscreens in emerging markets presents significant growth opportunities. Innovation in areas like flexible displays and transparent touchscreens opens new applications. The integration of touch controllers with other technologies such as AI and IoT creates additional opportunities for growth. The development of specialized controllers for niche applications like healthcare and industrial automation also presents potential for expansion.
Growth Accelerators in the Touch Screen Controllers Industry Industry
Technological breakthroughs in touch sensing technology and miniaturization are key growth accelerators. Strategic partnerships and collaborations between touch controller manufacturers and end-product developers are crucial. Expansion into emerging markets and diversification into new applications, such as foldable devices and augmented reality, offer strong growth potential.
Key Players Shaping the Touch Screen Controllers Industry Market
- Renesas Electronic Corporation
- Semtech Corporation
- Synaptics Incorporated
- MELFAS Co Ltd
- Microchip Technology Inc
- SAMSUNG Electronics Co Ltd
- STMicroelectronics
- NXP Semiconductors
- Texas Instruments Incorporated
- Analog Devices Inc
Notable Milestones in Touch Screen Controllers Industry Sector
- June 2022: Review Display Systems (RDS) announced the availability of a new generation of projected capacitive (PCAP) touchscreens from AMT, expanding the range of integrated touch solutions.
- June 2022: Microchip Technology Inc. launched the maXTouch Knob-on-Display (KoD) family, the first automotive-grade touchscreen controller supporting capacitive rotary encoders and mechanical switches.
In-Depth Touch Screen Controllers Industry Market Outlook
The touch screen controllers market is poised for continued growth, driven by ongoing technological advancements, expanding applications across various sectors, and increasing demand from emerging markets. Strategic partnerships, investments in R&D, and expansion into niche applications will be key factors shaping the market landscape. The focus on developing more power-efficient, accurate, and durable touch controllers will further drive market expansion. Opportunities exist for companies to leverage innovative technologies and strategic partnerships to capture significant market share and drive long-term growth in this dynamic industry.
Touch Screen Controllers Industry Segmentation
-
1. Type
- 1.1. Resistive
- 1.2. Capacitive
-
2. End-user
- 2.1. Industrial
- 2.2. Healthcare
- 2.3. Consumer Electronics
- 2.4. Retail
- 2.5. Automotive
- 2.6. BFSI
- 2.7. Other End-users
Touch Screen Controllers Industry Segmentation By Geography
-
1. North America
- 1.1. United States
- 1.2. Canada
-
2. Europe
- 2.1. United Kingdom
- 2.2. Germany
- 2.3. France
- 2.4. Spain
- 2.5. Rest of Europe
-
3. Asia Pacific
- 3.1. China
- 3.2. India
- 3.3. Japan
- 3.4. South Korea
- 3.5. Australia
- 3.6. Rest of Asia Pacific
-
4. Latin America
- 4.1. Brazil
- 4.2. Mexico
- 4.3. Argentina
- 4.4. Rest of Latin America
- 5. Middle East
-
6. United Arab Emirates
- 6.1. Saudi Arabia
- 6.2. South Africa
- 6.3. Rest of Middle East

Touch Screen Controllers Industry REPORT HIGHLIGHTS
| Aspects | Details |
|---|---|
| Study Period | 2019-2033 |
| Base Year | 2024 |
| Estimated Year | 2025 |
| Forecast Period | 2025-2033 |
| Historical Period | 2019-2024 |
| Growth Rate | CAGR of 14.90% from 2019-2033 |
| Segmentation |
|
Table of Contents
- 1. Introduction
- 1.1. Research Scope
- 1.2. Market Segmentation
- 1.3. Research Methodology
- 1.4. Definitions and Assumptions
- 2. Executive Summary
- 2.1. Introduction
- 3. Market Dynamics
- 3.1. Introduction
- 3.2. Market Drivers
- 3.2.1. Increase in the Number of Smart Devices; Increased Usage across Various Industries
- 3.3. Market Restrains
- 3.3.1. Complexities Associated with the Technology
- 3.4. Market Trends
- 3.4.1. Consumer Electronics to Hold a Major Market Share
- 4. Market Factor Analysis
- 4.1. Porters Five Forces
- 4.2. Supply/Value Chain
- 4.3. PESTEL analysis
- 4.4. Market Entropy
- 4.5. Patent/Trademark Analysis
- 5. Global Touch Screen Controllers Industry Analysis, Insights and Forecast, 2019-2031
- 5.1. Market Analysis, Insights and Forecast - by Type
- 5.1.1. Resistive
- 5.1.2. Capacitive
- 5.2. Market Analysis, Insights and Forecast - by End-user
- 5.2.1. Industrial
- 5.2.2. Healthcare
- 5.2.3. Consumer Electronics
- 5.2.4. Retail
- 5.2.5. Automotive
- 5.2.6. BFSI
- 5.2.7. Other End-users
- 5.3. Market Analysis, Insights and Forecast - by Region
- 5.3.1. North America
- 5.3.2. Europe
- 5.3.3. Asia Pacific
- 5.3.4. Latin America
- 5.3.5. Middle East
- 5.3.6. United Arab Emirates
- 5.1. Market Analysis, Insights and Forecast - by Type
- 6. North America Touch Screen Controllers Industry Analysis, Insights and Forecast, 2019-2031
- 6.1. Market Analysis, Insights and Forecast - by Type
- 6.1.1. Resistive
- 6.1.2. Capacitive
- 6.2. Market Analysis, Insights and Forecast - by End-user
- 6.2.1. Industrial
- 6.2.2. Healthcare
- 6.2.3. Consumer Electronics
- 6.2.4. Retail
- 6.2.5. Automotive
- 6.2.6. BFSI
- 6.2.7. Other End-users
- 6.1. Market Analysis, Insights and Forecast - by Type
- 7. Europe Touch Screen Controllers Industry Analysis, Insights and Forecast, 2019-2031
- 7.1. Market Analysis, Insights and Forecast - by Type
- 7.1.1. Resistive
- 7.1.2. Capacitive
- 7.2. Market Analysis, Insights and Forecast - by End-user
- 7.2.1. Industrial
- 7.2.2. Healthcare
- 7.2.3. Consumer Electronics
- 7.2.4. Retail
- 7.2.5. Automotive
- 7.2.6. BFSI
- 7.2.7. Other End-users
- 7.1. Market Analysis, Insights and Forecast - by Type
- 8. Asia Pacific Touch Screen Controllers Industry Analysis, Insights and Forecast, 2019-2031
- 8.1. Market Analysis, Insights and Forecast - by Type
- 8.1.1. Resistive
- 8.1.2. Capacitive
- 8.2. Market Analysis, Insights and Forecast - by End-user
- 8.2.1. Industrial
- 8.2.2. Healthcare
- 8.2.3. Consumer Electronics
- 8.2.4. Retail
- 8.2.5. Automotive
- 8.2.6. BFSI
- 8.2.7. Other End-users
- 8.1. Market Analysis, Insights and Forecast - by Type
- 9. Latin America Touch Screen Controllers Industry Analysis, Insights and Forecast, 2019-2031
- 9.1. Market Analysis, Insights and Forecast - by Type
- 9.1.1. Resistive
- 9.1.2. Capacitive
- 9.2. Market Analysis, Insights and Forecast - by End-user
- 9.2.1. Industrial
- 9.2.2. Healthcare
- 9.2.3. Consumer Electronics
- 9.2.4. Retail
- 9.2.5. Automotive
- 9.2.6. BFSI
- 9.2.7. Other End-users
- 9.1. Market Analysis, Insights and Forecast - by Type
- 10. Middle East Touch Screen Controllers Industry Analysis, Insights and Forecast, 2019-2031
- 10.1. Market Analysis, Insights and Forecast - by Type
- 10.1.1. Resistive
- 10.1.2. Capacitive
- 10.2. Market Analysis, Insights and Forecast - by End-user
- 10.2.1. Industrial
- 10.2.2. Healthcare
- 10.2.3. Consumer Electronics
- 10.2.4. Retail
- 10.2.5. Automotive
- 10.2.6. BFSI
- 10.2.7. Other End-users
- 10.1. Market Analysis, Insights and Forecast - by Type
- 11. United Arab Emirates Touch Screen Controllers Industry Analysis, Insights and Forecast, 2019-2031
- 11.1. Market Analysis, Insights and Forecast - by Type
- 11.1.1. Resistive
- 11.1.2. Capacitive
- 11.2. Market Analysis, Insights and Forecast - by End-user
- 11.2.1. Industrial
- 11.2.2. Healthcare
- 11.2.3. Consumer Electronics
- 11.2.4. Retail
- 11.2.5. Automotive
- 11.2.6. BFSI
- 11.2.7. Other End-users
- 11.1. Market Analysis, Insights and Forecast - by Type
- 12. North America Touch Screen Controllers Industry Analysis, Insights and Forecast, 2019-2031
- 12.1. Market Analysis, Insights and Forecast - By Country/Sub-region
- 12.1.1 United States
- 12.1.2 Canada
- 13. Europe Touch Screen Controllers Industry Analysis, Insights and Forecast, 2019-2031
- 13.1. Market Analysis, Insights and Forecast - By Country/Sub-region
- 13.1.1 United Kingdom
- 13.1.2 Germany
- 13.1.3 France
- 13.1.4 Spain
- 13.1.5 Rest of Europe
- 14. Asia Pacific Touch Screen Controllers Industry Analysis, Insights and Forecast, 2019-2031
- 14.1. Market Analysis, Insights and Forecast - By Country/Sub-region
- 14.1.1 China
- 14.1.2 India
- 14.1.3 Japan
- 14.1.4 South Korea
- 14.1.5 Australia
- 14.1.6 Rest of Asia Pacific
- 15. Latin America Touch Screen Controllers Industry Analysis, Insights and Forecast, 2019-2031
- 15.1. Market Analysis, Insights and Forecast - By Country/Sub-region
- 15.1.1 Brazil
- 15.1.2 Mexico
- 15.1.3 Argentina
- 15.1.4 Rest of Latin America
- 16. Middle East Touch Screen Controllers Industry Analysis, Insights and Forecast, 2019-2031
- 16.1. Market Analysis, Insights and Forecast - By Country/Sub-region
- 16.1.1.
- 17. United Arab Emirates Touch Screen Controllers Industry Analysis, Insights and Forecast, 2019-2031
- 17.1. Market Analysis, Insights and Forecast - By Country/Sub-region
- 17.1.1 Saudi Arabia
- 17.1.2 South Africa
- 17.1.3 Rest of Middle East
- 18. Competitive Analysis
- 18.1. Global Market Share Analysis 2024
- 18.2. Company Profiles
- 18.2.1 Renesas Electronic Corporation
- 18.2.1.1. Overview
- 18.2.1.2. Products
- 18.2.1.3. SWOT Analysis
- 18.2.1.4. Recent Developments
- 18.2.1.5. Financials (Based on Availability)
- 18.2.2 Semtech Corporation
- 18.2.2.1. Overview
- 18.2.2.2. Products
- 18.2.2.3. SWOT Analysis
- 18.2.2.4. Recent Developments
- 18.2.2.5. Financials (Based on Availability)
- 18.2.3 Synaptics Incorporated
- 18.2.3.1. Overview
- 18.2.3.2. Products
- 18.2.3.3. SWOT Analysis
- 18.2.3.4. Recent Developments
- 18.2.3.5. Financials (Based on Availability)
- 18.2.4 MELFAS Co Ltd
- 18.2.4.1. Overview
- 18.2.4.2. Products
- 18.2.4.3. SWOT Analysis
- 18.2.4.4. Recent Developments
- 18.2.4.5. Financials (Based on Availability)
- 18.2.5 Microchip Technology Inc *List Not Exhaustive
- 18.2.5.1. Overview
- 18.2.5.2. Products
- 18.2.5.3. SWOT Analysis
- 18.2.5.4. Recent Developments
- 18.2.5.5. Financials (Based on Availability)
- 18.2.6 SAMSUNG Electronics Co Ltd
- 18.2.6.1. Overview
- 18.2.6.2. Products
- 18.2.6.3. SWOT Analysis
- 18.2.6.4. Recent Developments
- 18.2.6.5. Financials (Based on Availability)
- 18.2.7 STMicroelectronics
- 18.2.7.1. Overview
- 18.2.7.2. Products
- 18.2.7.3. SWOT Analysis
- 18.2.7.4. Recent Developments
- 18.2.7.5. Financials (Based on Availability)
- 18.2.8 NXP Semiconductors
- 18.2.8.1. Overview
- 18.2.8.2. Products
- 18.2.8.3. SWOT Analysis
- 18.2.8.4. Recent Developments
- 18.2.8.5. Financials (Based on Availability)
- 18.2.9 Texas Instruments Incorporated
- 18.2.9.1. Overview
- 18.2.9.2. Products
- 18.2.9.3. SWOT Analysis
- 18.2.9.4. Recent Developments
- 18.2.9.5. Financials (Based on Availability)
- 18.2.10 Analog Devices Inc
- 18.2.10.1. Overview
- 18.2.10.2. Products
- 18.2.10.3. SWOT Analysis
- 18.2.10.4. Recent Developments
- 18.2.10.5. Financials (Based on Availability)
- 18.2.1 Renesas Electronic Corporation
List of Figures
- Figure 1: Global Touch Screen Controllers Industry Revenue Breakdown (Million, %) by Region 2024 & 2032
- Figure 2: North America Touch Screen Controllers Industry Revenue (Million), by Country 2024 & 2032
- Figure 3: North America Touch Screen Controllers Industry Revenue Share (%), by Country 2024 & 2032
- Figure 4: Europe Touch Screen Controllers Industry Revenue (Million), by Country 2024 & 2032
- Figure 5: Europe Touch Screen Controllers Industry Revenue Share (%), by Country 2024 & 2032
- Figure 6: Asia Pacific Touch Screen Controllers Industry Revenue (Million), by Country 2024 & 2032
- Figure 7: Asia Pacific Touch Screen Controllers Industry Revenue Share (%), by Country 2024 & 2032
- Figure 8: Latin America Touch Screen Controllers Industry Revenue (Million), by Country 2024 & 2032
- Figure 9: Latin America Touch Screen Controllers Industry Revenue Share (%), by Country 2024 & 2032
- Figure 10: Middle East Touch Screen Controllers Industry Revenue (Million), by Country 2024 & 2032
- Figure 11: Middle East Touch Screen Controllers Industry Revenue Share (%), by Country 2024 & 2032
- Figure 12: United Arab Emirates Touch Screen Controllers Industry Revenue (Million), by Country 2024 & 2032
- Figure 13: United Arab Emirates Touch Screen Controllers Industry Revenue Share (%), by Country 2024 & 2032
- Figure 14: North America Touch Screen Controllers Industry Revenue (Million), by Type 2024 & 2032
- Figure 15: North America Touch Screen Controllers Industry Revenue Share (%), by Type 2024 & 2032
- Figure 16: North America Touch Screen Controllers Industry Revenue (Million), by End-user 2024 & 2032
- Figure 17: North America Touch Screen Controllers Industry Revenue Share (%), by End-user 2024 & 2032
- Figure 18: North America Touch Screen Controllers Industry Revenue (Million), by Country 2024 & 2032
- Figure 19: North America Touch Screen Controllers Industry Revenue Share (%), by Country 2024 & 2032
- Figure 20: Europe Touch Screen Controllers Industry Revenue (Million), by Type 2024 & 2032
- Figure 21: Europe Touch Screen Controllers Industry Revenue Share (%), by Type 2024 & 2032
- Figure 22: Europe Touch Screen Controllers Industry Revenue (Million), by End-user 2024 & 2032
- Figure 23: Europe Touch Screen Controllers Industry Revenue Share (%), by End-user 2024 & 2032
- Figure 24: Europe Touch Screen Controllers Industry Revenue (Million), by Country 2024 & 2032
- Figure 25: Europe Touch Screen Controllers Industry Revenue Share (%), by Country 2024 & 2032
- Figure 26: Asia Pacific Touch Screen Controllers Industry Revenue (Million), by Type 2024 & 2032
- Figure 27: Asia Pacific Touch Screen Controllers Industry Revenue Share (%), by Type 2024 & 2032
- Figure 28: Asia Pacific Touch Screen Controllers Industry Revenue (Million), by End-user 2024 & 2032
- Figure 29: Asia Pacific Touch Screen Controllers Industry Revenue Share (%), by End-user 2024 & 2032
- Figure 30: Asia Pacific Touch Screen Controllers Industry Revenue (Million), by Country 2024 & 2032
- Figure 31: Asia Pacific Touch Screen Controllers Industry Revenue Share (%), by Country 2024 & 2032
- Figure 32: Latin America Touch Screen Controllers Industry Revenue (Million), by Type 2024 & 2032
- Figure 33: Latin America Touch Screen Controllers Industry Revenue Share (%), by Type 2024 & 2032
- Figure 34: Latin America Touch Screen Controllers Industry Revenue (Million), by End-user 2024 & 2032
- Figure 35: Latin America Touch Screen Controllers Industry Revenue Share (%), by End-user 2024 & 2032
- Figure 36: Latin America Touch Screen Controllers Industry Revenue (Million), by Country 2024 & 2032
- Figure 37: Latin America Touch Screen Controllers Industry Revenue Share (%), by Country 2024 & 2032
- Figure 38: Middle East Touch Screen Controllers Industry Revenue (Million), by Type 2024 & 2032
- Figure 39: Middle East Touch Screen Controllers Industry Revenue Share (%), by Type 2024 & 2032
- Figure 40: Middle East Touch Screen Controllers Industry Revenue (Million), by End-user 2024 & 2032
- Figure 41: Middle East Touch Screen Controllers Industry Revenue Share (%), by End-user 2024 & 2032
- Figure 42: Middle East Touch Screen Controllers Industry Revenue (Million), by Country 2024 & 2032
- Figure 43: Middle East Touch Screen Controllers Industry Revenue Share (%), by Country 2024 & 2032
- Figure 44: United Arab Emirates Touch Screen Controllers Industry Revenue (Million), by Type 2024 & 2032
- Figure 45: United Arab Emirates Touch Screen Controllers Industry Revenue Share (%), by Type 2024 & 2032
- Figure 46: United Arab Emirates Touch Screen Controllers Industry Revenue (Million), by End-user 2024 & 2032
- Figure 47: United Arab Emirates Touch Screen Controllers Industry Revenue Share (%), by End-user 2024 & 2032
- Figure 48: United Arab Emirates Touch Screen Controllers Industry Revenue (Million), by Country 2024 & 2032
- Figure 49: United Arab Emirates Touch Screen Controllers Industry Revenue Share (%), by Country 2024 & 2032
List of Tables
- Table 1: Global Touch Screen Controllers Industry Revenue Million Forecast, by Region 2019 & 2032
- Table 2: Global Touch Screen Controllers Industry Revenue Million Forecast, by Type 2019 & 2032
- Table 3: Global Touch Screen Controllers Industry Revenue Million Forecast, by End-user 2019 & 2032
- Table 4: Global Touch Screen Controllers Industry Revenue Million Forecast, by Region 2019 & 2032
- Table 5: Global Touch Screen Controllers Industry Revenue Million Forecast, by Country 2019 & 2032
- Table 6: United States Touch Screen Controllers Industry Revenue (Million) Forecast, by Application 2019 & 2032
- Table 7: Canada Touch Screen Controllers Industry Revenue (Million) Forecast, by Application 2019 & 2032
- Table 8: Global Touch Screen Controllers Industry Revenue Million Forecast, by Country 2019 & 2032
- Table 9: United Kingdom Touch Screen Controllers Industry Revenue (Million) Forecast, by Application 2019 & 2032
- Table 10: Germany Touch Screen Controllers Industry Revenue (Million) Forecast, by Application 2019 & 2032
- Table 11: France Touch Screen Controllers Industry Revenue (Million) Forecast, by Application 2019 & 2032
- Table 12: Spain Touch Screen Controllers Industry Revenue (Million) Forecast, by Application 2019 & 2032
- Table 13: Rest of Europe Touch Screen Controllers Industry Revenue (Million) Forecast, by Application 2019 & 2032
- Table 14: Global Touch Screen Controllers Industry Revenue Million Forecast, by Country 2019 & 2032
- Table 15: China Touch Screen Controllers Industry Revenue (Million) Forecast, by Application 2019 & 2032
- Table 16: India Touch Screen Controllers Industry Revenue (Million) Forecast, by Application 2019 & 2032
- Table 17: Japan Touch Screen Controllers Industry Revenue (Million) Forecast, by Application 2019 & 2032
- Table 18: South Korea Touch Screen Controllers Industry Revenue (Million) Forecast, by Application 2019 & 2032
- Table 19: Australia Touch Screen Controllers Industry Revenue (Million) Forecast, by Application 2019 & 2032
- Table 20: Rest of Asia Pacific Touch Screen Controllers Industry Revenue (Million) Forecast, by Application 2019 & 2032
- Table 21: Global Touch Screen Controllers Industry Revenue Million Forecast, by Country 2019 & 2032
- Table 22: Brazil Touch Screen Controllers Industry Revenue (Million) Forecast, by Application 2019 & 2032
- Table 23: Mexico Touch Screen Controllers Industry Revenue (Million) Forecast, by Application 2019 & 2032
- Table 24: Argentina Touch Screen Controllers Industry Revenue (Million) Forecast, by Application 2019 & 2032
- Table 25: Rest of Latin America Touch Screen Controllers Industry Revenue (Million) Forecast, by Application 2019 & 2032
- Table 26: Global Touch Screen Controllers Industry Revenue Million Forecast, by Country 2019 & 2032
- Table 27: Touch Screen Controllers Industry Revenue (Million) Forecast, by Application 2019 & 2032
- Table 28: Global Touch Screen Controllers Industry Revenue Million Forecast, by Country 2019 & 2032
- Table 29: Saudi Arabia Touch Screen Controllers Industry Revenue (Million) Forecast, by Application 2019 & 2032
- Table 30: South Africa Touch Screen Controllers Industry Revenue (Million) Forecast, by Application 2019 & 2032
- Table 31: Rest of Middle East Touch Screen Controllers Industry Revenue (Million) Forecast, by Application 2019 & 2032
- Table 32: Global Touch Screen Controllers Industry Revenue Million Forecast, by Type 2019 & 2032
- Table 33: Global Touch Screen Controllers Industry Revenue Million Forecast, by End-user 2019 & 2032
- Table 34: Global Touch Screen Controllers Industry Revenue Million Forecast, by Country 2019 & 2032
- Table 35: United States Touch Screen Controllers Industry Revenue (Million) Forecast, by Application 2019 & 2032
- Table 36: Canada Touch Screen Controllers Industry Revenue (Million) Forecast, by Application 2019 & 2032
- Table 37: Global Touch Screen Controllers Industry Revenue Million Forecast, by Type 2019 & 2032
- Table 38: Global Touch Screen Controllers Industry Revenue Million Forecast, by End-user 2019 & 2032
- Table 39: Global Touch Screen Controllers Industry Revenue Million Forecast, by Country 2019 & 2032
- Table 40: United Kingdom Touch Screen Controllers Industry Revenue (Million) Forecast, by Application 2019 & 2032
- Table 41: Germany Touch Screen Controllers Industry Revenue (Million) Forecast, by Application 2019 & 2032
- Table 42: France Touch Screen Controllers Industry Revenue (Million) Forecast, by Application 2019 & 2032
- Table 43: Spain Touch Screen Controllers Industry Revenue (Million) Forecast, by Application 2019 & 2032
- Table 44: Rest of Europe Touch Screen Controllers Industry Revenue (Million) Forecast, by Application 2019 & 2032
- Table 45: Global Touch Screen Controllers Industry Revenue Million Forecast, by Type 2019 & 2032
- Table 46: Global Touch Screen Controllers Industry Revenue Million Forecast, by End-user 2019 & 2032
- Table 47: Global Touch Screen Controllers Industry Revenue Million Forecast, by Country 2019 & 2032
- Table 48: China Touch Screen Controllers Industry Revenue (Million) Forecast, by Application 2019 & 2032
- Table 49: India Touch Screen Controllers Industry Revenue (Million) Forecast, by Application 2019 & 2032
- Table 50: Japan Touch Screen Controllers Industry Revenue (Million) Forecast, by Application 2019 & 2032
- Table 51: South Korea Touch Screen Controllers Industry Revenue (Million) Forecast, by Application 2019 & 2032
- Table 52: Australia Touch Screen Controllers Industry Revenue (Million) Forecast, by Application 2019 & 2032
- Table 53: Rest of Asia Pacific Touch Screen Controllers Industry Revenue (Million) Forecast, by Application 2019 & 2032
- Table 54: Global Touch Screen Controllers Industry Revenue Million Forecast, by Type 2019 & 2032
- Table 55: Global Touch Screen Controllers Industry Revenue Million Forecast, by End-user 2019 & 2032
- Table 56: Global Touch Screen Controllers Industry Revenue Million Forecast, by Country 2019 & 2032
- Table 57: Brazil Touch Screen Controllers Industry Revenue (Million) Forecast, by Application 2019 & 2032
- Table 58: Mexico Touch Screen Controllers Industry Revenue (Million) Forecast, by Application 2019 & 2032
- Table 59: Argentina Touch Screen Controllers Industry Revenue (Million) Forecast, by Application 2019 & 2032
- Table 60: Rest of Latin America Touch Screen Controllers Industry Revenue (Million) Forecast, by Application 2019 & 2032
- Table 61: Global Touch Screen Controllers Industry Revenue Million Forecast, by Type 2019 & 2032
- Table 62: Global Touch Screen Controllers Industry Revenue Million Forecast, by End-user 2019 & 2032
- Table 63: Global Touch Screen Controllers Industry Revenue Million Forecast, by Country 2019 & 2032
- Table 64: Global Touch Screen Controllers Industry Revenue Million Forecast, by Type 2019 & 2032
- Table 65: Global Touch Screen Controllers Industry Revenue Million Forecast, by End-user 2019 & 2032
- Table 66: Global Touch Screen Controllers Industry Revenue Million Forecast, by Country 2019 & 2032
- Table 67: Saudi Arabia Touch Screen Controllers Industry Revenue (Million) Forecast, by Application 2019 & 2032
- Table 68: South Africa Touch Screen Controllers Industry Revenue (Million) Forecast, by Application 2019 & 2032
- Table 69: Rest of Middle East Touch Screen Controllers Industry Revenue (Million) Forecast, by Application 2019 & 2032
Frequently Asked Questions
1. What is the projected Compound Annual Growth Rate (CAGR) of the Touch Screen Controllers Industry?
The projected CAGR is approximately 14.90%.
2. Which companies are prominent players in the Touch Screen Controllers Industry?
Key companies in the market include Renesas Electronic Corporation, Semtech Corporation, Synaptics Incorporated, MELFAS Co Ltd, Microchip Technology Inc *List Not Exhaustive, SAMSUNG Electronics Co Ltd, STMicroelectronics, NXP Semiconductors, Texas Instruments Incorporated, Analog Devices Inc.
3. What are the main segments of the Touch Screen Controllers Industry?
The market segments include Type, End-user.
4. Can you provide details about the market size?
The market size is estimated to be USD XX Million as of 2022.
5. What are some drivers contributing to market growth?
Increase in the Number of Smart Devices; Increased Usage across Various Industries.
6. What are the notable trends driving market growth?
Consumer Electronics to Hold a Major Market Share.
7. Are there any restraints impacting market growth?
Complexities Associated with the Technology.
8. Can you provide examples of recent developments in the market?
June 2022 - Review Display Systems (RDS), display solutions, and embedded systems provider announced the availability of a new generation of projected capacitive (PCAP) touchscreens from AMT. The availability of an extensive range of high-quality PCAP touchscreens, touch controllers, and drivers will enable the company to provide dependable, fully integrated touch solutions.
9. What pricing options are available for accessing the report?
Pricing options include single-user, multi-user, and enterprise licenses priced at USD 4750, USD 5250, and USD 8750 respectively.
10. Is the market size provided in terms of value or volume?
The market size is provided in terms of value, measured in Million.
11. Are there any specific market keywords associated with the report?
Yes, the market keyword associated with the report is "Touch Screen Controllers Industry," which aids in identifying and referencing the specific market segment covered.
12. How do I determine which pricing option suits my needs best?
The pricing options vary based on user requirements and access needs. Individual users may opt for single-user licenses, while businesses requiring broader access may choose multi-user or enterprise licenses for cost-effective access to the report.
13. Are there any additional resources or data provided in the Touch Screen Controllers Industry report?
While the report offers comprehensive insights, it's advisable to review the specific contents or supplementary materials provided to ascertain if additional resources or data are available.
14. How can I stay updated on further developments or reports in the Touch Screen Controllers Industry?
To stay informed about further developments, trends, and reports in the Touch Screen Controllers Industry, consider subscribing to industry newsletters, following relevant companies and organizations, or regularly checking reputable industry news sources and publications.
Methodology
Step 1 - Identification of Relevant Samples Size from Population Database


Step 2 - Approaches for Defining Global Market Size (Value, Volume* & Price*)

Note*: In applicable scenarios
Step 3 - Data Sources
Primary Research
- Web Analytics
- Survey Reports
- Research Institute
- Latest Research Reports
- Opinion Leaders
Secondary Research
- Annual Reports
- White Paper
- Latest Press Release
- Industry Association
- Paid Database
- Investor Presentations

Step 4 - Data Triangulation
Involves using different sources of information in order to increase the validity of a study
These sources are likely to be stakeholders in a program - participants, other researchers, program staff, other community members, and so on.
Then we put all data in single framework & apply various statistical tools to find out the dynamic on the market.
During the analysis stage, feedback from the stakeholder groups would be compared to determine areas of agreement as well as areas of divergence
