

Key Insights
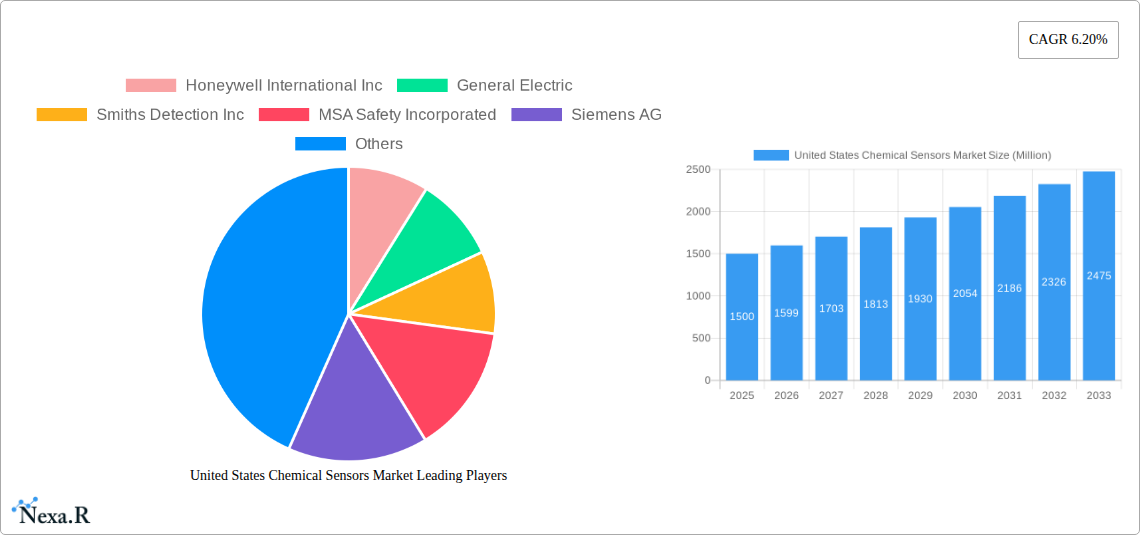
The United States chemical sensors market is experiencing robust growth, driven by increasing demand across diverse sectors. The market's Compound Annual Growth Rate (CAGR) of 6.20% from 2019 to 2024 suggests a substantial expansion, projected to continue through 2033. Key drivers include stringent environmental regulations necessitating precise environmental monitoring, advancements in healthcare diagnostics relying on sophisticated chemical sensing technologies, and the expanding industrial automation sector requiring real-time process monitoring and control. The electrochemical and optical sensor segments dominate the product landscape, fueled by their reliability, sensitivity, and cost-effectiveness in various applications. Industrial and medical applications currently represent the largest market shares, but the defense and homeland security sector is witnessing significant growth due to the increasing need for enhanced security measures. While the market faces challenges from high initial investment costs for advanced sensor technologies and potential supply chain disruptions, the overall growth trajectory remains positive, owing to continuous technological advancements leading to smaller, more efficient, and cost-effective sensors.
The market segmentation reveals a diverse application landscape. While industrial applications, such as process control and emission monitoring, remain prominent, medical diagnostics, employing sensors in blood glucose monitoring and other point-of-care devices, is showing considerable growth. Similarly, environmental monitoring, crucial for air and water quality control, is significantly boosting market demand. The defense and homeland security sector is experiencing a surge in chemical sensor adoption for detecting hazardous materials and ensuring national security. Leading companies like Honeywell International Inc., General Electric, and Smiths Detection are major players, constantly innovating to meet the evolving market needs. Given the projected CAGR, we can reasonably expect a significant expansion of the US market in the coming years, exceeding the overall global market share proportionally due to robust technological advancements and regulatory pressures within the US. Further market segmentation by region within the US (e.g., West Coast, East Coast) would reveal additional insightful data.
United States Chemical Sensors Market: A Comprehensive Market Report (2019-2033)
This comprehensive report provides an in-depth analysis of the United States Chemical Sensors Market, covering market dynamics, growth trends, regional segmentation, product landscape, key players, and future outlook. With a study period spanning 2019-2033, a base year of 2025, and a forecast period of 2025-2033, this report offers invaluable insights for industry professionals, investors, and strategic decision-makers. The report analyzes both parent and child markets, including detailed segmentation by product type (Electrochemical, Optical, Pallister/Catalytic Bead, Other Product Types) and application (Industrial, Medical, Environmental Monitoring, Defense and Homeland Security, Other Applications). The market size is presented in Million units.
United States Chemical Sensors Market Market Dynamics & Structure
The US chemical sensors market is characterized by moderate concentration, with key players holding significant market share. Technological innovation, particularly in miniaturization, improved sensitivity, and wireless connectivity, is a major growth driver. Stringent environmental regulations and increasing demand for safety and security across various sectors fuel market expansion. Competitive substitutes, such as traditional analytical methods, exert some pressure, but the advantages of chemical sensors in terms of real-time monitoring and cost-effectiveness maintain market demand. The end-user demographics are diverse, encompassing industrial manufacturers, healthcare providers, environmental agencies, and defense organizations. M&A activity has been moderate, with strategic acquisitions aimed at expanding product portfolios and technological capabilities.
- Market Concentration: Moderately concentrated, with top 5 players holding approximately xx% market share in 2024.
- Technological Innovation: Focus on miniaturization, improved sensitivity, and wireless connectivity.
- Regulatory Framework: Stringent environmental regulations drive demand, particularly in environmental monitoring applications.
- Competitive Substitutes: Traditional analytical methods present some competition.
- End-User Demographics: Diverse, including industrial, medical, environmental, and defense sectors.
- M&A Trends: Moderate activity, primarily focused on strategic acquisitions for technology expansion. xx M&A deals were recorded between 2019 and 2024.
United States Chemical Sensors Market Growth Trends & Insights
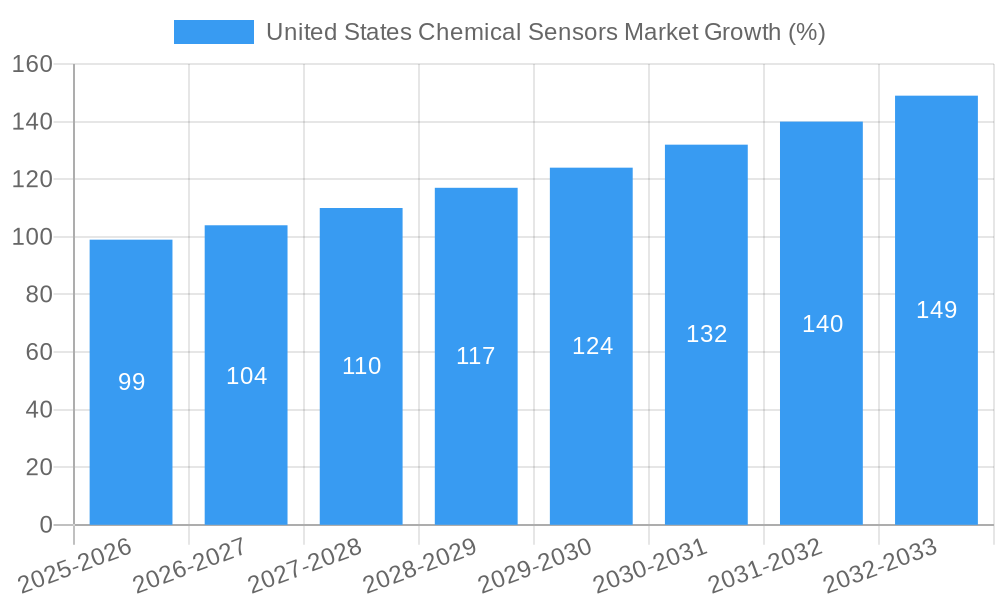
The US chemical sensors market experienced steady growth during the historical period (2019-2024), driven by increasing industrial automation, advancements in healthcare technologies, and rising environmental concerns. The market is projected to maintain a robust CAGR of xx% during the forecast period (2025-2033), reaching a market size of xx Million units by 2033. Technological disruptions, such as the integration of IoT and AI, are enhancing sensor capabilities and expanding applications. Consumer behavior shifts towards greater safety and environmental awareness further propel market growth. Market penetration is highest in the industrial sector, followed by environmental monitoring and medical applications.
Dominant Regions, Countries, or Segments in United States Chemical Sensors Market
The industrial sector currently dominates the US chemical sensors market, accounting for approximately xx% of total market value in 2024. Within product types, electrochemical sensors hold the largest share due to their established technology and cost-effectiveness. California, Texas, and Pennsylvania are leading states due to their robust manufacturing sectors and presence of major chemical companies.
- Key Drivers for Industrial Sector Dominance: High adoption of automation, stringent safety regulations, and demand for process optimization.
- Key Drivers for Electrochemical Sensor Dominance: Established technology, cost-effectiveness, and suitability for various applications.
- Geographic Dominance: California, Texas, and Pennsylvania lead due to their strong industrial base and presence of key players.
- Growth Potential: Significant growth potential in medical and environmental monitoring segments, driven by technological advancements and increasing regulatory scrutiny.
United States Chemical Sensors Market Product Landscape
The US chemical sensors market showcases a wide array of products with varying functionalities and performance characteristics. Innovations focus on improving sensitivity, selectivity, miniaturization, and integration with smart technologies. Electrochemical sensors remain dominant, while optical and catalytic bead sensors are gaining traction due to their specific advantages in certain applications. Unique selling propositions include real-time monitoring capabilities, wireless connectivity, and advanced data analytics features.
Key Drivers, Barriers & Challenges in United States Chemical Sensors Market
Key Drivers:
- Increasing automation across industrial processes.
- Stringent environmental regulations.
- Growing demand for safety and security in various sectors.
- Advancements in sensor technology, particularly in miniaturization and wireless connectivity.
Challenges & Restraints:
- High initial investment costs for advanced sensor technologies.
- Complexity in sensor integration and data analysis.
- Potential supply chain disruptions impacting sensor component availability.
- Regulatory hurdles and compliance requirements. This has led to approximately xx% of projects facing delays in 2024.
Emerging Opportunities in United States Chemical Sensors Market
- Growing demand for portable and wearable sensors in healthcare.
- Expanding applications in environmental monitoring, particularly for air and water quality analysis.
- Increasing use of chemical sensors in smart agriculture and precision farming.
- Development of advanced sensor systems with integrated data analytics and AI capabilities.
Growth Accelerators in the United States Chemical Sensors Market Industry
Strategic partnerships between sensor manufacturers and end-users to develop customized solutions are driving growth. Technological breakthroughs in miniaturization, improved sensitivity, and wireless connectivity are expanding applications and driving market expansion. Market expansion strategies, including geographical diversification and product diversification, further fuel the market’s long-term growth potential.
Key Players Shaping the United States Chemical Sensors Market Market
- Honeywell International Inc
- General Electric
- Smiths Detection Inc
- MSA Safety Incorporated
- Siemens AG
- SICK AG
- Hans Turck GmbH & Co KG
- Pepperl+Fuchs Group
- AirTest Technologies Inc
- SenseAir AB
Notable Milestones in United States Chemical Sensors Market Sector
- December 2020: CTS Corporation acquires Sensor Scientific Inc., expanding its temperature sensing portfolio and market reach within the industrial sector.
- January 2021: Sensemetrics launches Strand, a sensor connectivity device, enhancing sensor automation capabilities across various industries, including mining.
In-Depth United States Chemical Sensors Market Market Outlook
The US chemical sensors market is poised for significant growth over the next decade, driven by technological advancements, increasing regulatory pressures, and expanding applications across diverse sectors. Strategic investments in R&D, strategic partnerships, and focused market expansion will be key to capturing growth opportunities and establishing a strong market position. The market presents significant potential for innovation and disruption, with opportunities for companies to develop new sensor technologies and applications to meet the evolving needs of various industries.
United States Chemical Sensors Market Segmentation
-
1. Product Type
- 1.1. Electrochemical
- 1.2. Optical
- 1.3. Pallister/Catalytic Bead
- 1.4. Other Product Types
-
2. Application
- 2.1. Industrial
- 2.2. Medical
- 2.3. Environmental Monitoring
- 2.4. Defense and Homeland Security
- 2.5. Other Applications
United States Chemical Sensors Market Segmentation By Geography
- 1. United States
United States Chemical Sensors Market REPORT HIGHLIGHTS
| Aspects | Details |
|---|---|
| Study Period | 2019-2033 |
| Base Year | 2024 |
| Estimated Year | 2025 |
| Forecast Period | 2025-2033 |
| Historical Period | 2019-2024 |
| Growth Rate | CAGR of 6.20% from 2019-2033 |
| Segmentation |
|
Table of Contents
- 1. Introduction
- 1.1. Research Scope
- 1.2. Market Segmentation
- 1.3. Research Methodology
- 1.4. Definitions and Assumptions
- 2. Executive Summary
- 2.1. Introduction
- 3. Market Dynamics
- 3.1. Introduction
- 3.2. Market Drivers
- 3.2.1. Growing Developments in Miniaturised and Portable Electrochemical Sensors; Increased Adoption from Automotive and Healthcare Sector
- 3.3. Market Restrains
- 3.3.1. Lower Awareness of Facility Management Services
- 3.4. Market Trends
- 3.4.1. Medical Segment will Witness a Significant Growth
- 4. Market Factor Analysis
- 4.1. Porters Five Forces
- 4.2. Supply/Value Chain
- 4.3. PESTEL analysis
- 4.4. Market Entropy
- 4.5. Patent/Trademark Analysis
- 5. United States Chemical Sensors Market Analysis, Insights and Forecast, 2019-2031
- 5.1. Market Analysis, Insights and Forecast - by Product Type
- 5.1.1. Electrochemical
- 5.1.2. Optical
- 5.1.3. Pallister/Catalytic Bead
- 5.1.4. Other Product Types
- 5.2. Market Analysis, Insights and Forecast - by Application
- 5.2.1. Industrial
- 5.2.2. Medical
- 5.2.3. Environmental Monitoring
- 5.2.4. Defense and Homeland Security
- 5.2.5. Other Applications
- 5.3. Market Analysis, Insights and Forecast - by Region
- 5.3.1. United States
- 5.1. Market Analysis, Insights and Forecast - by Product Type
- 6. North America United States Chemical Sensors Market Analysis, Insights and Forecast, 2019-2031
- 6.1. Market Analysis, Insights and Forecast - By Country/Sub-region
- 6.1.1.
- 7. Europe United States Chemical Sensors Market Analysis, Insights and Forecast, 2019-2031
- 7.1. Market Analysis, Insights and Forecast - By Country/Sub-region
- 7.1.1.
- 8. Asia United States Chemical Sensors Market Analysis, Insights and Forecast, 2019-2031
- 8.1. Market Analysis, Insights and Forecast - By Country/Sub-region
- 8.1.1.
- 9. Australia and New Zealand United States Chemical Sensors Market Analysis, Insights and Forecast, 2019-2031
- 9.1. Market Analysis, Insights and Forecast - By Country/Sub-region
- 9.1.1.
- 10. Latin America United States Chemical Sensors Market Analysis, Insights and Forecast, 2019-2031
- 10.1. Market Analysis, Insights and Forecast - By Country/Sub-region
- 10.1.1.
- 11. Middle East and Africa United States Chemical Sensors Market Analysis, Insights and Forecast, 2019-2031
- 11.1. Market Analysis, Insights and Forecast - By Country/Sub-region
- 11.1.1.
- 12. Competitive Analysis
- 12.1. Market Share Analysis 2024
- 12.2. Company Profiles
- 12.2.1 Honeywell International Inc
- 12.2.1.1. Overview
- 12.2.1.2. Products
- 12.2.1.3. SWOT Analysis
- 12.2.1.4. Recent Developments
- 12.2.1.5. Financials (Based on Availability)
- 12.2.2 General Electric
- 12.2.2.1. Overview
- 12.2.2.2. Products
- 12.2.2.3. SWOT Analysis
- 12.2.2.4. Recent Developments
- 12.2.2.5. Financials (Based on Availability)
- 12.2.3 Smiths Detection Inc
- 12.2.3.1. Overview
- 12.2.3.2. Products
- 12.2.3.3. SWOT Analysis
- 12.2.3.4. Recent Developments
- 12.2.3.5. Financials (Based on Availability)
- 12.2.4 MSA Safety Incorporated
- 12.2.4.1. Overview
- 12.2.4.2. Products
- 12.2.4.3. SWOT Analysis
- 12.2.4.4. Recent Developments
- 12.2.4.5. Financials (Based on Availability)
- 12.2.5 Siemens AG
- 12.2.5.1. Overview
- 12.2.5.2. Products
- 12.2.5.3. SWOT Analysis
- 12.2.5.4. Recent Developments
- 12.2.5.5. Financials (Based on Availability)
- 12.2.6 SICK AG
- 12.2.6.1. Overview
- 12.2.6.2. Products
- 12.2.6.3. SWOT Analysis
- 12.2.6.4. Recent Developments
- 12.2.6.5. Financials (Based on Availability)
- 12.2.7 Hans Turck GmbH & Co KG
- 12.2.7.1. Overview
- 12.2.7.2. Products
- 12.2.7.3. SWOT Analysis
- 12.2.7.4. Recent Developments
- 12.2.7.5. Financials (Based on Availability)
- 12.2.8 Pepperl+Fuchs Group
- 12.2.8.1. Overview
- 12.2.8.2. Products
- 12.2.8.3. SWOT Analysis
- 12.2.8.4. Recent Developments
- 12.2.8.5. Financials (Based on Availability)
- 12.2.9 AirTest Technologies Inc
- 12.2.9.1. Overview
- 12.2.9.2. Products
- 12.2.9.3. SWOT Analysis
- 12.2.9.4. Recent Developments
- 12.2.9.5. Financials (Based on Availability)
- 12.2.10 SenseAir AB
- 12.2.10.1. Overview
- 12.2.10.2. Products
- 12.2.10.3. SWOT Analysis
- 12.2.10.4. Recent Developments
- 12.2.10.5. Financials (Based on Availability)
- 12.2.1 Honeywell International Inc
List of Figures
- Figure 1: United States Chemical Sensors Market Revenue Breakdown (Million, %) by Product 2024 & 2032
- Figure 2: United States Chemical Sensors Market Share (%) by Company 2024
List of Tables
- Table 1: United States Chemical Sensors Market Revenue Million Forecast, by Region 2019 & 2032
- Table 2: United States Chemical Sensors Market Volume K Unit Forecast, by Region 2019 & 2032
- Table 3: United States Chemical Sensors Market Revenue Million Forecast, by Product Type 2019 & 2032
- Table 4: United States Chemical Sensors Market Volume K Unit Forecast, by Product Type 2019 & 2032
- Table 5: United States Chemical Sensors Market Revenue Million Forecast, by Application 2019 & 2032
- Table 6: United States Chemical Sensors Market Volume K Unit Forecast, by Application 2019 & 2032
- Table 7: United States Chemical Sensors Market Revenue Million Forecast, by Region 2019 & 2032
- Table 8: United States Chemical Sensors Market Volume K Unit Forecast, by Region 2019 & 2032
- Table 9: United States Chemical Sensors Market Revenue Million Forecast, by Country 2019 & 2032
- Table 10: United States Chemical Sensors Market Volume K Unit Forecast, by Country 2019 & 2032
- Table 11: United States Chemical Sensors Market Revenue (Million) Forecast, by Application 2019 & 2032
- Table 12: United States Chemical Sensors Market Volume (K Unit) Forecast, by Application 2019 & 2032
- Table 13: United States Chemical Sensors Market Revenue Million Forecast, by Country 2019 & 2032
- Table 14: United States Chemical Sensors Market Volume K Unit Forecast, by Country 2019 & 2032
- Table 15: United States Chemical Sensors Market Revenue (Million) Forecast, by Application 2019 & 2032
- Table 16: United States Chemical Sensors Market Volume (K Unit) Forecast, by Application 2019 & 2032
- Table 17: United States Chemical Sensors Market Revenue Million Forecast, by Country 2019 & 2032
- Table 18: United States Chemical Sensors Market Volume K Unit Forecast, by Country 2019 & 2032
- Table 19: United States Chemical Sensors Market Revenue (Million) Forecast, by Application 2019 & 2032
- Table 20: United States Chemical Sensors Market Volume (K Unit) Forecast, by Application 2019 & 2032
- Table 21: United States Chemical Sensors Market Revenue Million Forecast, by Country 2019 & 2032
- Table 22: United States Chemical Sensors Market Volume K Unit Forecast, by Country 2019 & 2032
- Table 23: United States Chemical Sensors Market Revenue (Million) Forecast, by Application 2019 & 2032
- Table 24: United States Chemical Sensors Market Volume (K Unit) Forecast, by Application 2019 & 2032
- Table 25: United States Chemical Sensors Market Revenue Million Forecast, by Country 2019 & 2032
- Table 26: United States Chemical Sensors Market Volume K Unit Forecast, by Country 2019 & 2032
- Table 27: United States Chemical Sensors Market Revenue (Million) Forecast, by Application 2019 & 2032
- Table 28: United States Chemical Sensors Market Volume (K Unit) Forecast, by Application 2019 & 2032
- Table 29: United States Chemical Sensors Market Revenue Million Forecast, by Country 2019 & 2032
- Table 30: United States Chemical Sensors Market Volume K Unit Forecast, by Country 2019 & 2032
- Table 31: United States Chemical Sensors Market Revenue (Million) Forecast, by Application 2019 & 2032
- Table 32: United States Chemical Sensors Market Volume (K Unit) Forecast, by Application 2019 & 2032
- Table 33: United States Chemical Sensors Market Revenue Million Forecast, by Product Type 2019 & 2032
- Table 34: United States Chemical Sensors Market Volume K Unit Forecast, by Product Type 2019 & 2032
- Table 35: United States Chemical Sensors Market Revenue Million Forecast, by Application 2019 & 2032
- Table 36: United States Chemical Sensors Market Volume K Unit Forecast, by Application 2019 & 2032
- Table 37: United States Chemical Sensors Market Revenue Million Forecast, by Country 2019 & 2032
- Table 38: United States Chemical Sensors Market Volume K Unit Forecast, by Country 2019 & 2032
Frequently Asked Questions
1. What is the projected Compound Annual Growth Rate (CAGR) of the United States Chemical Sensors Market?
The projected CAGR is approximately 6.20%.
2. Which companies are prominent players in the United States Chemical Sensors Market?
Key companies in the market include Honeywell International Inc, General Electric, Smiths Detection Inc, MSA Safety Incorporated, Siemens AG, SICK AG, Hans Turck GmbH & Co KG, Pepperl+Fuchs Group, AirTest Technologies Inc, SenseAir AB.
3. What are the main segments of the United States Chemical Sensors Market?
The market segments include Product Type, Application.
4. Can you provide details about the market size?
The market size is estimated to be USD XX Million as of 2022.
5. What are some drivers contributing to market growth?
Growing Developments in Miniaturised and Portable Electrochemical Sensors; Increased Adoption from Automotive and Healthcare Sector.
6. What are the notable trends driving market growth?
Medical Segment will Witness a Significant Growth.
7. Are there any restraints impacting market growth?
Lower Awareness of Facility Management Services.
8. Can you provide examples of recent developments in the market?
January 2021: Sensemetrics introduced Strand, a sensor connectivity device, as part of its sensor automation product portfolio, which can be applied in mining amongst other industries.
9. What pricing options are available for accessing the report?
Pricing options include single-user, multi-user, and enterprise licenses priced at USD 3800, USD 4500, and USD 5800 respectively.
10. Is the market size provided in terms of value or volume?
The market size is provided in terms of value, measured in Million and volume, measured in K Unit.
11. Are there any specific market keywords associated with the report?
Yes, the market keyword associated with the report is "United States Chemical Sensors Market," which aids in identifying and referencing the specific market segment covered.
12. How do I determine which pricing option suits my needs best?
The pricing options vary based on user requirements and access needs. Individual users may opt for single-user licenses, while businesses requiring broader access may choose multi-user or enterprise licenses for cost-effective access to the report.
13. Are there any additional resources or data provided in the United States Chemical Sensors Market report?
While the report offers comprehensive insights, it's advisable to review the specific contents or supplementary materials provided to ascertain if additional resources or data are available.
14. How can I stay updated on further developments or reports in the United States Chemical Sensors Market?
To stay informed about further developments, trends, and reports in the United States Chemical Sensors Market, consider subscribing to industry newsletters, following relevant companies and organizations, or regularly checking reputable industry news sources and publications.
Methodology
Step 1 - Identification of Relevant Samples Size from Population Database


Step 2 - Approaches for Defining Global Market Size (Value, Volume* & Price*)

Note*: In applicable scenarios
Step 3 - Data Sources
Primary Research
- Web Analytics
- Survey Reports
- Research Institute
- Latest Research Reports
- Opinion Leaders
Secondary Research
- Annual Reports
- White Paper
- Latest Press Release
- Industry Association
- Paid Database
- Investor Presentations

Step 4 - Data Triangulation
Involves using different sources of information in order to increase the validity of a study
These sources are likely to be stakeholders in a program - participants, other researchers, program staff, other community members, and so on.
Then we put all data in single framework & apply various statistical tools to find out the dynamic on the market.
During the analysis stage, feedback from the stakeholder groups would be compared to determine areas of agreement as well as areas of divergence
