

Key Insights
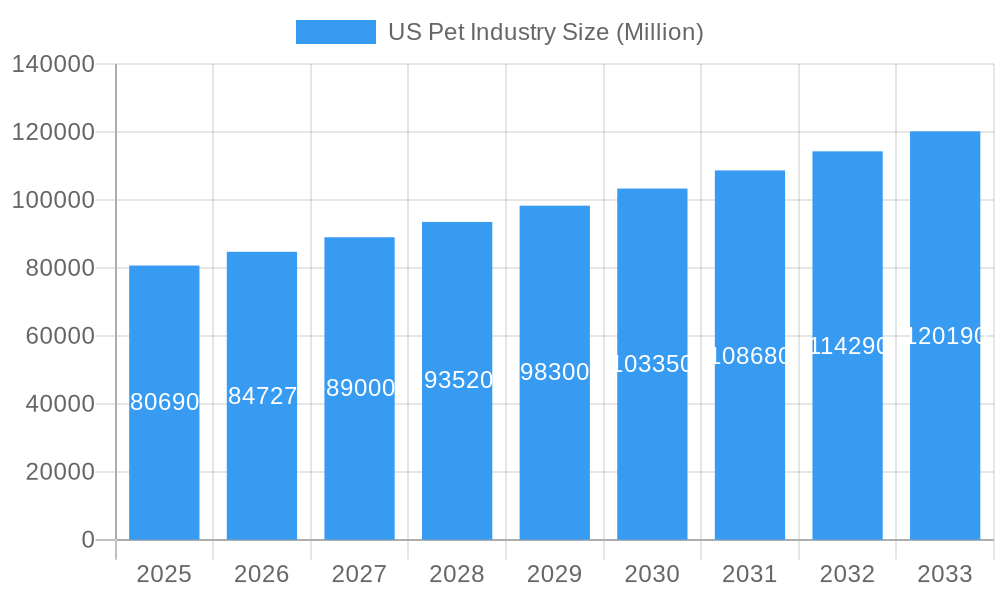
The US pet industry, a vibrant and rapidly expanding market, is projected to reach a substantial size, driven by increasing pet ownership and a growing humanization of pets. The market's value of $80.69 billion in 2025, exhibiting a Compound Annual Growth Rate (CAGR) of 5.06%, signifies a strong trajectory for growth through 2033. Key drivers include the rising disposable incomes enabling pet owners to spend more on premium pet food, healthcare, and accessories. Furthermore, the increasing awareness of pet health and wellbeing fuels demand for higher-quality products and veterinary services. Emerging trends such as pet insurance, personalized nutrition, and technologically advanced pet products contribute to market expansion. While potential restraints such as economic downturns and fluctuations in raw material costs exist, the overall resilience and growth of the pet care sector are expected to outweigh these challenges. The market is segmented by pet type (dogs, cats, birds, fish, others), product type (food, supplies/OTC medicine, others), and distribution channel (supermarkets, specialty stores, online retailers, others). Major players like Nestle Purina, Mars Inc., and Smucker's compete in this dynamic landscape, continuously innovating to cater to evolving consumer preferences. The regional breakdown across the United States, encompassing Northeast, Southeast, Midwest, Southwest, and West regions, reveals varying market dynamics and consumption patterns.
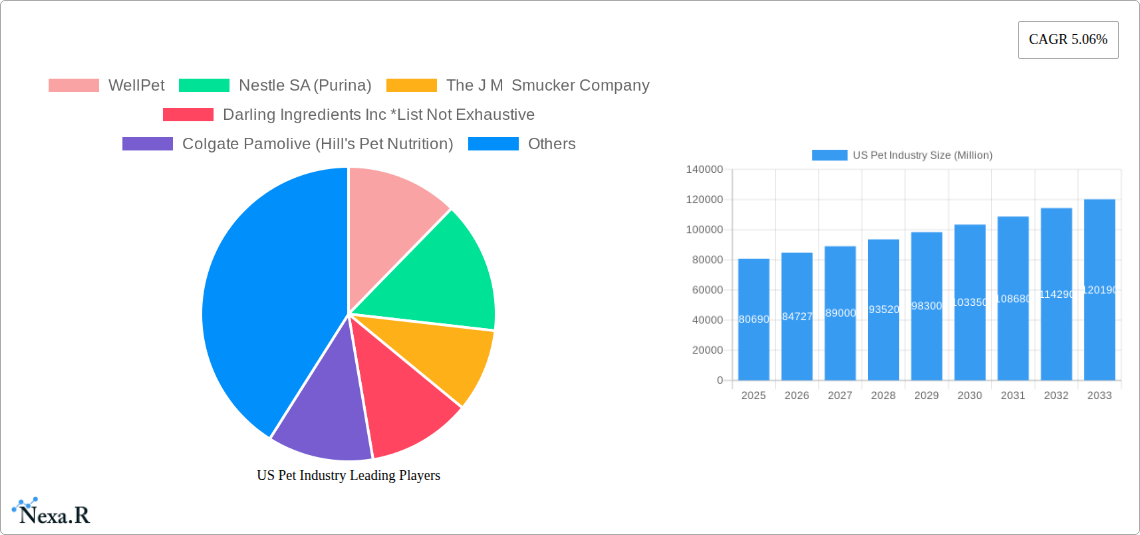
US Pet Industry Market Size (In Billion)
The forecast period (2025-2033) suggests continued strong growth, fueled by several factors. The increasing prevalence of single-person households and the perception of pets as family members further contribute to this trend. The rise of e-commerce platforms has also expanded access to a wider range of pet products and services, particularly in regions with limited access to brick-and-mortar stores. This accessibility, combined with the ongoing innovation in pet products and services, ensures continued expansion of the market. The competitive landscape, characterized by both large multinational corporations and smaller specialized companies, fosters innovation and ensures a wide range of choices for consumers. This intense competition also drives prices down and quality up, further contributing to market growth.
US Pet Industry Company Market Share
This comprehensive report provides a detailed analysis of the US pet industry, encompassing market dynamics, growth trends, key players, and future outlook. With a study period spanning 2019-2033, a base year of 2025, and a forecast period of 2025-2033, this report offers invaluable insights for industry professionals, investors, and stakeholders. The report leverages extensive data analysis to offer a 360-degree view of this dynamic market, segmented by pet type, product type, and distribution channel, delivering actionable intelligence for strategic decision-making. The total market size in 2025 is estimated at xx Million.
US Pet Industry Market Dynamics & Structure
The US pet industry represents a dynamic and evolving landscape, characterized by a blend of extensive consolidation at the top and a vibrant ecosystem of specialized smaller businesses. Leading global conglomerates such as Mars Inc., Nestle SA (Purina), and Colgate-Palmolive (Hill's Pet Nutrition) exert significant influence, while a multitude of innovative smaller companies successfully cater to burgeoning niche markets. Key growth catalysts include relentless technological advancement, particularly in the realms of sophisticated pet food formulation and cutting-edge veterinary care. Concurrently, shifting consumer paradigms are driving a robust demand for premium, specialized, and health-focused pet products. The industry operates within a stringent regulatory environment, ensuring pet food safety and upholding animal welfare standards, which actively shape market practices. The profound humanization of pets, wherein animals are increasingly viewed as integral family members, directly translates to escalating consumer expenditure on comprehensive pet care. This environment also fosters continuous merger and acquisition (M&A) activity, as established entities strategically acquire emerging brands to expand their portfolios and solidify market dominance.
- Market Concentration: While highly consolidated at the apex with the top 5 players anticipated to command approximately 70-75% of the market share in 2025, a substantial segment remains accessible to smaller, agile players.
- Technological Innovation: A significant trend is the development of advanced pet nutrition, focusing on natural and organic ingredients, bespoke dietary solutions tailored to individual pet needs (personalized nutrition), and the integration of technology in veterinary diagnostics and treatment.
- Regulatory Framework: The industry is governed by stringent regulations, primarily from the FDA, covering pet food safety, ingredient sourcing, labeling accuracy, and manufacturing standards.
- Competitive Substitutes: While premium products are in vogue, generic pet food brands and the growing trend of DIY pet care solutions continue to present competitive pressure, particularly for budget-conscious consumers.
- End-User Demographics: The expanding base of pet owners, notably the increasing adoption rates among millennials and Gen Z, coupled with rising disposable incomes, are fundamental pillars supporting sustained market growth.
- M&A Trends: The historical period has witnessed considerable M&A activity, driven by strategic consolidation, market expansion, and the acquisition of innovative technologies and brands. An estimated 40-50 significant M&A deals have been recorded in the recent past.
US Pet Industry Growth Trends & Insights
The US pet industry demonstrates consistent growth, driven by increasing pet ownership and rising spending per pet. The market size experienced significant growth during the historical period (2019-2024), expanding from xx Million in 2019 to xx Million in 2024, reflecting a CAGR of xx%. This upward trend is projected to continue, with the market estimated to reach xx Million in 2025 and further expand to xx Million by 2033, showcasing a CAGR of xx% during the forecast period. Technological disruptions, such as the rise of e-commerce and subscription services, profoundly impact consumer behavior, leading to increased convenience and personalized pet care solutions. Consumer preferences are shifting towards premium, natural, and organic pet products, driving innovation in product formulations and branding. Market penetration of premium pet food is steadily increasing, indicating a willingness to spend more on pet health and well-being.
Dominant Regions, Countries, or Segments in US Pet Industry
The highest growth is observed in the Dog segment within the By Pet Type category, followed by the Cat segment. Within By Product Type, Food constitutes the largest segment, driven by increasing demand for premium and specialized diets. In By Distribution Channel, Supermarket/Hypermarkets maintain significant market share due to convenience and widespread accessibility. However, Online Retail Stores demonstrate the fastest growth rate, reflecting the growing trend of online shopping. The Western region of the US generally exhibits higher pet ownership rates and spending compared to other regions.
- Key Drivers (Dog segment): High pet ownership, increasing humanization of pets, and rising adoption rates.
- Dominance Factors (Food segment): Essential nature of pet food, continuous demand, and significant spending by pet owners.
- Growth Potential (Online Retail Stores): Convenience, wide selection, competitive pricing, and targeted marketing.
US Pet Industry Product Landscape
The US pet industry showcases a wide range of products, including premium and specialized pet foods formulated to address specific dietary needs and health concerns. Innovations involve incorporating natural and organic ingredients, utilizing advanced technologies in food processing and packaging, and developing technologically driven solutions like connected pet feeders and smart collars. Unique selling propositions include tailored nutrition, functional benefits (e.g., joint health, cognitive function), and enhanced palatability. Veterinary care is also increasingly focusing on advanced diagnostics and minimally invasive procedures.
Key Drivers, Barriers & Challenges in US Pet Industry
Key Drivers: The sustained surge in pet ownership, the deepening emotional bond between owners and their pets (humanization), increasing disposable incomes across households, rapid technological integration across pet care products and services, and a heightened consumer awareness regarding pet health and well-being are paramount growth drivers.
Key Challenges: The industry grapples with inherent challenges including volatility in raw material prices, the complex and ongoing process of stringent regulatory compliance, intense and multifaceted competition across all segments, the potential for unforeseen supply chain disruptions, and growing consumer concerns regarding pet allergies and specific dietary sensitivities. The cumulative impact of these challenges can lead to increased product costs, pressure on profit margins, and necessitate adaptive business strategies.
Emerging Opportunities in US Pet Industry
The future of the US pet industry is rife with exciting opportunities. Personalized nutrition solutions, leveraging pet DNA and specific health metrics, are poised for significant growth. The demand for sustainable and eco-friendly pet products, from biodegradable waste bags to ethically sourced food ingredients, is rapidly expanding. The pet insurance market continues to mature, offering greater peace of mind to owners. Furthermore, the burgeoning market for comprehensive pet-related services, including specialized pet sitting, advanced grooming techniques, and professional training, presents considerable potential. Untapped markets also exist in catering to the specialized dietary needs of exotic animals and the growing demand for tailored products and services for senior pets.
Growth Accelerators in the US Pet Industry Industry
Long-term growth is accelerated by continuous innovation in pet food technology, strategic partnerships between pet care brands and veterinary professionals, expansion into new markets (e.g., pet tech), and the increasing focus on pet health and wellness.
Key Players Shaping the US Pet Industry Market
- WellPet (Focus on natural and holistic pet health products)
- Nestle SA (Purina) (A global leader with a vast portfolio of pet food brands)
- The J M Smucker Company (Known for brands like Milk-Bone and Meow Mix)
- Darling Ingredients Inc (A major player in rendering and ingredient solutions for pet food)
- Colgate-Palmolive (Hill's Pet Nutrition) (Specializing in science-based pet foods, including prescription diets)
- Pure and Natural Pet (Focus on organic and natural pet treats and food)
- United Pet Group Inc (A diversified provider of pet care products)
- Diamond Pet Foods (A family-owned company offering a wide range of pet food options)
- Blue Buffalo Co Ltd (Renowned for its "whole-of-life" nutrition philosophy)
- Mars Inc (A dominant force with extensive brands like Pedigree, Royal Canin, and Iams)
Notable Milestones in US Pet Industry Sector
- 2020: The COVID-19 pandemic catalyzed a substantial increase in pet adoption and a corresponding surge in demand for pet food, supplies, and at-home pet care solutions.
- 2021: The market saw a wave of innovative pet technology launches, including advanced smart feeders, AI-powered activity trackers, and remote monitoring devices, enhancing pet owner convenience and pet well-being.
- 2022: The industry experienced a period of significant consolidation and strategic realignments through several high-profile mergers and acquisitions, reshaping market shares and competitive dynamics.
- 2023: A pronounced and growing emphasis on sustainability and eco-friendly practices became a defining trend, with consumers increasingly seeking out products with reduced environmental impact.
- 2024 (Projected): Continued innovation in personalized pet nutrition, expansion of telehealth services for veterinary care, and a greater integration of AI in pet health management are anticipated trends.
In-Depth US Pet Industry Market Outlook
The US pet industry is poised for continued growth, driven by favorable demographic trends and technological advancements. Strategic opportunities exist in expanding premium product lines, investing in pet tech, and capitalizing on the growing demand for personalized pet care. The focus on pet health and well-being, coupled with innovation and strategic partnerships, will continue to shape the future trajectory of the market.
US Pet Industry Segmentation
-
1. Pet Type
- 1.1. Dog
- 1.2. Cat
- 1.3. Bird
- 1.4. Fresh Water Fish
- 1.5. Other Pet Types
-
2. Product Type
- 2.1. Food
- 2.2. Supplies/OTC Medicine
- 2.3. Other Product Types
-
3. Distribution Channel
- 3.1. Supermarkets/Hypermarkets
- 3.2. Specialty Stores
- 3.3. Online Retail Stores
- 3.4. Other Distribution Channels
US Pet Industry Segmentation By Geography
-
1. North America
- 1.1. United States
- 1.2. Canada
- 1.3. Mexico
-
2. South America
- 2.1. Brazil
- 2.2. Argentina
- 2.3. Rest of South America
-
3. Europe
- 3.1. United Kingdom
- 3.2. Germany
- 3.3. France
- 3.4. Italy
- 3.5. Spain
- 3.6. Russia
- 3.7. Benelux
- 3.8. Nordics
- 3.9. Rest of Europe
-
4. Middle East & Africa
- 4.1. Turkey
- 4.2. Israel
- 4.3. GCC
- 4.4. North Africa
- 4.5. South Africa
- 4.6. Rest of Middle East & Africa
-
5. Asia Pacific
- 5.1. China
- 5.2. India
- 5.3. Japan
- 5.4. South Korea
- 5.5. ASEAN
- 5.6. Oceania
- 5.7. Rest of Asia Pacific
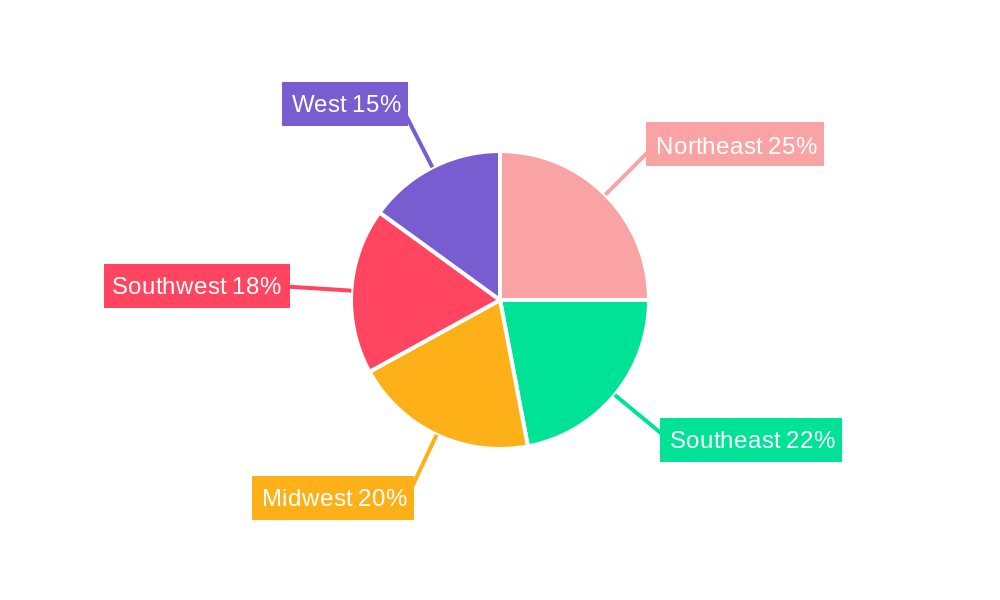
US Pet Industry Regional Market Share
Geographic Coverage of US Pet Industry
US Pet Industry REPORT HIGHLIGHTS
| Aspects | Details |
|---|---|
| Study Period | 2020-2034 |
| Base Year | 2025 |
| Estimated Year | 2026 |
| Forecast Period | 2026-2034 |
| Historical Period | 2020-2025 |
| Growth Rate | CAGR of 5.06% from 2020-2034 |
| Segmentation |
|
Table of Contents
- 1. Introduction
- 1.1. Research Scope
- 1.2. Market Segmentation
- 1.3. Research Objective
- 1.4. Definitions and Assumptions
- 2. Executive Summary
- 2.1. Market Snapshot
- 3. Market Dynamics
- 3.1. Market Drivers
- 3.2. Market Restrains
- 3.3. Market Trends
- 3.4. Market Opportunities
- 4. Market Factor Analysis
- 4.1. Porters Five Forces
- 4.1.1. Bargaining Power of Suppliers
- 4.1.2. Bargaining Power of Buyers
- 4.1.3. Threat of New Entrants
- 4.1.4. Threat of Substitutes
- 4.1.5. Competitive Rivalry
- 4.2. PESTEL analysis
- 4.3. BCG Analysis
- 4.3.1. Stars (High Growth, High Market Share)
- 4.3.2. Cash Cows (Low Growth, High Market Share)
- 4.3.3. Question Mark (High Growth, Low Market Share)
- 4.3.4. Dogs (Low Growth, Low Market Share)
- 4.4. Ansoff Matrix Analysis
- 4.5. Supply Chain Analysis
- 4.6. Regulatory Landscape
- 4.7. Current Market Potential and Opportunity Assessment (TAM–SAM–SOM Framework)
- 4.8. NRP Analyst Note
- 4.1. Porters Five Forces
- 5. Market Analysis, Insights and Forecast 2021-2033
- 5.1. Market Analysis, Insights and Forecast - by Pet Type
- 5.1.1. Dog
- 5.1.2. Cat
- 5.1.3. Bird
- 5.1.4. Fresh Water Fish
- 5.1.5. Other Pet Types
- 5.2. Market Analysis, Insights and Forecast - by Product Type
- 5.2.1. Food
- 5.2.2. Supplies/OTC Medicine
- 5.2.3. Other Product Types
- 5.3. Market Analysis, Insights and Forecast - by Distribution Channel
- 5.3.1. Supermarkets/Hypermarkets
- 5.3.2. Specialty Stores
- 5.3.3. Online Retail Stores
- 5.3.4. Other Distribution Channels
- 5.4. Market Analysis, Insights and Forecast - by Region
- 5.4.1. North America
- 5.4.2. South America
- 5.4.3. Europe
- 5.4.4. Middle East & Africa
- 5.4.5. Asia Pacific
- 5.1. Market Analysis, Insights and Forecast - by Pet Type
- 6. Global US Pet Industry Analysis, Insights and Forecast, 2021-2033
- 6.1. Market Analysis, Insights and Forecast - by Pet Type
- 6.1.1. Dog
- 6.1.2. Cat
- 6.1.3. Bird
- 6.1.4. Fresh Water Fish
- 6.1.5. Other Pet Types
- 6.2. Market Analysis, Insights and Forecast - by Product Type
- 6.2.1. Food
- 6.2.2. Supplies/OTC Medicine
- 6.2.3. Other Product Types
- 6.3. Market Analysis, Insights and Forecast - by Distribution Channel
- 6.3.1. Supermarkets/Hypermarkets
- 6.3.2. Specialty Stores
- 6.3.3. Online Retail Stores
- 6.3.4. Other Distribution Channels
- 6.1. Market Analysis, Insights and Forecast - by Pet Type
- 7. North America US Pet Industry Analysis, Insights and Forecast, 2020-2032
- 7.1. Market Analysis, Insights and Forecast - by Pet Type
- 7.1.1. Dog
- 7.1.2. Cat
- 7.1.3. Bird
- 7.1.4. Fresh Water Fish
- 7.1.5. Other Pet Types
- 7.2. Market Analysis, Insights and Forecast - by Product Type
- 7.2.1. Food
- 7.2.2. Supplies/OTC Medicine
- 7.2.3. Other Product Types
- 7.3. Market Analysis, Insights and Forecast - by Distribution Channel
- 7.3.1. Supermarkets/Hypermarkets
- 7.3.2. Specialty Stores
- 7.3.3. Online Retail Stores
- 7.3.4. Other Distribution Channels
- 7.1. Market Analysis, Insights and Forecast - by Pet Type
- 8. South America US Pet Industry Analysis, Insights and Forecast, 2020-2032
- 8.1. Market Analysis, Insights and Forecast - by Pet Type
- 8.1.1. Dog
- 8.1.2. Cat
- 8.1.3. Bird
- 8.1.4. Fresh Water Fish
- 8.1.5. Other Pet Types
- 8.2. Market Analysis, Insights and Forecast - by Product Type
- 8.2.1. Food
- 8.2.2. Supplies/OTC Medicine
- 8.2.3. Other Product Types
- 8.3. Market Analysis, Insights and Forecast - by Distribution Channel
- 8.3.1. Supermarkets/Hypermarkets
- 8.3.2. Specialty Stores
- 8.3.3. Online Retail Stores
- 8.3.4. Other Distribution Channels
- 8.1. Market Analysis, Insights and Forecast - by Pet Type
- 9. Europe US Pet Industry Analysis, Insights and Forecast, 2020-2032
- 9.1. Market Analysis, Insights and Forecast - by Pet Type
- 9.1.1. Dog
- 9.1.2. Cat
- 9.1.3. Bird
- 9.1.4. Fresh Water Fish
- 9.1.5. Other Pet Types
- 9.2. Market Analysis, Insights and Forecast - by Product Type
- 9.2.1. Food
- 9.2.2. Supplies/OTC Medicine
- 9.2.3. Other Product Types
- 9.3. Market Analysis, Insights and Forecast - by Distribution Channel
- 9.3.1. Supermarkets/Hypermarkets
- 9.3.2. Specialty Stores
- 9.3.3. Online Retail Stores
- 9.3.4. Other Distribution Channels
- 9.1. Market Analysis, Insights and Forecast - by Pet Type
- 10. Middle East & Africa US Pet Industry Analysis, Insights and Forecast, 2020-2032
- 10.1. Market Analysis, Insights and Forecast - by Pet Type
- 10.1.1. Dog
- 10.1.2. Cat
- 10.1.3. Bird
- 10.1.4. Fresh Water Fish
- 10.1.5. Other Pet Types
- 10.2. Market Analysis, Insights and Forecast - by Product Type
- 10.2.1. Food
- 10.2.2. Supplies/OTC Medicine
- 10.2.3. Other Product Types
- 10.3. Market Analysis, Insights and Forecast - by Distribution Channel
- 10.3.1. Supermarkets/Hypermarkets
- 10.3.2. Specialty Stores
- 10.3.3. Online Retail Stores
- 10.3.4. Other Distribution Channels
- 10.1. Market Analysis, Insights and Forecast - by Pet Type
- 11. Asia Pacific US Pet Industry Analysis, Insights and Forecast, 2020-2032
- 11.1. Market Analysis, Insights and Forecast - by Pet Type
- 11.1.1. Dog
- 11.1.2. Cat
- 11.1.3. Bird
- 11.1.4. Fresh Water Fish
- 11.1.5. Other Pet Types
- 11.2. Market Analysis, Insights and Forecast - by Product Type
- 11.2.1. Food
- 11.2.2. Supplies/OTC Medicine
- 11.2.3. Other Product Types
- 11.3. Market Analysis, Insights and Forecast - by Distribution Channel
- 11.3.1. Supermarkets/Hypermarkets
- 11.3.2. Specialty Stores
- 11.3.3. Online Retail Stores
- 11.3.4. Other Distribution Channels
- 11.1. Market Analysis, Insights and Forecast - by Pet Type
- 12. Competitive Analysis
- 12.1. Company Profiles
- 12.1.1 WellPet
- 12.1.1.1. Company Overview
- 12.1.1.2. Products
- 12.1.1.3. Company Financials
- 12.1.1.4. SWOT Analysis
- 12.1.2 Nestle SA (Purina)
- 12.1.2.1. Company Overview
- 12.1.2.2. Products
- 12.1.2.3. Company Financials
- 12.1.2.4. SWOT Analysis
- 12.1.3 The J M Smucker Company
- 12.1.3.1. Company Overview
- 12.1.3.2. Products
- 12.1.3.3. Company Financials
- 12.1.3.4. SWOT Analysis
- 12.1.4 Darling Ingredients Inc *List Not Exhaustive
- 12.1.4.1. Company Overview
- 12.1.4.2. Products
- 12.1.4.3. Company Financials
- 12.1.4.4. SWOT Analysis
- 12.1.5 Colgate Pamolive (Hill's Pet Nutrition)
- 12.1.5.1. Company Overview
- 12.1.5.2. Products
- 12.1.5.3. Company Financials
- 12.1.5.4. SWOT Analysis
- 12.1.6 Pure and Natural Pet
- 12.1.6.1. Company Overview
- 12.1.6.2. Products
- 12.1.6.3. Company Financials
- 12.1.6.4. SWOT Analysis
- 12.1.7 United Pet Group Inc
- 12.1.7.1. Company Overview
- 12.1.7.2. Products
- 12.1.7.3. Company Financials
- 12.1.7.4. SWOT Analysis
- 12.1.8 Diamond Pet Foods
- 12.1.8.1. Company Overview
- 12.1.8.2. Products
- 12.1.8.3. Company Financials
- 12.1.8.4. SWOT Analysis
- 12.1.9 Blue Buffalo Co Ltd
- 12.1.9.1. Company Overview
- 12.1.9.2. Products
- 12.1.9.3. Company Financials
- 12.1.9.4. SWOT Analysis
- 12.1.10 Mars Inc
- 12.1.10.1. Company Overview
- 12.1.10.2. Products
- 12.1.10.3. Company Financials
- 12.1.10.4. SWOT Analysis
- 12.1.1 WellPet
- 12.2. Market Entropy
- 12.2.1 Company's Key Areas Served
- 12.2.2 Recent Developments
- 12.3. Company Market Share Analysis 2025
- 12.3.1 Top 5 Companies Market Share Analysis
- 12.3.2 Top 3 Companies Market Share Analysis
- 12.4. List of Potential Customers
- 13. Research Methodology
List of Figures
- Figure 1: Global US Pet Industry Revenue Breakdown (Million, %) by Region 2025 & 2033
- Figure 2: North America US Pet Industry Revenue (Million), by Pet Type 2025 & 2033
- Figure 3: North America US Pet Industry Revenue Share (%), by Pet Type 2025 & 2033
- Figure 4: North America US Pet Industry Revenue (Million), by Product Type 2025 & 2033
- Figure 5: North America US Pet Industry Revenue Share (%), by Product Type 2025 & 2033
- Figure 6: North America US Pet Industry Revenue (Million), by Distribution Channel 2025 & 2033
- Figure 7: North America US Pet Industry Revenue Share (%), by Distribution Channel 2025 & 2033
- Figure 8: North America US Pet Industry Revenue (Million), by Country 2025 & 2033
- Figure 9: North America US Pet Industry Revenue Share (%), by Country 2025 & 2033
- Figure 10: South America US Pet Industry Revenue (Million), by Pet Type 2025 & 2033
- Figure 11: South America US Pet Industry Revenue Share (%), by Pet Type 2025 & 2033
- Figure 12: South America US Pet Industry Revenue (Million), by Product Type 2025 & 2033
- Figure 13: South America US Pet Industry Revenue Share (%), by Product Type 2025 & 2033
- Figure 14: South America US Pet Industry Revenue (Million), by Distribution Channel 2025 & 2033
- Figure 15: South America US Pet Industry Revenue Share (%), by Distribution Channel 2025 & 2033
- Figure 16: South America US Pet Industry Revenue (Million), by Country 2025 & 2033
- Figure 17: South America US Pet Industry Revenue Share (%), by Country 2025 & 2033
- Figure 18: Europe US Pet Industry Revenue (Million), by Pet Type 2025 & 2033
- Figure 19: Europe US Pet Industry Revenue Share (%), by Pet Type 2025 & 2033
- Figure 20: Europe US Pet Industry Revenue (Million), by Product Type 2025 & 2033
- Figure 21: Europe US Pet Industry Revenue Share (%), by Product Type 2025 & 2033
- Figure 22: Europe US Pet Industry Revenue (Million), by Distribution Channel 2025 & 2033
- Figure 23: Europe US Pet Industry Revenue Share (%), by Distribution Channel 2025 & 2033
- Figure 24: Europe US Pet Industry Revenue (Million), by Country 2025 & 2033
- Figure 25: Europe US Pet Industry Revenue Share (%), by Country 2025 & 2033
- Figure 26: Middle East & Africa US Pet Industry Revenue (Million), by Pet Type 2025 & 2033
- Figure 27: Middle East & Africa US Pet Industry Revenue Share (%), by Pet Type 2025 & 2033
- Figure 28: Middle East & Africa US Pet Industry Revenue (Million), by Product Type 2025 & 2033
- Figure 29: Middle East & Africa US Pet Industry Revenue Share (%), by Product Type 2025 & 2033
- Figure 30: Middle East & Africa US Pet Industry Revenue (Million), by Distribution Channel 2025 & 2033
- Figure 31: Middle East & Africa US Pet Industry Revenue Share (%), by Distribution Channel 2025 & 2033
- Figure 32: Middle East & Africa US Pet Industry Revenue (Million), by Country 2025 & 2033
- Figure 33: Middle East & Africa US Pet Industry Revenue Share (%), by Country 2025 & 2033
- Figure 34: Asia Pacific US Pet Industry Revenue (Million), by Pet Type 2025 & 2033
- Figure 35: Asia Pacific US Pet Industry Revenue Share (%), by Pet Type 2025 & 2033
- Figure 36: Asia Pacific US Pet Industry Revenue (Million), by Product Type 2025 & 2033
- Figure 37: Asia Pacific US Pet Industry Revenue Share (%), by Product Type 2025 & 2033
- Figure 38: Asia Pacific US Pet Industry Revenue (Million), by Distribution Channel 2025 & 2033
- Figure 39: Asia Pacific US Pet Industry Revenue Share (%), by Distribution Channel 2025 & 2033
- Figure 40: Asia Pacific US Pet Industry Revenue (Million), by Country 2025 & 2033
- Figure 41: Asia Pacific US Pet Industry Revenue Share (%), by Country 2025 & 2033
List of Tables
- Table 1: Global US Pet Industry Revenue Million Forecast, by Pet Type 2020 & 2033
- Table 2: Global US Pet Industry Revenue Million Forecast, by Product Type 2020 & 2033
- Table 3: Global US Pet Industry Revenue Million Forecast, by Distribution Channel 2020 & 2033
- Table 4: Global US Pet Industry Revenue Million Forecast, by Region 2020 & 2033
- Table 5: Global US Pet Industry Revenue Million Forecast, by Pet Type 2020 & 2033
- Table 6: Global US Pet Industry Revenue Million Forecast, by Product Type 2020 & 2033
- Table 7: Global US Pet Industry Revenue Million Forecast, by Distribution Channel 2020 & 2033
- Table 8: Global US Pet Industry Revenue Million Forecast, by Country 2020 & 2033
- Table 9: United States US Pet Industry Revenue (Million) Forecast, by Application 2020 & 2033
- Table 10: Canada US Pet Industry Revenue (Million) Forecast, by Application 2020 & 2033
- Table 11: Mexico US Pet Industry Revenue (Million) Forecast, by Application 2020 & 2033
- Table 12: Global US Pet Industry Revenue Million Forecast, by Pet Type 2020 & 2033
- Table 13: Global US Pet Industry Revenue Million Forecast, by Product Type 2020 & 2033
- Table 14: Global US Pet Industry Revenue Million Forecast, by Distribution Channel 2020 & 2033
- Table 15: Global US Pet Industry Revenue Million Forecast, by Country 2020 & 2033
- Table 16: Brazil US Pet Industry Revenue (Million) Forecast, by Application 2020 & 2033
- Table 17: Argentina US Pet Industry Revenue (Million) Forecast, by Application 2020 & 2033
- Table 18: Rest of South America US Pet Industry Revenue (Million) Forecast, by Application 2020 & 2033
- Table 19: Global US Pet Industry Revenue Million Forecast, by Pet Type 2020 & 2033
- Table 20: Global US Pet Industry Revenue Million Forecast, by Product Type 2020 & 2033
- Table 21: Global US Pet Industry Revenue Million Forecast, by Distribution Channel 2020 & 2033
- Table 22: Global US Pet Industry Revenue Million Forecast, by Country 2020 & 2033
- Table 23: United Kingdom US Pet Industry Revenue (Million) Forecast, by Application 2020 & 2033
- Table 24: Germany US Pet Industry Revenue (Million) Forecast, by Application 2020 & 2033
- Table 25: France US Pet Industry Revenue (Million) Forecast, by Application 2020 & 2033
- Table 26: Italy US Pet Industry Revenue (Million) Forecast, by Application 2020 & 2033
- Table 27: Spain US Pet Industry Revenue (Million) Forecast, by Application 2020 & 2033
- Table 28: Russia US Pet Industry Revenue (Million) Forecast, by Application 2020 & 2033
- Table 29: Benelux US Pet Industry Revenue (Million) Forecast, by Application 2020 & 2033
- Table 30: Nordics US Pet Industry Revenue (Million) Forecast, by Application 2020 & 2033
- Table 31: Rest of Europe US Pet Industry Revenue (Million) Forecast, by Application 2020 & 2033
- Table 32: Global US Pet Industry Revenue Million Forecast, by Pet Type 2020 & 2033
- Table 33: Global US Pet Industry Revenue Million Forecast, by Product Type 2020 & 2033
- Table 34: Global US Pet Industry Revenue Million Forecast, by Distribution Channel 2020 & 2033
- Table 35: Global US Pet Industry Revenue Million Forecast, by Country 2020 & 2033
- Table 36: Turkey US Pet Industry Revenue (Million) Forecast, by Application 2020 & 2033
- Table 37: Israel US Pet Industry Revenue (Million) Forecast, by Application 2020 & 2033
- Table 38: GCC US Pet Industry Revenue (Million) Forecast, by Application 2020 & 2033
- Table 39: North Africa US Pet Industry Revenue (Million) Forecast, by Application 2020 & 2033
- Table 40: South Africa US Pet Industry Revenue (Million) Forecast, by Application 2020 & 2033
- Table 41: Rest of Middle East & Africa US Pet Industry Revenue (Million) Forecast, by Application 2020 & 2033
- Table 42: Global US Pet Industry Revenue Million Forecast, by Pet Type 2020 & 2033
- Table 43: Global US Pet Industry Revenue Million Forecast, by Product Type 2020 & 2033
- Table 44: Global US Pet Industry Revenue Million Forecast, by Distribution Channel 2020 & 2033
- Table 45: Global US Pet Industry Revenue Million Forecast, by Country 2020 & 2033
- Table 46: China US Pet Industry Revenue (Million) Forecast, by Application 2020 & 2033
- Table 47: India US Pet Industry Revenue (Million) Forecast, by Application 2020 & 2033
- Table 48: Japan US Pet Industry Revenue (Million) Forecast, by Application 2020 & 2033
- Table 49: South Korea US Pet Industry Revenue (Million) Forecast, by Application 2020 & 2033
- Table 50: ASEAN US Pet Industry Revenue (Million) Forecast, by Application 2020 & 2033
- Table 51: Oceania US Pet Industry Revenue (Million) Forecast, by Application 2020 & 2033
- Table 52: Rest of Asia Pacific US Pet Industry Revenue (Million) Forecast, by Application 2020 & 2033
Frequently Asked Questions
1. What is the projected Compound Annual Growth Rate (CAGR) of the US Pet Industry?
The projected CAGR is approximately 5.06%.
2. Which companies are prominent players in the US Pet Industry?
Key companies in the market include WellPet, Nestle SA (Purina), The J M Smucker Company, Darling Ingredients Inc *List Not Exhaustive, Colgate Pamolive (Hill's Pet Nutrition), Pure and Natural Pet, United Pet Group Inc, Diamond Pet Foods, Blue Buffalo Co Ltd, Mars Inc.
3. What are the main segments of the US Pet Industry?
The market segments include Pet Type, Product Type, Distribution Channel.
4. Can you provide details about the market size?
The market size is estimated to be USD 80.69 Million as of 2022.
5. What are some drivers contributing to market growth?
Increased Pet Humanization; Growing Trend of E-commerce.
6. What are the notable trends driving market growth?
Increase in the Number of Pet Owners and Increased Expenditures on Pets.
7. Are there any restraints impacting market growth?
Rising Cost of Raw Material Production; Growing Concern Over Environment and Pet Health.
8. Can you provide examples of recent developments in the market?
N/A
9. What pricing options are available for accessing the report?
Pricing options include single-user, multi-user, and enterprise licenses priced at USD 3800, USD 4500, and USD 5800 respectively.
10. Is the market size provided in terms of value or volume?
The market size is provided in terms of value, measured in Million.
11. Are there any specific market keywords associated with the report?
Yes, the market keyword associated with the report is "US Pet Industry," which aids in identifying and referencing the specific market segment covered.
12. How do I determine which pricing option suits my needs best?
The pricing options vary based on user requirements and access needs. Individual users may opt for single-user licenses, while businesses requiring broader access may choose multi-user or enterprise licenses for cost-effective access to the report.
13. Are there any additional resources or data provided in the US Pet Industry report?
While the report offers comprehensive insights, it's advisable to review the specific contents or supplementary materials provided to ascertain if additional resources or data are available.
14. How can I stay updated on further developments or reports in the US Pet Industry?
To stay informed about further developments, trends, and reports in the US Pet Industry, consider subscribing to industry newsletters, following relevant companies and organizations, or regularly checking reputable industry news sources and publications.
Methodology
Step 1 - Identification of Relevant Samples Size from Population Database


Step 2 - Approaches for Defining Global Market Size (Value, Volume* & Price*)

Note*: In applicable scenarios
Step 3 - Data Sources
Primary Research
- Web Analytics
- Survey Reports
- Research Institute
- Latest Research Reports
- Opinion Leaders
Secondary Research
- Annual Reports
- White Paper
- Latest Press Release
- Industry Association
- Paid Database
- Investor Presentations

Step 4 - Data Triangulation
Involves using different sources of information in order to increase the validity of a study
These sources are likely to be stakeholders in a program - participants, other researchers, program staff, other community members, and so on.
Then we put all data in single framework & apply various statistical tools to find out the dynamic on the market.
During the analysis stage, feedback from the stakeholder groups would be compared to determine areas of agreement as well as areas of divergence