

Key Insights
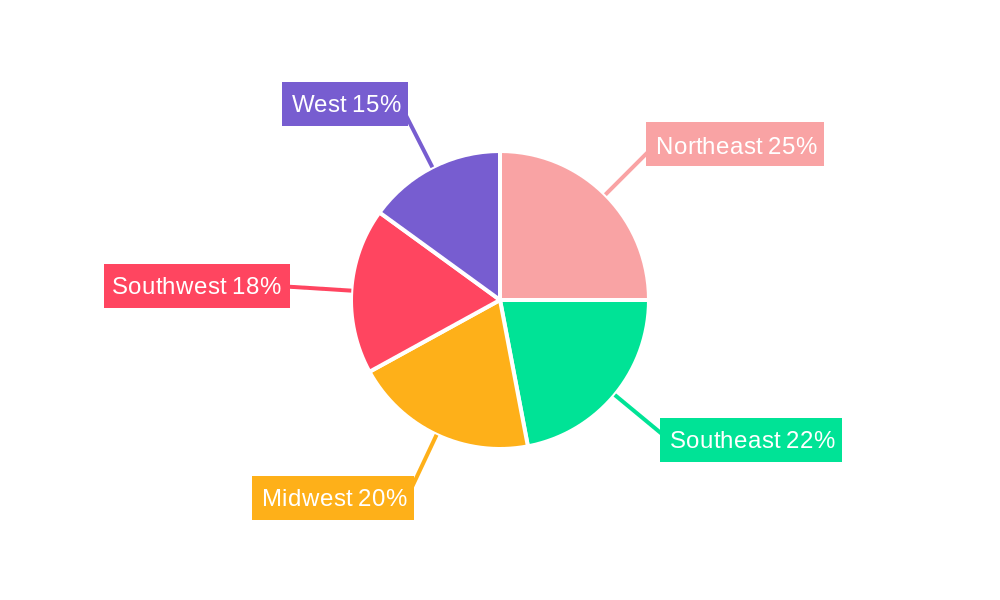
The US smart TV market, valued at approximately $XX million in 2025, is projected to experience steady growth, driven by several key factors. The increasing adoption of streaming services, coupled with the desire for enhanced home entertainment experiences, fuels demand for larger screen sizes and higher resolutions, particularly 4K UHD and beyond. The shift towards smart features integrated directly into televisions, offering convenient access to apps and voice control, continues to be a major driver. Consumers are also increasingly seeking premium panel technologies like OLED and QLED for superior picture quality, pushing the average price point upwards. While the market faces some restraints, such as economic fluctuations impacting consumer spending and the potential saturation of the high-end market segments, ongoing technological advancements and innovation in areas such as improved HDR support, gaming capabilities, and integration with smart home ecosystems are expected to mitigate these challenges. The competitive landscape is robust, with established players like Samsung, LG, and Sony competing against emerging brands, leading to innovations and competitive pricing. The segment breakdown reveals strong growth in larger screen sizes (55 inches and above) and premium features. The geographical distribution shows significant market penetration across all regions of the US, with potentially higher adoption rates in urban and suburban areas.
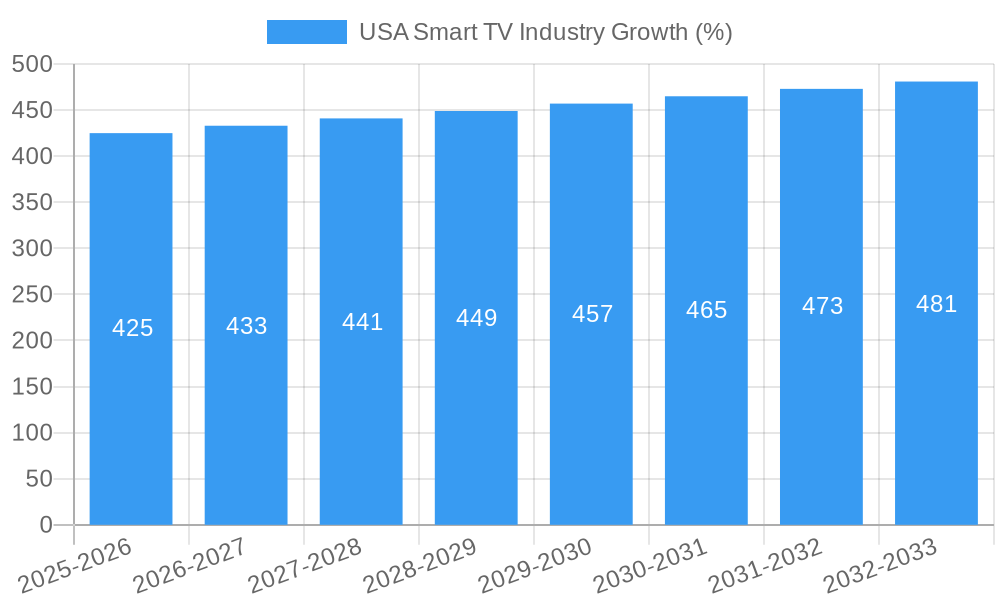
The forecast period (2025-2033) anticipates a CAGR of 1.70%, indicating a gradual but consistent expansion of the market. This growth is expected to be driven by ongoing technological advancements, such as the introduction of 8K resolution TVs and improved AI-powered features. While the penetration rate of smart TVs in US households is already high, continued replacement cycles, fueled by upgrades to newer technologies and larger screen sizes, will contribute to market growth. Different price segments will experience varying levels of growth, with the premium segments (USD 2,000 and above) potentially exhibiting faster growth due to the adoption of advanced features and technology. However, the mid-range segment (USD 1,000 to USD 2,000) is likely to remain the largest contributor to overall market volume due to its accessibility and appeal to a broader range of consumers.
This comprehensive report provides a detailed analysis of the USA Smart TV industry, covering market dynamics, growth trends, dominant segments, product landscape, key players, and future outlook. The report uses data from 2019-2024 (Historical Period), with estimates for 2025 (Base Year and Estimated Year) and forecasts extending to 2033 (Forecast Period). All unit values are presented in millions.

USA Smart TV Industry Market Dynamics & Structure
The US Smart TV market is characterized by intense competition among numerous global and domestic brands, resulting in a moderately fragmented market structure. While a few major players hold significant market share, the presence of numerous smaller players ensures considerable dynamism. Technological innovation is a crucial driver, with continuous improvements in resolution (4K UHD, 8K), panel technology (OLED, QLED, Mini-LED), and smart features (integrated streaming, voice control, gaming capabilities) shaping consumer preferences. Regulatory frameworks concerning energy efficiency and data privacy also influence market developments. The market experiences competitive pressure from substitute products like projectors and large-screen monitors. The end-user demographic is broad, spanning various age groups and income levels, with a significant focus on households seeking enhanced entertainment experiences. M&A activity has been moderate in recent years, with xx deals recorded between 2019 and 2024, primarily focused on strategic acquisitions to expand product portfolios or strengthen market presence.
- Market Concentration: Moderately fragmented, with top 5 players holding approximately xx% market share in 2024.
- Technological Innovation: Key drivers include advancements in display technology (OLED, QLED, Mini-LED), higher resolutions (8K), and enhanced smart features (AI, voice assistants).
- Regulatory Framework: Energy efficiency standards and data privacy regulations are significant influencing factors.
- Competitive Substitutes: Projectors and large-screen monitors pose competitive threats.
- End-User Demographics: Broad demographic appeal across age groups and income levels, driven by entertainment demand.
- M&A Trends: Moderate activity (xx deals 2019-2024), mainly focused on strategic acquisitions.
USA Smart TV Industry Growth Trends & Insights
The US Smart TV market has experienced consistent growth over the historical period (2019-2024), with market size expanding from xx million units in 2019 to xx million units in 2024, representing a CAGR of xx%. This growth is primarily fueled by increasing consumer adoption driven by affordability, technological advancements, and the rising popularity of streaming services. The penetration rate of smart TVs in US households increased from xx% in 2019 to xx% in 2024. The market is witnessing significant technological disruptions, including the rise of 8K resolution, adoption of advanced panel technologies (OLED, QLED), and the integration of sophisticated smart features. Consumer behavior shifts towards larger screen sizes and premium features are also influencing market dynamics. The forecast period (2025-2033) projects continued growth, with the market size expected to reach xx million units by 2033, driven by factors such as increasing disposable incomes, the expansion of high-speed internet access, and the growing popularity of 4K and 8K content. However, economic downturns could potentially impact sales in certain price segments.
Dominant Regions, Countries, or Segments in USA Smart TV Industry
The US Smart TV market is geographically diverse, with no single region exhibiting overwhelming dominance. However, urban areas generally show higher adoption rates due to better infrastructure and higher disposable incomes. The 45-55 inch screen size segment has historically been the largest, but the 55 inches and above segment is growing rapidly. In terms of resolution, 4K UHD TVs dominate the market, accounting for xx% of sales in 2024. LED and QLED panel technologies are also increasingly favored for their brightness, color accuracy, and affordability, while OLED remains a premium segment. The USD 1,000 to USD 2,000 pricing range remains a significant market segment.
- Screen Size: 55 inches and above segment demonstrating the strongest growth, driven by consumer preference for immersive viewing experiences.
- Resolution: 4K UHD TV holds the majority market share, while 8K adoption is gradually increasing.
- Panel Type: LED and QLED dominate due to cost-effectiveness; OLED retains a niche for premium consumers.
- Pricing Range: USD 1,000 to USD 2,000 represents the largest sales volume segment.
- Operating Systems: Android TV and Roku maintain leading market shares due to extensive app ecosystems.
USA Smart TV Industry Product Landscape
Smart TVs in the US market showcase a wide array of features and functionalities. Technological advancements center around higher resolutions, enhanced color accuracy, improved HDR performance, and sophisticated smart capabilities. Key innovations include the adoption of Mini-LED and MicroLED backlighting for improved contrast and brightness, along with features like integrated voice assistants, hands-free control, and advanced gaming features (variable refresh rates, low latency modes). Unique selling propositions frequently highlight superior picture quality, immersive sound systems, and seamless integration with other smart home devices. The market emphasizes improved user interfaces and intuitive navigation systems for ease of use.
Key Drivers, Barriers & Challenges in USA Smart TV Industry
Key Drivers:
- Technological advancements in display technology and smart features.
- Rising consumer demand for high-quality home entertainment.
- Increasing affordability of smart TVs.
Key Challenges & Restraints:
- Supply chain disruptions impacting component availability and pricing.
- Economic downturns leading to reduced consumer spending.
- Intense competition among numerous brands. xx% decline in average selling prices in 2024.
Emerging Opportunities in USA Smart TV Industry
- Expansion into niche markets (e.g., gaming-centric TVs).
- Integration of new technologies (e.g., 8K resolution, AI).
- Development of innovative features (e.g., enhanced voice control, advanced gaming functions).
- Increased focus on eco-friendly manufacturing processes.
Growth Accelerators in the USA Smart TV Industry Industry
Long-term growth will be driven by continuous technological innovation, strategic partnerships between TV manufacturers and content providers, and the expansion into emerging markets. Advancements in display technology, such as MicroLED and improved OLED, will further fuel demand. Strategic alliances will enhance content offerings and improve user experience. Expansion into smart home ecosystems will create new avenues for growth.
Key Players Shaping the USA Smart TV Industry Market
- LG Electronics Inc (LG Electronics)
- TCL Technology
- Haier Group Corporation
- Samsung Electronics Co Ltd (Samsung)
- Westinghouse Electric Corporation
- Hitachi Ltd
- Hisense Group Co Ltd
- Insignia Systems Inc
- Koninklijke Philips NV (Philips)
- Sharp Corporation
- VIZIO Inc
- Panasonic Corporation (Panasonic)
- Sony Corporation (Sony)
Notable Milestones in USA Smart TV Industry Sector
- January 2022: Samsung announced its 2022 smart TV lineup, including Micro LED, New QLED, and Lifestyle series, with a new Smart Hub featuring cloud gaming and NFT management.
- April 2022: Panasonic launched its flagship OLED TV, the LZ2000, in 55-inch, 65-inch, and 77-inch sizes, emphasizing gaming features.
In-Depth USA Smart TV Industry Market Outlook
The future of the US Smart TV market is promising, with continued growth driven by technological advancements, enhanced user experiences, and the expansion of streaming services. Opportunities lie in developing innovative features, expanding into niche markets (gaming, eco-friendly products), and leveraging strategic partnerships. The market will likely see continued adoption of larger screen sizes, higher resolutions, and premium panel technologies. However, economic factors and competition will remain key considerations.
USA Smart TV Industry Segmentation
-
1. Screen Size (Diagonal)
- 1.1. 30-45 Inches
- 1.2. 45-55 Inches
- 1.3. 55 Inches and above
-
2. Resolution Type
- 2.1. 4K UHD TV
- 2.2. Full HD TV
- 2.3. HDTV
-
3. Panel Type
- 3.1. LCD
- 3.2. LED
- 3.3. OLED
- 3.4. QLED
-
4. Pricing Range
- 4.1. Under USD 1,000
- 4.2. USD 1,000 to USD 2,000
- 4.3. USD 2,000 to USD 3,000
- 4.4. USD 3,000 and Above
-
5. Operating Segment
- 5.1. Android
- 5.2. Tizen
- 5.3. WebOS
- 5.4. Roku
- 5.5. Other Operating Systems
USA Smart TV Industry Segmentation By Geography
-
1. North America
- 1.1. United States
- 1.2. Canada
- 1.3. Mexico
-
2. South America
- 2.1. Brazil
- 2.2. Argentina
- 2.3. Rest of South America
-
3. Europe
- 3.1. United Kingdom
- 3.2. Germany
- 3.3. France
- 3.4. Italy
- 3.5. Spain
- 3.6. Russia
- 3.7. Benelux
- 3.8. Nordics
- 3.9. Rest of Europe
-
4. Middle East & Africa
- 4.1. Turkey
- 4.2. Israel
- 4.3. GCC
- 4.4. North Africa
- 4.5. South Africa
- 4.6. Rest of Middle East & Africa
-
5. Asia Pacific
- 5.1. China
- 5.2. India
- 5.3. Japan
- 5.4. South Korea
- 5.5. ASEAN
- 5.6. Oceania
- 5.7. Rest of Asia Pacific
USA Smart TV Industry REPORT HIGHLIGHTS
| Aspects | Details |
|---|---|
| Study Period | 2019-2033 |
| Base Year | 2024 |
| Estimated Year | 2025 |
| Forecast Period | 2025-2033 |
| Historical Period | 2019-2024 |
| Growth Rate | CAGR of 1.70% from 2019-2033 |
| Segmentation |
|
Table of Contents
- 1. Introduction
- 1.1. Research Scope
- 1.2. Market Segmentation
- 1.3. Research Methodology
- 1.4. Definitions and Assumptions
- 2. Executive Summary
- 2.1. Introduction
- 3. Market Dynamics
- 3.1. Introduction
- 3.2. Market Drivers
- 3.2.1. Growing Disposable Income across Emerging Economies; Rising Trend of Video-on-demand Service
- 3.3. Market Restrains
- 3.3.1. Slower Rate of Penetration of Telematics in Developing Regions; Delayed Regulatory Sanctions
- 3.4. Market Trends
- 3.4.1. Boosting Demand for 55 Inches and above Screen Size
- 4. Market Factor Analysis
- 4.1. Porters Five Forces
- 4.2. Supply/Value Chain
- 4.3. PESTEL analysis
- 4.4. Market Entropy
- 4.5. Patent/Trademark Analysis
- 5. Global USA Smart TV Industry Analysis, Insights and Forecast, 2019-2031
- 5.1. Market Analysis, Insights and Forecast - by Screen Size (Diagonal)
- 5.1.1. 30-45 Inches
- 5.1.2. 45-55 Inches
- 5.1.3. 55 Inches and above
- 5.2. Market Analysis, Insights and Forecast - by Resolution Type
- 5.2.1. 4K UHD TV
- 5.2.2. Full HD TV
- 5.2.3. HDTV
- 5.3. Market Analysis, Insights and Forecast - by Panel Type
- 5.3.1. LCD
- 5.3.2. LED
- 5.3.3. OLED
- 5.3.4. QLED
- 5.4. Market Analysis, Insights and Forecast - by Pricing Range
- 5.4.1. Under USD 1,000
- 5.4.2. USD 1,000 to USD 2,000
- 5.4.3. USD 2,000 to USD 3,000
- 5.4.4. USD 3,000 and Above
- 5.5. Market Analysis, Insights and Forecast - by Operating Segment
- 5.5.1. Android
- 5.5.2. Tizen
- 5.5.3. WebOS
- 5.5.4. Roku
- 5.5.5. Other Operating Systems
- 5.6. Market Analysis, Insights and Forecast - by Region
- 5.6.1. North America
- 5.6.2. South America
- 5.6.3. Europe
- 5.6.4. Middle East & Africa
- 5.6.5. Asia Pacific
- 5.1. Market Analysis, Insights and Forecast - by Screen Size (Diagonal)
- 6. North America USA Smart TV Industry Analysis, Insights and Forecast, 2019-2031
- 6.1. Market Analysis, Insights and Forecast - by Screen Size (Diagonal)
- 6.1.1. 30-45 Inches
- 6.1.2. 45-55 Inches
- 6.1.3. 55 Inches and above
- 6.2. Market Analysis, Insights and Forecast - by Resolution Type
- 6.2.1. 4K UHD TV
- 6.2.2. Full HD TV
- 6.2.3. HDTV
- 6.3. Market Analysis, Insights and Forecast - by Panel Type
- 6.3.1. LCD
- 6.3.2. LED
- 6.3.3. OLED
- 6.3.4. QLED
- 6.4. Market Analysis, Insights and Forecast - by Pricing Range
- 6.4.1. Under USD 1,000
- 6.4.2. USD 1,000 to USD 2,000
- 6.4.3. USD 2,000 to USD 3,000
- 6.4.4. USD 3,000 and Above
- 6.5. Market Analysis, Insights and Forecast - by Operating Segment
- 6.5.1. Android
- 6.5.2. Tizen
- 6.5.3. WebOS
- 6.5.4. Roku
- 6.5.5. Other Operating Systems
- 6.1. Market Analysis, Insights and Forecast - by Screen Size (Diagonal)
- 7. South America USA Smart TV Industry Analysis, Insights and Forecast, 2019-2031
- 7.1. Market Analysis, Insights and Forecast - by Screen Size (Diagonal)
- 7.1.1. 30-45 Inches
- 7.1.2. 45-55 Inches
- 7.1.3. 55 Inches and above
- 7.2. Market Analysis, Insights and Forecast - by Resolution Type
- 7.2.1. 4K UHD TV
- 7.2.2. Full HD TV
- 7.2.3. HDTV
- 7.3. Market Analysis, Insights and Forecast - by Panel Type
- 7.3.1. LCD
- 7.3.2. LED
- 7.3.3. OLED
- 7.3.4. QLED
- 7.4. Market Analysis, Insights and Forecast - by Pricing Range
- 7.4.1. Under USD 1,000
- 7.4.2. USD 1,000 to USD 2,000
- 7.4.3. USD 2,000 to USD 3,000
- 7.4.4. USD 3,000 and Above
- 7.5. Market Analysis, Insights and Forecast - by Operating Segment
- 7.5.1. Android
- 7.5.2. Tizen
- 7.5.3. WebOS
- 7.5.4. Roku
- 7.5.5. Other Operating Systems
- 7.1. Market Analysis, Insights and Forecast - by Screen Size (Diagonal)
- 8. Europe USA Smart TV Industry Analysis, Insights and Forecast, 2019-2031
- 8.1. Market Analysis, Insights and Forecast - by Screen Size (Diagonal)
- 8.1.1. 30-45 Inches
- 8.1.2. 45-55 Inches
- 8.1.3. 55 Inches and above
- 8.2. Market Analysis, Insights and Forecast - by Resolution Type
- 8.2.1. 4K UHD TV
- 8.2.2. Full HD TV
- 8.2.3. HDTV
- 8.3. Market Analysis, Insights and Forecast - by Panel Type
- 8.3.1. LCD
- 8.3.2. LED
- 8.3.3. OLED
- 8.3.4. QLED
- 8.4. Market Analysis, Insights and Forecast - by Pricing Range
- 8.4.1. Under USD 1,000
- 8.4.2. USD 1,000 to USD 2,000
- 8.4.3. USD 2,000 to USD 3,000
- 8.4.4. USD 3,000 and Above
- 8.5. Market Analysis, Insights and Forecast - by Operating Segment
- 8.5.1. Android
- 8.5.2. Tizen
- 8.5.3. WebOS
- 8.5.4. Roku
- 8.5.5. Other Operating Systems
- 8.1. Market Analysis, Insights and Forecast - by Screen Size (Diagonal)
- 9. Middle East & Africa USA Smart TV Industry Analysis, Insights and Forecast, 2019-2031
- 9.1. Market Analysis, Insights and Forecast - by Screen Size (Diagonal)
- 9.1.1. 30-45 Inches
- 9.1.2. 45-55 Inches
- 9.1.3. 55 Inches and above
- 9.2. Market Analysis, Insights and Forecast - by Resolution Type
- 9.2.1. 4K UHD TV
- 9.2.2. Full HD TV
- 9.2.3. HDTV
- 9.3. Market Analysis, Insights and Forecast - by Panel Type
- 9.3.1. LCD
- 9.3.2. LED
- 9.3.3. OLED
- 9.3.4. QLED
- 9.4. Market Analysis, Insights and Forecast - by Pricing Range
- 9.4.1. Under USD 1,000
- 9.4.2. USD 1,000 to USD 2,000
- 9.4.3. USD 2,000 to USD 3,000
- 9.4.4. USD 3,000 and Above
- 9.5. Market Analysis, Insights and Forecast - by Operating Segment
- 9.5.1. Android
- 9.5.2. Tizen
- 9.5.3. WebOS
- 9.5.4. Roku
- 9.5.5. Other Operating Systems
- 9.1. Market Analysis, Insights and Forecast - by Screen Size (Diagonal)
- 10. Asia Pacific USA Smart TV Industry Analysis, Insights and Forecast, 2019-2031
- 10.1. Market Analysis, Insights and Forecast - by Screen Size (Diagonal)
- 10.1.1. 30-45 Inches
- 10.1.2. 45-55 Inches
- 10.1.3. 55 Inches and above
- 10.2. Market Analysis, Insights and Forecast - by Resolution Type
- 10.2.1. 4K UHD TV
- 10.2.2. Full HD TV
- 10.2.3. HDTV
- 10.3. Market Analysis, Insights and Forecast - by Panel Type
- 10.3.1. LCD
- 10.3.2. LED
- 10.3.3. OLED
- 10.3.4. QLED
- 10.4. Market Analysis, Insights and Forecast - by Pricing Range
- 10.4.1. Under USD 1,000
- 10.4.2. USD 1,000 to USD 2,000
- 10.4.3. USD 2,000 to USD 3,000
- 10.4.4. USD 3,000 and Above
- 10.5. Market Analysis, Insights and Forecast - by Operating Segment
- 10.5.1. Android
- 10.5.2. Tizen
- 10.5.3. WebOS
- 10.5.4. Roku
- 10.5.5. Other Operating Systems
- 10.1. Market Analysis, Insights and Forecast - by Screen Size (Diagonal)
- 11. Northeast USA Smart TV Industry Analysis, Insights and Forecast, 2019-2031
- 12. Southeast USA Smart TV Industry Analysis, Insights and Forecast, 2019-2031
- 13. Midwest USA Smart TV Industry Analysis, Insights and Forecast, 2019-2031
- 14. Southwest USA Smart TV Industry Analysis, Insights and Forecast, 2019-2031
- 15. West USA Smart TV Industry Analysis, Insights and Forecast, 2019-2031
- 16. Competitive Analysis
- 16.1. Global Market Share Analysis 2024
- 16.2. Company Profiles
- 16.2.1 LG Electronics Inc
- 16.2.1.1. Overview
- 16.2.1.2. Products
- 16.2.1.3. SWOT Analysis
- 16.2.1.4. Recent Developments
- 16.2.1.5. Financials (Based on Availability)
- 16.2.2 TCL Technology*List Not Exhaustive
- 16.2.2.1. Overview
- 16.2.2.2. Products
- 16.2.2.3. SWOT Analysis
- 16.2.2.4. Recent Developments
- 16.2.2.5. Financials (Based on Availability)
- 16.2.3 Haier Group Corporation
- 16.2.3.1. Overview
- 16.2.3.2. Products
- 16.2.3.3. SWOT Analysis
- 16.2.3.4. Recent Developments
- 16.2.3.5. Financials (Based on Availability)
- 16.2.4 Samsung Electronics Co Ltd
- 16.2.4.1. Overview
- 16.2.4.2. Products
- 16.2.4.3. SWOT Analysis
- 16.2.4.4. Recent Developments
- 16.2.4.5. Financials (Based on Availability)
- 16.2.5 Westinghouse Electric Corporation
- 16.2.5.1. Overview
- 16.2.5.2. Products
- 16.2.5.3. SWOT Analysis
- 16.2.5.4. Recent Developments
- 16.2.5.5. Financials (Based on Availability)
- 16.2.6 Hitachi Ltd
- 16.2.6.1. Overview
- 16.2.6.2. Products
- 16.2.6.3. SWOT Analysis
- 16.2.6.4. Recent Developments
- 16.2.6.5. Financials (Based on Availability)
- 16.2.7 Hisense Group Co Ltd
- 16.2.7.1. Overview
- 16.2.7.2. Products
- 16.2.7.3. SWOT Analysis
- 16.2.7.4. Recent Developments
- 16.2.7.5. Financials (Based on Availability)
- 16.2.8 Insignia Systems Inc
- 16.2.8.1. Overview
- 16.2.8.2. Products
- 16.2.8.3. SWOT Analysis
- 16.2.8.4. Recent Developments
- 16.2.8.5. Financials (Based on Availability)
- 16.2.9 Koninklijke Philips NV
- 16.2.9.1. Overview
- 16.2.9.2. Products
- 16.2.9.3. SWOT Analysis
- 16.2.9.4. Recent Developments
- 16.2.9.5. Financials (Based on Availability)
- 16.2.10 Sharp Corporation
- 16.2.10.1. Overview
- 16.2.10.2. Products
- 16.2.10.3. SWOT Analysis
- 16.2.10.4. Recent Developments
- 16.2.10.5. Financials (Based on Availability)
- 16.2.11 VIZIO Inc
- 16.2.11.1. Overview
- 16.2.11.2. Products
- 16.2.11.3. SWOT Analysis
- 16.2.11.4. Recent Developments
- 16.2.11.5. Financials (Based on Availability)
- 16.2.12 Panasonic Corporation
- 16.2.12.1. Overview
- 16.2.12.2. Products
- 16.2.12.3. SWOT Analysis
- 16.2.12.4. Recent Developments
- 16.2.12.5. Financials (Based on Availability)
- 16.2.13 Sony Corporation
- 16.2.13.1. Overview
- 16.2.13.2. Products
- 16.2.13.3. SWOT Analysis
- 16.2.13.4. Recent Developments
- 16.2.13.5. Financials (Based on Availability)
- 16.2.1 LG Electronics Inc
List of Figures
- Figure 1: Global USA Smart TV Industry Revenue Breakdown (Million, %) by Region 2024 & 2032
- Figure 2: Global USA Smart TV Industry Volume Breakdown (Million, %) by Region 2024 & 2032
- Figure 3: United states USA Smart TV Industry Revenue (Million), by Country 2024 & 2032
- Figure 4: United states USA Smart TV Industry Volume (Million), by Country 2024 & 2032
- Figure 5: United states USA Smart TV Industry Revenue Share (%), by Country 2024 & 2032
- Figure 6: United states USA Smart TV Industry Volume Share (%), by Country 2024 & 2032
- Figure 7: North America USA Smart TV Industry Revenue (Million), by Screen Size (Diagonal) 2024 & 2032
- Figure 8: North America USA Smart TV Industry Volume (Million), by Screen Size (Diagonal) 2024 & 2032
- Figure 9: North America USA Smart TV Industry Revenue Share (%), by Screen Size (Diagonal) 2024 & 2032
- Figure 10: North America USA Smart TV Industry Volume Share (%), by Screen Size (Diagonal) 2024 & 2032
- Figure 11: North America USA Smart TV Industry Revenue (Million), by Resolution Type 2024 & 2032
- Figure 12: North America USA Smart TV Industry Volume (Million), by Resolution Type 2024 & 2032
- Figure 13: North America USA Smart TV Industry Revenue Share (%), by Resolution Type 2024 & 2032
- Figure 14: North America USA Smart TV Industry Volume Share (%), by Resolution Type 2024 & 2032
- Figure 15: North America USA Smart TV Industry Revenue (Million), by Panel Type 2024 & 2032
- Figure 16: North America USA Smart TV Industry Volume (Million), by Panel Type 2024 & 2032
- Figure 17: North America USA Smart TV Industry Revenue Share (%), by Panel Type 2024 & 2032
- Figure 18: North America USA Smart TV Industry Volume Share (%), by Panel Type 2024 & 2032
- Figure 19: North America USA Smart TV Industry Revenue (Million), by Pricing Range 2024 & 2032
- Figure 20: North America USA Smart TV Industry Volume (Million), by Pricing Range 2024 & 2032
- Figure 21: North America USA Smart TV Industry Revenue Share (%), by Pricing Range 2024 & 2032
- Figure 22: North America USA Smart TV Industry Volume Share (%), by Pricing Range 2024 & 2032
- Figure 23: North America USA Smart TV Industry Revenue (Million), by Operating Segment 2024 & 2032
- Figure 24: North America USA Smart TV Industry Volume (Million), by Operating Segment 2024 & 2032
- Figure 25: North America USA Smart TV Industry Revenue Share (%), by Operating Segment 2024 & 2032
- Figure 26: North America USA Smart TV Industry Volume Share (%), by Operating Segment 2024 & 2032
- Figure 27: North America USA Smart TV Industry Revenue (Million), by Country 2024 & 2032
- Figure 28: North America USA Smart TV Industry Volume (Million), by Country 2024 & 2032
- Figure 29: North America USA Smart TV Industry Revenue Share (%), by Country 2024 & 2032
- Figure 30: North America USA Smart TV Industry Volume Share (%), by Country 2024 & 2032
- Figure 31: South America USA Smart TV Industry Revenue (Million), by Screen Size (Diagonal) 2024 & 2032
- Figure 32: South America USA Smart TV Industry Volume (Million), by Screen Size (Diagonal) 2024 & 2032
- Figure 33: South America USA Smart TV Industry Revenue Share (%), by Screen Size (Diagonal) 2024 & 2032
- Figure 34: South America USA Smart TV Industry Volume Share (%), by Screen Size (Diagonal) 2024 & 2032
- Figure 35: South America USA Smart TV Industry Revenue (Million), by Resolution Type 2024 & 2032
- Figure 36: South America USA Smart TV Industry Volume (Million), by Resolution Type 2024 & 2032
- Figure 37: South America USA Smart TV Industry Revenue Share (%), by Resolution Type 2024 & 2032
- Figure 38: South America USA Smart TV Industry Volume Share (%), by Resolution Type 2024 & 2032
- Figure 39: South America USA Smart TV Industry Revenue (Million), by Panel Type 2024 & 2032
- Figure 40: South America USA Smart TV Industry Volume (Million), by Panel Type 2024 & 2032
- Figure 41: South America USA Smart TV Industry Revenue Share (%), by Panel Type 2024 & 2032
- Figure 42: South America USA Smart TV Industry Volume Share (%), by Panel Type 2024 & 2032
- Figure 43: South America USA Smart TV Industry Revenue (Million), by Pricing Range 2024 & 2032
- Figure 44: South America USA Smart TV Industry Volume (Million), by Pricing Range 2024 & 2032
- Figure 45: South America USA Smart TV Industry Revenue Share (%), by Pricing Range 2024 & 2032
- Figure 46: South America USA Smart TV Industry Volume Share (%), by Pricing Range 2024 & 2032
- Figure 47: South America USA Smart TV Industry Revenue (Million), by Operating Segment 2024 & 2032
- Figure 48: South America USA Smart TV Industry Volume (Million), by Operating Segment 2024 & 2032
- Figure 49: South America USA Smart TV Industry Revenue Share (%), by Operating Segment 2024 & 2032
- Figure 50: South America USA Smart TV Industry Volume Share (%), by Operating Segment 2024 & 2032
- Figure 51: South America USA Smart TV Industry Revenue (Million), by Country 2024 & 2032
- Figure 52: South America USA Smart TV Industry Volume (Million), by Country 2024 & 2032
- Figure 53: South America USA Smart TV Industry Revenue Share (%), by Country 2024 & 2032
- Figure 54: South America USA Smart TV Industry Volume Share (%), by Country 2024 & 2032
- Figure 55: Europe USA Smart TV Industry Revenue (Million), by Screen Size (Diagonal) 2024 & 2032
- Figure 56: Europe USA Smart TV Industry Volume (Million), by Screen Size (Diagonal) 2024 & 2032
- Figure 57: Europe USA Smart TV Industry Revenue Share (%), by Screen Size (Diagonal) 2024 & 2032
- Figure 58: Europe USA Smart TV Industry Volume Share (%), by Screen Size (Diagonal) 2024 & 2032
- Figure 59: Europe USA Smart TV Industry Revenue (Million), by Resolution Type 2024 & 2032
- Figure 60: Europe USA Smart TV Industry Volume (Million), by Resolution Type 2024 & 2032
- Figure 61: Europe USA Smart TV Industry Revenue Share (%), by Resolution Type 2024 & 2032
- Figure 62: Europe USA Smart TV Industry Volume Share (%), by Resolution Type 2024 & 2032
- Figure 63: Europe USA Smart TV Industry Revenue (Million), by Panel Type 2024 & 2032
- Figure 64: Europe USA Smart TV Industry Volume (Million), by Panel Type 2024 & 2032
- Figure 65: Europe USA Smart TV Industry Revenue Share (%), by Panel Type 2024 & 2032
- Figure 66: Europe USA Smart TV Industry Volume Share (%), by Panel Type 2024 & 2032
- Figure 67: Europe USA Smart TV Industry Revenue (Million), by Pricing Range 2024 & 2032
- Figure 68: Europe USA Smart TV Industry Volume (Million), by Pricing Range 2024 & 2032
- Figure 69: Europe USA Smart TV Industry Revenue Share (%), by Pricing Range 2024 & 2032
- Figure 70: Europe USA Smart TV Industry Volume Share (%), by Pricing Range 2024 & 2032
- Figure 71: Europe USA Smart TV Industry Revenue (Million), by Operating Segment 2024 & 2032
- Figure 72: Europe USA Smart TV Industry Volume (Million), by Operating Segment 2024 & 2032
- Figure 73: Europe USA Smart TV Industry Revenue Share (%), by Operating Segment 2024 & 2032
- Figure 74: Europe USA Smart TV Industry Volume Share (%), by Operating Segment 2024 & 2032
- Figure 75: Europe USA Smart TV Industry Revenue (Million), by Country 2024 & 2032
- Figure 76: Europe USA Smart TV Industry Volume (Million), by Country 2024 & 2032
- Figure 77: Europe USA Smart TV Industry Revenue Share (%), by Country 2024 & 2032
- Figure 78: Europe USA Smart TV Industry Volume Share (%), by Country 2024 & 2032
- Figure 79: Middle East & Africa USA Smart TV Industry Revenue (Million), by Screen Size (Diagonal) 2024 & 2032
- Figure 80: Middle East & Africa USA Smart TV Industry Volume (Million), by Screen Size (Diagonal) 2024 & 2032
- Figure 81: Middle East & Africa USA Smart TV Industry Revenue Share (%), by Screen Size (Diagonal) 2024 & 2032
- Figure 82: Middle East & Africa USA Smart TV Industry Volume Share (%), by Screen Size (Diagonal) 2024 & 2032
- Figure 83: Middle East & Africa USA Smart TV Industry Revenue (Million), by Resolution Type 2024 & 2032
- Figure 84: Middle East & Africa USA Smart TV Industry Volume (Million), by Resolution Type 2024 & 2032
- Figure 85: Middle East & Africa USA Smart TV Industry Revenue Share (%), by Resolution Type 2024 & 2032
- Figure 86: Middle East & Africa USA Smart TV Industry Volume Share (%), by Resolution Type 2024 & 2032
- Figure 87: Middle East & Africa USA Smart TV Industry Revenue (Million), by Panel Type 2024 & 2032
- Figure 88: Middle East & Africa USA Smart TV Industry Volume (Million), by Panel Type 2024 & 2032
- Figure 89: Middle East & Africa USA Smart TV Industry Revenue Share (%), by Panel Type 2024 & 2032
- Figure 90: Middle East & Africa USA Smart TV Industry Volume Share (%), by Panel Type 2024 & 2032
- Figure 91: Middle East & Africa USA Smart TV Industry Revenue (Million), by Pricing Range 2024 & 2032
- Figure 92: Middle East & Africa USA Smart TV Industry Volume (Million), by Pricing Range 2024 & 2032
- Figure 93: Middle East & Africa USA Smart TV Industry Revenue Share (%), by Pricing Range 2024 & 2032
- Figure 94: Middle East & Africa USA Smart TV Industry Volume Share (%), by Pricing Range 2024 & 2032
- Figure 95: Middle East & Africa USA Smart TV Industry Revenue (Million), by Operating Segment 2024 & 2032
- Figure 96: Middle East & Africa USA Smart TV Industry Volume (Million), by Operating Segment 2024 & 2032
- Figure 97: Middle East & Africa USA Smart TV Industry Revenue Share (%), by Operating Segment 2024 & 2032
- Figure 98: Middle East & Africa USA Smart TV Industry Volume Share (%), by Operating Segment 2024 & 2032
- Figure 99: Middle East & Africa USA Smart TV Industry Revenue (Million), by Country 2024 & 2032
- Figure 100: Middle East & Africa USA Smart TV Industry Volume (Million), by Country 2024 & 2032
- Figure 101: Middle East & Africa USA Smart TV Industry Revenue Share (%), by Country 2024 & 2032
- Figure 102: Middle East & Africa USA Smart TV Industry Volume Share (%), by Country 2024 & 2032
- Figure 103: Asia Pacific USA Smart TV Industry Revenue (Million), by Screen Size (Diagonal) 2024 & 2032
- Figure 104: Asia Pacific USA Smart TV Industry Volume (Million), by Screen Size (Diagonal) 2024 & 2032
- Figure 105: Asia Pacific USA Smart TV Industry Revenue Share (%), by Screen Size (Diagonal) 2024 & 2032
- Figure 106: Asia Pacific USA Smart TV Industry Volume Share (%), by Screen Size (Diagonal) 2024 & 2032
- Figure 107: Asia Pacific USA Smart TV Industry Revenue (Million), by Resolution Type 2024 & 2032
- Figure 108: Asia Pacific USA Smart TV Industry Volume (Million), by Resolution Type 2024 & 2032
- Figure 109: Asia Pacific USA Smart TV Industry Revenue Share (%), by Resolution Type 2024 & 2032
- Figure 110: Asia Pacific USA Smart TV Industry Volume Share (%), by Resolution Type 2024 & 2032
- Figure 111: Asia Pacific USA Smart TV Industry Revenue (Million), by Panel Type 2024 & 2032
- Figure 112: Asia Pacific USA Smart TV Industry Volume (Million), by Panel Type 2024 & 2032
- Figure 113: Asia Pacific USA Smart TV Industry Revenue Share (%), by Panel Type 2024 & 2032
- Figure 114: Asia Pacific USA Smart TV Industry Volume Share (%), by Panel Type 2024 & 2032
- Figure 115: Asia Pacific USA Smart TV Industry Revenue (Million), by Pricing Range 2024 & 2032
- Figure 116: Asia Pacific USA Smart TV Industry Volume (Million), by Pricing Range 2024 & 2032
- Figure 117: Asia Pacific USA Smart TV Industry Revenue Share (%), by Pricing Range 2024 & 2032
- Figure 118: Asia Pacific USA Smart TV Industry Volume Share (%), by Pricing Range 2024 & 2032
- Figure 119: Asia Pacific USA Smart TV Industry Revenue (Million), by Operating Segment 2024 & 2032
- Figure 120: Asia Pacific USA Smart TV Industry Volume (Million), by Operating Segment 2024 & 2032
- Figure 121: Asia Pacific USA Smart TV Industry Revenue Share (%), by Operating Segment 2024 & 2032
- Figure 122: Asia Pacific USA Smart TV Industry Volume Share (%), by Operating Segment 2024 & 2032
- Figure 123: Asia Pacific USA Smart TV Industry Revenue (Million), by Country 2024 & 2032
- Figure 124: Asia Pacific USA Smart TV Industry Volume (Million), by Country 2024 & 2032
- Figure 125: Asia Pacific USA Smart TV Industry Revenue Share (%), by Country 2024 & 2032
- Figure 126: Asia Pacific USA Smart TV Industry Volume Share (%), by Country 2024 & 2032
List of Tables
- Table 1: Global USA Smart TV Industry Revenue Million Forecast, by Region 2019 & 2032
- Table 2: Global USA Smart TV Industry Volume Million Forecast, by Region 2019 & 2032
- Table 3: Global USA Smart TV Industry Revenue Million Forecast, by Screen Size (Diagonal) 2019 & 2032
- Table 4: Global USA Smart TV Industry Volume Million Forecast, by Screen Size (Diagonal) 2019 & 2032
- Table 5: Global USA Smart TV Industry Revenue Million Forecast, by Resolution Type 2019 & 2032
- Table 6: Global USA Smart TV Industry Volume Million Forecast, by Resolution Type 2019 & 2032
- Table 7: Global USA Smart TV Industry Revenue Million Forecast, by Panel Type 2019 & 2032
- Table 8: Global USA Smart TV Industry Volume Million Forecast, by Panel Type 2019 & 2032
- Table 9: Global USA Smart TV Industry Revenue Million Forecast, by Pricing Range 2019 & 2032
- Table 10: Global USA Smart TV Industry Volume Million Forecast, by Pricing Range 2019 & 2032
- Table 11: Global USA Smart TV Industry Revenue Million Forecast, by Operating Segment 2019 & 2032
- Table 12: Global USA Smart TV Industry Volume Million Forecast, by Operating Segment 2019 & 2032
- Table 13: Global USA Smart TV Industry Revenue Million Forecast, by Region 2019 & 2032
- Table 14: Global USA Smart TV Industry Volume Million Forecast, by Region 2019 & 2032
- Table 15: Global USA Smart TV Industry Revenue Million Forecast, by Country 2019 & 2032
- Table 16: Global USA Smart TV Industry Volume Million Forecast, by Country 2019 & 2032
- Table 17: Northeast USA Smart TV Industry Revenue (Million) Forecast, by Application 2019 & 2032
- Table 18: Northeast USA Smart TV Industry Volume (Million) Forecast, by Application 2019 & 2032
- Table 19: Southeast USA Smart TV Industry Revenue (Million) Forecast, by Application 2019 & 2032
- Table 20: Southeast USA Smart TV Industry Volume (Million) Forecast, by Application 2019 & 2032
- Table 21: Midwest USA Smart TV Industry Revenue (Million) Forecast, by Application 2019 & 2032
- Table 22: Midwest USA Smart TV Industry Volume (Million) Forecast, by Application 2019 & 2032
- Table 23: Southwest USA Smart TV Industry Revenue (Million) Forecast, by Application 2019 & 2032
- Table 24: Southwest USA Smart TV Industry Volume (Million) Forecast, by Application 2019 & 2032
- Table 25: West USA Smart TV Industry Revenue (Million) Forecast, by Application 2019 & 2032
- Table 26: West USA Smart TV Industry Volume (Million) Forecast, by Application 2019 & 2032
- Table 27: Global USA Smart TV Industry Revenue Million Forecast, by Screen Size (Diagonal) 2019 & 2032
- Table 28: Global USA Smart TV Industry Volume Million Forecast, by Screen Size (Diagonal) 2019 & 2032
- Table 29: Global USA Smart TV Industry Revenue Million Forecast, by Resolution Type 2019 & 2032
- Table 30: Global USA Smart TV Industry Volume Million Forecast, by Resolution Type 2019 & 2032
- Table 31: Global USA Smart TV Industry Revenue Million Forecast, by Panel Type 2019 & 2032
- Table 32: Global USA Smart TV Industry Volume Million Forecast, by Panel Type 2019 & 2032
- Table 33: Global USA Smart TV Industry Revenue Million Forecast, by Pricing Range 2019 & 2032
- Table 34: Global USA Smart TV Industry Volume Million Forecast, by Pricing Range 2019 & 2032
- Table 35: Global USA Smart TV Industry Revenue Million Forecast, by Operating Segment 2019 & 2032
- Table 36: Global USA Smart TV Industry Volume Million Forecast, by Operating Segment 2019 & 2032
- Table 37: Global USA Smart TV Industry Revenue Million Forecast, by Country 2019 & 2032
- Table 38: Global USA Smart TV Industry Volume Million Forecast, by Country 2019 & 2032
- Table 39: United States USA Smart TV Industry Revenue (Million) Forecast, by Application 2019 & 2032
- Table 40: United States USA Smart TV Industry Volume (Million) Forecast, by Application 2019 & 2032
- Table 41: Canada USA Smart TV Industry Revenue (Million) Forecast, by Application 2019 & 2032
- Table 42: Canada USA Smart TV Industry Volume (Million) Forecast, by Application 2019 & 2032
- Table 43: Mexico USA Smart TV Industry Revenue (Million) Forecast, by Application 2019 & 2032
- Table 44: Mexico USA Smart TV Industry Volume (Million) Forecast, by Application 2019 & 2032
- Table 45: Global USA Smart TV Industry Revenue Million Forecast, by Screen Size (Diagonal) 2019 & 2032
- Table 46: Global USA Smart TV Industry Volume Million Forecast, by Screen Size (Diagonal) 2019 & 2032
- Table 47: Global USA Smart TV Industry Revenue Million Forecast, by Resolution Type 2019 & 2032
- Table 48: Global USA Smart TV Industry Volume Million Forecast, by Resolution Type 2019 & 2032
- Table 49: Global USA Smart TV Industry Revenue Million Forecast, by Panel Type 2019 & 2032
- Table 50: Global USA Smart TV Industry Volume Million Forecast, by Panel Type 2019 & 2032
- Table 51: Global USA Smart TV Industry Revenue Million Forecast, by Pricing Range 2019 & 2032
- Table 52: Global USA Smart TV Industry Volume Million Forecast, by Pricing Range 2019 & 2032
- Table 53: Global USA Smart TV Industry Revenue Million Forecast, by Operating Segment 2019 & 2032
- Table 54: Global USA Smart TV Industry Volume Million Forecast, by Operating Segment 2019 & 2032
- Table 55: Global USA Smart TV Industry Revenue Million Forecast, by Country 2019 & 2032
- Table 56: Global USA Smart TV Industry Volume Million Forecast, by Country 2019 & 2032
- Table 57: Brazil USA Smart TV Industry Revenue (Million) Forecast, by Application 2019 & 2032
- Table 58: Brazil USA Smart TV Industry Volume (Million) Forecast, by Application 2019 & 2032
- Table 59: Argentina USA Smart TV Industry Revenue (Million) Forecast, by Application 2019 & 2032
- Table 60: Argentina USA Smart TV Industry Volume (Million) Forecast, by Application 2019 & 2032
- Table 61: Rest of South America USA Smart TV Industry Revenue (Million) Forecast, by Application 2019 & 2032
- Table 62: Rest of South America USA Smart TV Industry Volume (Million) Forecast, by Application 2019 & 2032
- Table 63: Global USA Smart TV Industry Revenue Million Forecast, by Screen Size (Diagonal) 2019 & 2032
- Table 64: Global USA Smart TV Industry Volume Million Forecast, by Screen Size (Diagonal) 2019 & 2032
- Table 65: Global USA Smart TV Industry Revenue Million Forecast, by Resolution Type 2019 & 2032
- Table 66: Global USA Smart TV Industry Volume Million Forecast, by Resolution Type 2019 & 2032
- Table 67: Global USA Smart TV Industry Revenue Million Forecast, by Panel Type 2019 & 2032
- Table 68: Global USA Smart TV Industry Volume Million Forecast, by Panel Type 2019 & 2032
- Table 69: Global USA Smart TV Industry Revenue Million Forecast, by Pricing Range 2019 & 2032
- Table 70: Global USA Smart TV Industry Volume Million Forecast, by Pricing Range 2019 & 2032
- Table 71: Global USA Smart TV Industry Revenue Million Forecast, by Operating Segment 2019 & 2032
- Table 72: Global USA Smart TV Industry Volume Million Forecast, by Operating Segment 2019 & 2032
- Table 73: Global USA Smart TV Industry Revenue Million Forecast, by Country 2019 & 2032
- Table 74: Global USA Smart TV Industry Volume Million Forecast, by Country 2019 & 2032
- Table 75: United Kingdom USA Smart TV Industry Revenue (Million) Forecast, by Application 2019 & 2032
- Table 76: United Kingdom USA Smart TV Industry Volume (Million) Forecast, by Application 2019 & 2032
- Table 77: Germany USA Smart TV Industry Revenue (Million) Forecast, by Application 2019 & 2032
- Table 78: Germany USA Smart TV Industry Volume (Million) Forecast, by Application 2019 & 2032
- Table 79: France USA Smart TV Industry Revenue (Million) Forecast, by Application 2019 & 2032
- Table 80: France USA Smart TV Industry Volume (Million) Forecast, by Application 2019 & 2032
- Table 81: Italy USA Smart TV Industry Revenue (Million) Forecast, by Application 2019 & 2032
- Table 82: Italy USA Smart TV Industry Volume (Million) Forecast, by Application 2019 & 2032
- Table 83: Spain USA Smart TV Industry Revenue (Million) Forecast, by Application 2019 & 2032
- Table 84: Spain USA Smart TV Industry Volume (Million) Forecast, by Application 2019 & 2032
- Table 85: Russia USA Smart TV Industry Revenue (Million) Forecast, by Application 2019 & 2032
- Table 86: Russia USA Smart TV Industry Volume (Million) Forecast, by Application 2019 & 2032
- Table 87: Benelux USA Smart TV Industry Revenue (Million) Forecast, by Application 2019 & 2032
- Table 88: Benelux USA Smart TV Industry Volume (Million) Forecast, by Application 2019 & 2032
- Table 89: Nordics USA Smart TV Industry Revenue (Million) Forecast, by Application 2019 & 2032
- Table 90: Nordics USA Smart TV Industry Volume (Million) Forecast, by Application 2019 & 2032
- Table 91: Rest of Europe USA Smart TV Industry Revenue (Million) Forecast, by Application 2019 & 2032
- Table 92: Rest of Europe USA Smart TV Industry Volume (Million) Forecast, by Application 2019 & 2032
- Table 93: Global USA Smart TV Industry Revenue Million Forecast, by Screen Size (Diagonal) 2019 & 2032
- Table 94: Global USA Smart TV Industry Volume Million Forecast, by Screen Size (Diagonal) 2019 & 2032
- Table 95: Global USA Smart TV Industry Revenue Million Forecast, by Resolution Type 2019 & 2032
- Table 96: Global USA Smart TV Industry Volume Million Forecast, by Resolution Type 2019 & 2032
- Table 97: Global USA Smart TV Industry Revenue Million Forecast, by Panel Type 2019 & 2032
- Table 98: Global USA Smart TV Industry Volume Million Forecast, by Panel Type 2019 & 2032
- Table 99: Global USA Smart TV Industry Revenue Million Forecast, by Pricing Range 2019 & 2032
- Table 100: Global USA Smart TV Industry Volume Million Forecast, by Pricing Range 2019 & 2032
- Table 101: Global USA Smart TV Industry Revenue Million Forecast, by Operating Segment 2019 & 2032
- Table 102: Global USA Smart TV Industry Volume Million Forecast, by Operating Segment 2019 & 2032
- Table 103: Global USA Smart TV Industry Revenue Million Forecast, by Country 2019 & 2032
- Table 104: Global USA Smart TV Industry Volume Million Forecast, by Country 2019 & 2032
- Table 105: Turkey USA Smart TV Industry Revenue (Million) Forecast, by Application 2019 & 2032
- Table 106: Turkey USA Smart TV Industry Volume (Million) Forecast, by Application 2019 & 2032
- Table 107: Israel USA Smart TV Industry Revenue (Million) Forecast, by Application 2019 & 2032
- Table 108: Israel USA Smart TV Industry Volume (Million) Forecast, by Application 2019 & 2032
- Table 109: GCC USA Smart TV Industry Revenue (Million) Forecast, by Application 2019 & 2032
- Table 110: GCC USA Smart TV Industry Volume (Million) Forecast, by Application 2019 & 2032
- Table 111: North Africa USA Smart TV Industry Revenue (Million) Forecast, by Application 2019 & 2032
- Table 112: North Africa USA Smart TV Industry Volume (Million) Forecast, by Application 2019 & 2032
- Table 113: South Africa USA Smart TV Industry Revenue (Million) Forecast, by Application 2019 & 2032
- Table 114: South Africa USA Smart TV Industry Volume (Million) Forecast, by Application 2019 & 2032
- Table 115: Rest of Middle East & Africa USA Smart TV Industry Revenue (Million) Forecast, by Application 2019 & 2032
- Table 116: Rest of Middle East & Africa USA Smart TV Industry Volume (Million) Forecast, by Application 2019 & 2032
- Table 117: Global USA Smart TV Industry Revenue Million Forecast, by Screen Size (Diagonal) 2019 & 2032
- Table 118: Global USA Smart TV Industry Volume Million Forecast, by Screen Size (Diagonal) 2019 & 2032
- Table 119: Global USA Smart TV Industry Revenue Million Forecast, by Resolution Type 2019 & 2032
- Table 120: Global USA Smart TV Industry Volume Million Forecast, by Resolution Type 2019 & 2032
- Table 121: Global USA Smart TV Industry Revenue Million Forecast, by Panel Type 2019 & 2032
- Table 122: Global USA Smart TV Industry Volume Million Forecast, by Panel Type 2019 & 2032
- Table 123: Global USA Smart TV Industry Revenue Million Forecast, by Pricing Range 2019 & 2032
- Table 124: Global USA Smart TV Industry Volume Million Forecast, by Pricing Range 2019 & 2032
- Table 125: Global USA Smart TV Industry Revenue Million Forecast, by Operating Segment 2019 & 2032
- Table 126: Global USA Smart TV Industry Volume Million Forecast, by Operating Segment 2019 & 2032
- Table 127: Global USA Smart TV Industry Revenue Million Forecast, by Country 2019 & 2032
- Table 128: Global USA Smart TV Industry Volume Million Forecast, by Country 2019 & 2032
- Table 129: China USA Smart TV Industry Revenue (Million) Forecast, by Application 2019 & 2032
- Table 130: China USA Smart TV Industry Volume (Million) Forecast, by Application 2019 & 2032
- Table 131: India USA Smart TV Industry Revenue (Million) Forecast, by Application 2019 & 2032
- Table 132: India USA Smart TV Industry Volume (Million) Forecast, by Application 2019 & 2032
- Table 133: Japan USA Smart TV Industry Revenue (Million) Forecast, by Application 2019 & 2032
- Table 134: Japan USA Smart TV Industry Volume (Million) Forecast, by Application 2019 & 2032
- Table 135: South Korea USA Smart TV Industry Revenue (Million) Forecast, by Application 2019 & 2032
- Table 136: South Korea USA Smart TV Industry Volume (Million) Forecast, by Application 2019 & 2032
- Table 137: ASEAN USA Smart TV Industry Revenue (Million) Forecast, by Application 2019 & 2032
- Table 138: ASEAN USA Smart TV Industry Volume (Million) Forecast, by Application 2019 & 2032
- Table 139: Oceania USA Smart TV Industry Revenue (Million) Forecast, by Application 2019 & 2032
- Table 140: Oceania USA Smart TV Industry Volume (Million) Forecast, by Application 2019 & 2032
- Table 141: Rest of Asia Pacific USA Smart TV Industry Revenue (Million) Forecast, by Application 2019 & 2032
- Table 142: Rest of Asia Pacific USA Smart TV Industry Volume (Million) Forecast, by Application 2019 & 2032
Frequently Asked Questions
1. What is the projected Compound Annual Growth Rate (CAGR) of the USA Smart TV Industry?
The projected CAGR is approximately 1.70%.
2. Which companies are prominent players in the USA Smart TV Industry?
Key companies in the market include LG Electronics Inc, TCL Technology*List Not Exhaustive, Haier Group Corporation, Samsung Electronics Co Ltd, Westinghouse Electric Corporation, Hitachi Ltd, Hisense Group Co Ltd, Insignia Systems Inc, Koninklijke Philips NV, Sharp Corporation, VIZIO Inc, Panasonic Corporation, Sony Corporation.
3. What are the main segments of the USA Smart TV Industry?
The market segments include Screen Size (Diagonal), Resolution Type, Panel Type, Pricing Range, Operating Segment.
4. Can you provide details about the market size?
The market size is estimated to be USD XX Million as of 2022.
5. What are some drivers contributing to market growth?
Growing Disposable Income across Emerging Economies; Rising Trend of Video-on-demand Service.
6. What are the notable trends driving market growth?
Boosting Demand for 55 Inches and above Screen Size.
7. Are there any restraints impacting market growth?
Slower Rate of Penetration of Telematics in Developing Regions; Delayed Regulatory Sanctions.
8. Can you provide examples of recent developments in the market?
April 2022 - Panasonic launched its flagship OLED TV, the LZ2000, in 55-inch, 65-inch, and, for the first time, 77-inch sizes. The LZ2000 is a gaming TV powerhouse with high-quality TV series, new Game Control Board settings, automatic NVIDIA GPU detection, improved 60Hz latency, and HDMI2.1 support.
9. What pricing options are available for accessing the report?
Pricing options include single-user, multi-user, and enterprise licenses priced at USD 3800, USD 4500, and USD 5800 respectively.
10. Is the market size provided in terms of value or volume?
The market size is provided in terms of value, measured in Million and volume, measured in Million.
11. Are there any specific market keywords associated with the report?
Yes, the market keyword associated with the report is "USA Smart TV Industry," which aids in identifying and referencing the specific market segment covered.
12. How do I determine which pricing option suits my needs best?
The pricing options vary based on user requirements and access needs. Individual users may opt for single-user licenses, while businesses requiring broader access may choose multi-user or enterprise licenses for cost-effective access to the report.
13. Are there any additional resources or data provided in the USA Smart TV Industry report?
While the report offers comprehensive insights, it's advisable to review the specific contents or supplementary materials provided to ascertain if additional resources or data are available.
14. How can I stay updated on further developments or reports in the USA Smart TV Industry?
To stay informed about further developments, trends, and reports in the USA Smart TV Industry, consider subscribing to industry newsletters, following relevant companies and organizations, or regularly checking reputable industry news sources and publications.
Methodology
Step 1 - Identification of Relevant Samples Size from Population Database


Step 2 - Approaches for Defining Global Market Size (Value, Volume* & Price*)

Note*: In applicable scenarios
Step 3 - Data Sources
Primary Research
- Web Analytics
- Survey Reports
- Research Institute
- Latest Research Reports
- Opinion Leaders
Secondary Research
- Annual Reports
- White Paper
- Latest Press Release
- Industry Association
- Paid Database
- Investor Presentations

Step 4 - Data Triangulation
Involves using different sources of information in order to increase the validity of a study
These sources are likely to be stakeholders in a program - participants, other researchers, program staff, other community members, and so on.
Then we put all data in single framework & apply various statistical tools to find out the dynamic on the market.
During the analysis stage, feedback from the stakeholder groups would be compared to determine areas of agreement as well as areas of divergence
