

Key Insights
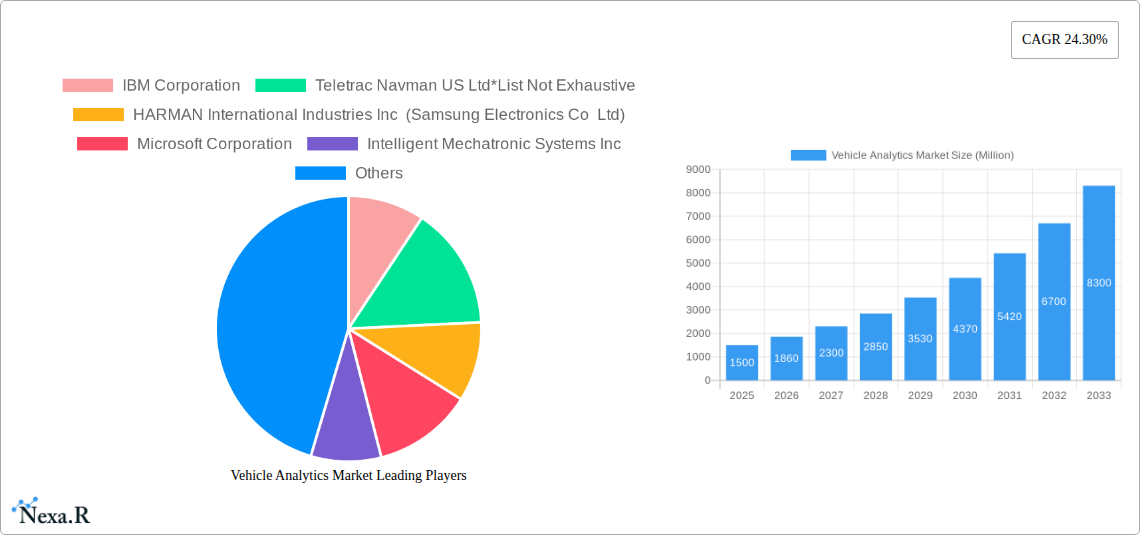
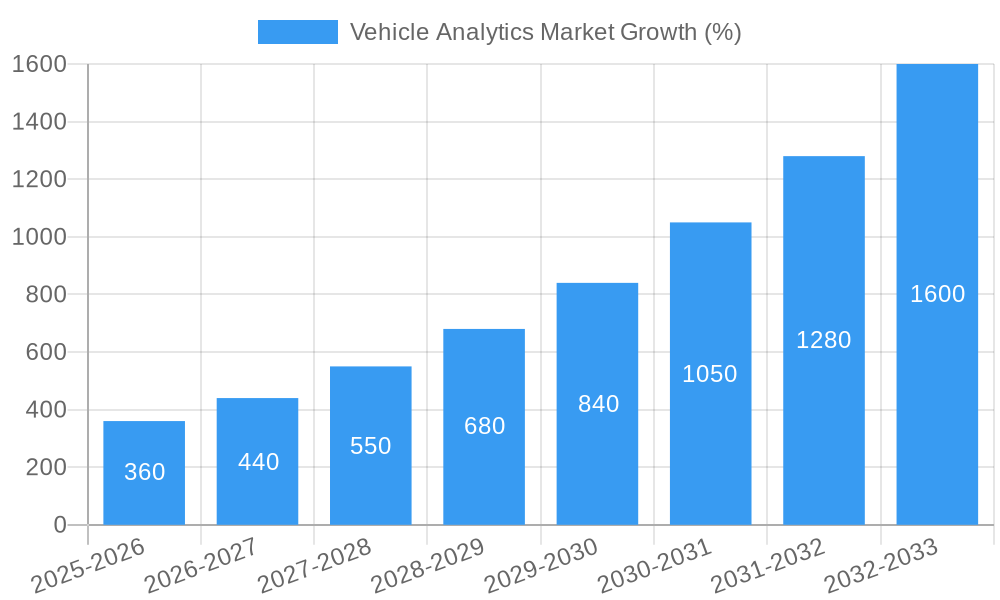
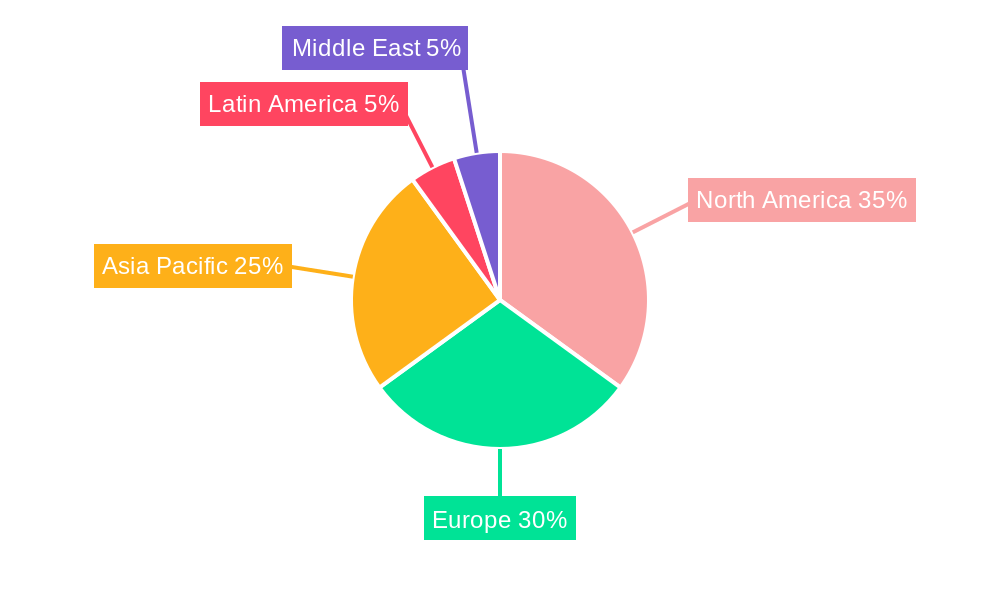
The Vehicle Analytics market is experiencing robust growth, projected to reach a substantial size by 2033. A compound annual growth rate (CAGR) of 24.30% from 2025 to 2033 signifies significant market expansion driven by several key factors. The increasing adoption of connected vehicles, coupled with the escalating demand for enhanced fleet management efficiency and safety, are primary catalysts. Advancements in data analytics technologies, such as AI and machine learning, enable the extraction of valuable insights from vehicle data, leading to improved operational efficiency, reduced fuel consumption, and enhanced driver safety. The market is segmented across deployment (on-premise and cloud), application (predictive maintenance, safety and security, driver performance analysis, and others), and end-user industry (fleet owners, insurers, OEMs, and service providers). The cloud deployment model is expected to witness faster growth due to its scalability and cost-effectiveness. Predictive maintenance applications are gaining traction as businesses seek to minimize downtime and optimize maintenance schedules. North America and Europe currently hold significant market shares, but the Asia-Pacific region is expected to exhibit substantial growth in the coming years, fueled by rapid technological advancements and expanding automotive industries. While data privacy and security concerns present a challenge, the overall market outlook remains overwhelmingly positive, with substantial opportunities for established players and new entrants alike.
The competitive landscape is dynamic, with both established technology giants like IBM, Microsoft, and SAP, and specialized players such as Teletrac Navman and Harman International actively vying for market share. The ongoing development of innovative solutions, strategic partnerships, and mergers and acquisitions will continue to shape the competitive landscape. Future growth will depend on the continued integration of advanced analytics capabilities, the expansion of 5G connectivity, and the increasing adoption of autonomous driving technologies. Addressing concerns around data privacy and ensuring the robust cybersecurity of vehicle data platforms will be crucial for sustained market expansion. The market's growth trajectory indicates a strong potential for investors and stakeholders interested in the future of transportation and data-driven decision-making.
Vehicle Analytics Market: A Comprehensive Report (2019-2033)
This in-depth report provides a comprehensive analysis of the Vehicle Analytics Market, encompassing market dynamics, growth trends, regional dominance, product landscape, key players, and future outlook. The study period spans from 2019 to 2033, with 2025 serving as the base and estimated year. The report segments the market by deployment (on-premise, cloud), application (predictive maintenance, safety & security management, driver performance analysis, other), and end-user industry (fleet owners, insurers, OEMs & service providers, others). This detailed analysis will equip businesses with the insights necessary to navigate the evolving landscape of this rapidly growing market. The market is projected to reach xx Million units by 2033.
Vehicle Analytics Market Market Dynamics & Structure
The Vehicle Analytics Market is characterized by a moderately concentrated landscape with several major players vying for market share. Technological innovation, particularly in areas like AI and IoT, is a significant driver, constantly pushing the boundaries of data analysis and application. Stringent regulatory frameworks concerning data privacy and security, however, pose challenges. The market witnesses continuous product substitution with newer, more efficient, and cost-effective solutions. The end-user demographics are diverse, spanning across fleet owners, insurance companies, and OEMs. Mergers and acquisitions (M&A) activity is moderate, with strategic partnerships also playing a crucial role in market consolidation.
- Market Concentration: Moderately concentrated, with the top 5 players holding approximately xx% market share in 2024.
- Technological Innovation: AI, machine learning, and IoT are major drivers, leading to improved data processing and predictive capabilities.
- Regulatory Framework: Data privacy regulations (e.g., GDPR) significantly impact data collection and usage, creating compliance challenges.
- Competitive Product Substitutes: The emergence of open-source platforms and cloud-based solutions offers cost-effective alternatives to traditional on-premise systems.
- End-User Demographics: Fleet owners are the largest segment, followed by insurers and OEMs, with a growing contribution from other end-user industries.
- M&A Trends: A moderate number of M&A deals are observed annually, mostly driven by strategic acquisitions to expand product portfolios and geographic reach. An estimated xx deals occurred between 2019 and 2024.
Vehicle Analytics Market Growth Trends & Insights
The Vehicle Analytics Market exhibits robust growth, driven by the increasing adoption of connected vehicles, the need for improved fleet management, and the growing demand for enhanced safety and security features. The market size expanded from xx Million units in 2019 to xx Million units in 2024, showcasing a CAGR of xx% during the historical period. The adoption rate of vehicle analytics solutions is accelerating, particularly in developed regions with robust infrastructure and technological advancements. Technological disruptions, such as the rise of 5G and edge computing, are further fueling market growth. Consumer behavior shifts towards safer and more efficient vehicles are also contributing factors. The market is expected to maintain a healthy CAGR of xx% from 2025 to 2033.
Dominant Regions, Countries, or Segments in Vehicle Analytics Market
North America currently holds the largest market share in the vehicle analytics market, followed by Europe. This dominance is primarily attributed to high vehicle ownership rates, well-established technological infrastructure, and the early adoption of advanced vehicle analytics solutions. Within the segments, the cloud deployment model is witnessing the fastest growth, driven by its scalability, cost-effectiveness, and ease of implementation. Predictive maintenance applications lead in terms of market share, reflecting the significant cost savings achieved through proactive maintenance. Fleet owners remain the largest end-user segment due to the substantial operational efficiency gains and safety improvements offered by these solutions.
- Key Drivers for North American Dominance: High vehicle ownership, advanced technological infrastructure, early adoption of analytics solutions, strong government support for smart city initiatives.
- Cloud Deployment Growth Drivers: Scalability, cost-effectiveness, ease of implementation, reduced IT infrastructure requirements.
- Predictive Maintenance Application Dominance: Significant cost savings from proactive maintenance, reduced downtime, and improved operational efficiency.
- Fleet Owner Segment Leadership: Focus on operational efficiency, safety improvements, and fuel optimization.
Vehicle Analytics Market Product Landscape
The vehicle analytics market is witnessing continuous innovation in product offerings, with a focus on integrating advanced technologies such as AI, machine learning, and IoT. Solutions are becoming increasingly sophisticated, offering real-time data analysis, predictive capabilities, and customizable dashboards. Key features include advanced driver-assistance systems (ADAS), telematics solutions, and fleet management platforms. The unique selling propositions often involve data-driven insights leading to cost reductions, improved safety, and enhanced operational efficiency. The market is witnessing increasing integration of solutions with other automotive systems and cloud platforms.
Key Drivers, Barriers & Challenges in Vehicle Analytics Market
Key Drivers:
- Increasing adoption of connected vehicles
- Growing demand for improved fleet management and safety
- Stringent regulatory requirements for vehicle safety and emissions
- Advancement in AI and machine learning for data analytics
Key Challenges & Restraints:
- High initial investment costs for implementation
- Data security and privacy concerns
- Integration complexities with existing systems
- Lack of skilled workforce for data analysis and interpretation
- The potential for xx% decrease in market growth due to supply chain disruptions in 2023 (estimated).
Emerging Opportunities in Vehicle Analytics Market
- Expansion into emerging markets: Developing economies present substantial untapped potential.
- Integration with autonomous driving technologies: Vehicle analytics plays a crucial role in the development and deployment of autonomous driving systems.
- Development of new applications: Opportunities exist in areas such as driver behavior analysis, fuel efficiency optimization, and predictive maintenance for diverse vehicle types.
Growth Accelerators in the Vehicle Analytics Market Industry
Strategic partnerships between technology providers and automotive manufacturers are playing a crucial role in accelerating market growth. The development of open standards and interoperable platforms is promoting wider adoption of vehicle analytics solutions. Technological breakthroughs in AI, IoT, and edge computing will further enhance data processing capabilities and enable the development of more sophisticated applications. Expanding market penetration into diverse vehicle segments, such as commercial vehicles and heavy-duty trucking, will also drive market growth.
Key Players Shaping the Vehicle Analytics Market Market
- IBM Corporation
- Teletrac Navman US Ltd
- HARMAN International Industries Inc (Samsung Electronics Co Ltd)
- Microsoft Corporation
- Intelligent Mechatronic Systems Inc
- Genetec Inc
- Inquiron Ltd
- CloudMade
- SAP SE
Notable Milestones in Vehicle Analytics Market Sector
- October 2022: BMW partnered with Amazon Web Services (AWS) to develop software for collecting and analyzing data from connected vehicles, accelerating software lifecycle management.
- May 2022: Red Hat and General Motors partnered to accelerate the development of software-defined cars, building an innovation ecosystem around Red Hat's In-Vehicle Operating System.
In-Depth Vehicle Analytics Market Market Outlook
The Vehicle Analytics Market is poised for continued robust growth, driven by technological advancements and increasing demand for enhanced safety, efficiency, and connectivity in vehicles. The long-term outlook is positive, with significant opportunities for innovation and market expansion. Strategic partnerships, technological breakthroughs, and expanding market penetration into emerging regions will continue to shape the industry’s trajectory. The market's potential is substantial, presenting attractive investment opportunities for both established players and new entrants.
Vehicle Analytics Market Segmentation
-
1. Deployment
- 1.1. On-premise
- 1.2. Cloud
-
2. Application
- 2.1. Predictive Maintenence
- 2.2. Safety and Security Management
- 2.3. Driver Performance Analysis
- 2.4. Other Applications
-
3. End-user Industry
- 3.1. Fleet Owners
- 3.2. Insurers
- 3.3. OEMs and Service Providers
- 3.4. Other End-user Industries
Vehicle Analytics Market Segmentation By Geography
- 1. North America
- 2. Europe
- 3. Asia
- 4. Australia and New Zealand
- 5. Latin America
- 6. Middle East and Africa
Vehicle Analytics Market REPORT HIGHLIGHTS
| Aspects | Details |
|---|---|
| Study Period | 2019-2033 |
| Base Year | 2024 |
| Estimated Year | 2025 |
| Forecast Period | 2025-2033 |
| Historical Period | 2019-2024 |
| Growth Rate | CAGR of 24.30% from 2019-2033 |
| Segmentation |
|
Table of Contents
- 1. Introduction
- 1.1. Research Scope
- 1.2. Market Segmentation
- 1.3. Research Methodology
- 1.4. Definitions and Assumptions
- 2. Executive Summary
- 2.1. Introduction
- 3. Market Dynamics
- 3.1. Introduction
- 3.2. Market Drivers
- 3.2.1 Growing Adoption Of Vehicle Telematics; Advancements in Technology
- 3.2.2 Such as Artificial Intelligence and Predictive Analytics Leading to Applications in Vehicle Management
- 3.3. Market Restrains
- 3.3.1. High Cost of Solutions Limiting Adoption in High End Cars
- 3.4. Market Trends
- 3.4.1. Predictive Maintenence is Expected to Hold Significant Market Share
- 4. Market Factor Analysis
- 4.1. Porters Five Forces
- 4.2. Supply/Value Chain
- 4.3. PESTEL analysis
- 4.4. Market Entropy
- 4.5. Patent/Trademark Analysis
- 5. Global Vehicle Analytics Market Analysis, Insights and Forecast, 2019-2031
- 5.1. Market Analysis, Insights and Forecast - by Deployment
- 5.1.1. On-premise
- 5.1.2. Cloud
- 5.2. Market Analysis, Insights and Forecast - by Application
- 5.2.1. Predictive Maintenence
- 5.2.2. Safety and Security Management
- 5.2.3. Driver Performance Analysis
- 5.2.4. Other Applications
- 5.3. Market Analysis, Insights and Forecast - by End-user Industry
- 5.3.1. Fleet Owners
- 5.3.2. Insurers
- 5.3.3. OEMs and Service Providers
- 5.3.4. Other End-user Industries
- 5.4. Market Analysis, Insights and Forecast - by Region
- 5.4.1. North America
- 5.4.2. Europe
- 5.4.3. Asia
- 5.4.4. Australia and New Zealand
- 5.4.5. Latin America
- 5.4.6. Middle East and Africa
- 5.1. Market Analysis, Insights and Forecast - by Deployment
- 6. North America Vehicle Analytics Market Analysis, Insights and Forecast, 2019-2031
- 6.1. Market Analysis, Insights and Forecast - by Deployment
- 6.1.1. On-premise
- 6.1.2. Cloud
- 6.2. Market Analysis, Insights and Forecast - by Application
- 6.2.1. Predictive Maintenence
- 6.2.2. Safety and Security Management
- 6.2.3. Driver Performance Analysis
- 6.2.4. Other Applications
- 6.3. Market Analysis, Insights and Forecast - by End-user Industry
- 6.3.1. Fleet Owners
- 6.3.2. Insurers
- 6.3.3. OEMs and Service Providers
- 6.3.4. Other End-user Industries
- 6.1. Market Analysis, Insights and Forecast - by Deployment
- 7. Europe Vehicle Analytics Market Analysis, Insights and Forecast, 2019-2031
- 7.1. Market Analysis, Insights and Forecast - by Deployment
- 7.1.1. On-premise
- 7.1.2. Cloud
- 7.2. Market Analysis, Insights and Forecast - by Application
- 7.2.1. Predictive Maintenence
- 7.2.2. Safety and Security Management
- 7.2.3. Driver Performance Analysis
- 7.2.4. Other Applications
- 7.3. Market Analysis, Insights and Forecast - by End-user Industry
- 7.3.1. Fleet Owners
- 7.3.2. Insurers
- 7.3.3. OEMs and Service Providers
- 7.3.4. Other End-user Industries
- 7.1. Market Analysis, Insights and Forecast - by Deployment
- 8. Asia Vehicle Analytics Market Analysis, Insights and Forecast, 2019-2031
- 8.1. Market Analysis, Insights and Forecast - by Deployment
- 8.1.1. On-premise
- 8.1.2. Cloud
- 8.2. Market Analysis, Insights and Forecast - by Application
- 8.2.1. Predictive Maintenence
- 8.2.2. Safety and Security Management
- 8.2.3. Driver Performance Analysis
- 8.2.4. Other Applications
- 8.3. Market Analysis, Insights and Forecast - by End-user Industry
- 8.3.1. Fleet Owners
- 8.3.2. Insurers
- 8.3.3. OEMs and Service Providers
- 8.3.4. Other End-user Industries
- 8.1. Market Analysis, Insights and Forecast - by Deployment
- 9. Australia and New Zealand Vehicle Analytics Market Analysis, Insights and Forecast, 2019-2031
- 9.1. Market Analysis, Insights and Forecast - by Deployment
- 9.1.1. On-premise
- 9.1.2. Cloud
- 9.2. Market Analysis, Insights and Forecast - by Application
- 9.2.1. Predictive Maintenence
- 9.2.2. Safety and Security Management
- 9.2.3. Driver Performance Analysis
- 9.2.4. Other Applications
- 9.3. Market Analysis, Insights and Forecast - by End-user Industry
- 9.3.1. Fleet Owners
- 9.3.2. Insurers
- 9.3.3. OEMs and Service Providers
- 9.3.4. Other End-user Industries
- 9.1. Market Analysis, Insights and Forecast - by Deployment
- 10. Latin America Vehicle Analytics Market Analysis, Insights and Forecast, 2019-2031
- 10.1. Market Analysis, Insights and Forecast - by Deployment
- 10.1.1. On-premise
- 10.1.2. Cloud
- 10.2. Market Analysis, Insights and Forecast - by Application
- 10.2.1. Predictive Maintenence
- 10.2.2. Safety and Security Management
- 10.2.3. Driver Performance Analysis
- 10.2.4. Other Applications
- 10.3. Market Analysis, Insights and Forecast - by End-user Industry
- 10.3.1. Fleet Owners
- 10.3.2. Insurers
- 10.3.3. OEMs and Service Providers
- 10.3.4. Other End-user Industries
- 10.1. Market Analysis, Insights and Forecast - by Deployment
- 11. Middle East and Africa Vehicle Analytics Market Analysis, Insights and Forecast, 2019-2031
- 11.1. Market Analysis, Insights and Forecast - by Deployment
- 11.1.1. On-premise
- 11.1.2. Cloud
- 11.2. Market Analysis, Insights and Forecast - by Application
- 11.2.1. Predictive Maintenence
- 11.2.2. Safety and Security Management
- 11.2.3. Driver Performance Analysis
- 11.2.4. Other Applications
- 11.3. Market Analysis, Insights and Forecast - by End-user Industry
- 11.3.1. Fleet Owners
- 11.3.2. Insurers
- 11.3.3. OEMs and Service Providers
- 11.3.4. Other End-user Industries
- 11.1. Market Analysis, Insights and Forecast - by Deployment
- 12. North America Vehicle Analytics Market Analysis, Insights and Forecast, 2019-2031
- 12.1. Market Analysis, Insights and Forecast - By Country/Sub-region
- 12.1.1.
- 13. Europe Vehicle Analytics Market Analysis, Insights and Forecast, 2019-2031
- 13.1. Market Analysis, Insights and Forecast - By Country/Sub-region
- 13.1.1.
- 14. Asia Pacific Vehicle Analytics Market Analysis, Insights and Forecast, 2019-2031
- 14.1. Market Analysis, Insights and Forecast - By Country/Sub-region
- 14.1.1.
- 15. Latin America Vehicle Analytics Market Analysis, Insights and Forecast, 2019-2031
- 15.1. Market Analysis, Insights and Forecast - By Country/Sub-region
- 15.1.1.
- 16. Middle East Vehicle Analytics Market Analysis, Insights and Forecast, 2019-2031
- 16.1. Market Analysis, Insights and Forecast - By Country/Sub-region
- 16.1.1.
- 17. Competitive Analysis
- 17.1. Global Market Share Analysis 2024
- 17.2. Company Profiles
- 17.2.1 IBM Corporation
- 17.2.1.1. Overview
- 17.2.1.2. Products
- 17.2.1.3. SWOT Analysis
- 17.2.1.4. Recent Developments
- 17.2.1.5. Financials (Based on Availability)
- 17.2.2 Teletrac Navman US Ltd*List Not Exhaustive
- 17.2.2.1. Overview
- 17.2.2.2. Products
- 17.2.2.3. SWOT Analysis
- 17.2.2.4. Recent Developments
- 17.2.2.5. Financials (Based on Availability)
- 17.2.3 HARMAN International Industries Inc (Samsung Electronics Co Ltd)
- 17.2.3.1. Overview
- 17.2.3.2. Products
- 17.2.3.3. SWOT Analysis
- 17.2.3.4. Recent Developments
- 17.2.3.5. Financials (Based on Availability)
- 17.2.4 Microsoft Corporation
- 17.2.4.1. Overview
- 17.2.4.2. Products
- 17.2.4.3. SWOT Analysis
- 17.2.4.4. Recent Developments
- 17.2.4.5. Financials (Based on Availability)
- 17.2.5 Intelligent Mechatronic Systems Inc
- 17.2.5.1. Overview
- 17.2.5.2. Products
- 17.2.5.3. SWOT Analysis
- 17.2.5.4. Recent Developments
- 17.2.5.5. Financials (Based on Availability)
- 17.2.6 Genetec Inc
- 17.2.6.1. Overview
- 17.2.6.2. Products
- 17.2.6.3. SWOT Analysis
- 17.2.6.4. Recent Developments
- 17.2.6.5. Financials (Based on Availability)
- 17.2.7 Inquiron Ltd
- 17.2.7.1. Overview
- 17.2.7.2. Products
- 17.2.7.3. SWOT Analysis
- 17.2.7.4. Recent Developments
- 17.2.7.5. Financials (Based on Availability)
- 17.2.8 CloudMade
- 17.2.8.1. Overview
- 17.2.8.2. Products
- 17.2.8.3. SWOT Analysis
- 17.2.8.4. Recent Developments
- 17.2.8.5. Financials (Based on Availability)
- 17.2.9 SAP SE
- 17.2.9.1. Overview
- 17.2.9.2. Products
- 17.2.9.3. SWOT Analysis
- 17.2.9.4. Recent Developments
- 17.2.9.5. Financials (Based on Availability)
- 17.2.1 IBM Corporation
List of Figures
- Figure 1: Global Vehicle Analytics Market Revenue Breakdown (Million, %) by Region 2024 & 2032
- Figure 2: North America Vehicle Analytics Market Revenue (Million), by Country 2024 & 2032
- Figure 3: North America Vehicle Analytics Market Revenue Share (%), by Country 2024 & 2032
- Figure 4: Europe Vehicle Analytics Market Revenue (Million), by Country 2024 & 2032
- Figure 5: Europe Vehicle Analytics Market Revenue Share (%), by Country 2024 & 2032
- Figure 6: Asia Pacific Vehicle Analytics Market Revenue (Million), by Country 2024 & 2032
- Figure 7: Asia Pacific Vehicle Analytics Market Revenue Share (%), by Country 2024 & 2032
- Figure 8: Latin America Vehicle Analytics Market Revenue (Million), by Country 2024 & 2032
- Figure 9: Latin America Vehicle Analytics Market Revenue Share (%), by Country 2024 & 2032
- Figure 10: Middle East Vehicle Analytics Market Revenue (Million), by Country 2024 & 2032
- Figure 11: Middle East Vehicle Analytics Market Revenue Share (%), by Country 2024 & 2032
- Figure 12: North America Vehicle Analytics Market Revenue (Million), by Deployment 2024 & 2032
- Figure 13: North America Vehicle Analytics Market Revenue Share (%), by Deployment 2024 & 2032
- Figure 14: North America Vehicle Analytics Market Revenue (Million), by Application 2024 & 2032
- Figure 15: North America Vehicle Analytics Market Revenue Share (%), by Application 2024 & 2032
- Figure 16: North America Vehicle Analytics Market Revenue (Million), by End-user Industry 2024 & 2032
- Figure 17: North America Vehicle Analytics Market Revenue Share (%), by End-user Industry 2024 & 2032
- Figure 18: North America Vehicle Analytics Market Revenue (Million), by Country 2024 & 2032
- Figure 19: North America Vehicle Analytics Market Revenue Share (%), by Country 2024 & 2032
- Figure 20: Europe Vehicle Analytics Market Revenue (Million), by Deployment 2024 & 2032
- Figure 21: Europe Vehicle Analytics Market Revenue Share (%), by Deployment 2024 & 2032
- Figure 22: Europe Vehicle Analytics Market Revenue (Million), by Application 2024 & 2032
- Figure 23: Europe Vehicle Analytics Market Revenue Share (%), by Application 2024 & 2032
- Figure 24: Europe Vehicle Analytics Market Revenue (Million), by End-user Industry 2024 & 2032
- Figure 25: Europe Vehicle Analytics Market Revenue Share (%), by End-user Industry 2024 & 2032
- Figure 26: Europe Vehicle Analytics Market Revenue (Million), by Country 2024 & 2032
- Figure 27: Europe Vehicle Analytics Market Revenue Share (%), by Country 2024 & 2032
- Figure 28: Asia Vehicle Analytics Market Revenue (Million), by Deployment 2024 & 2032
- Figure 29: Asia Vehicle Analytics Market Revenue Share (%), by Deployment 2024 & 2032
- Figure 30: Asia Vehicle Analytics Market Revenue (Million), by Application 2024 & 2032
- Figure 31: Asia Vehicle Analytics Market Revenue Share (%), by Application 2024 & 2032
- Figure 32: Asia Vehicle Analytics Market Revenue (Million), by End-user Industry 2024 & 2032
- Figure 33: Asia Vehicle Analytics Market Revenue Share (%), by End-user Industry 2024 & 2032
- Figure 34: Asia Vehicle Analytics Market Revenue (Million), by Country 2024 & 2032
- Figure 35: Asia Vehicle Analytics Market Revenue Share (%), by Country 2024 & 2032
- Figure 36: Australia and New Zealand Vehicle Analytics Market Revenue (Million), by Deployment 2024 & 2032
- Figure 37: Australia and New Zealand Vehicle Analytics Market Revenue Share (%), by Deployment 2024 & 2032
- Figure 38: Australia and New Zealand Vehicle Analytics Market Revenue (Million), by Application 2024 & 2032
- Figure 39: Australia and New Zealand Vehicle Analytics Market Revenue Share (%), by Application 2024 & 2032
- Figure 40: Australia and New Zealand Vehicle Analytics Market Revenue (Million), by End-user Industry 2024 & 2032
- Figure 41: Australia and New Zealand Vehicle Analytics Market Revenue Share (%), by End-user Industry 2024 & 2032
- Figure 42: Australia and New Zealand Vehicle Analytics Market Revenue (Million), by Country 2024 & 2032
- Figure 43: Australia and New Zealand Vehicle Analytics Market Revenue Share (%), by Country 2024 & 2032
- Figure 44: Latin America Vehicle Analytics Market Revenue (Million), by Deployment 2024 & 2032
- Figure 45: Latin America Vehicle Analytics Market Revenue Share (%), by Deployment 2024 & 2032
- Figure 46: Latin America Vehicle Analytics Market Revenue (Million), by Application 2024 & 2032
- Figure 47: Latin America Vehicle Analytics Market Revenue Share (%), by Application 2024 & 2032
- Figure 48: Latin America Vehicle Analytics Market Revenue (Million), by End-user Industry 2024 & 2032
- Figure 49: Latin America Vehicle Analytics Market Revenue Share (%), by End-user Industry 2024 & 2032
- Figure 50: Latin America Vehicle Analytics Market Revenue (Million), by Country 2024 & 2032
- Figure 51: Latin America Vehicle Analytics Market Revenue Share (%), by Country 2024 & 2032
- Figure 52: Middle East and Africa Vehicle Analytics Market Revenue (Million), by Deployment 2024 & 2032
- Figure 53: Middle East and Africa Vehicle Analytics Market Revenue Share (%), by Deployment 2024 & 2032
- Figure 54: Middle East and Africa Vehicle Analytics Market Revenue (Million), by Application 2024 & 2032
- Figure 55: Middle East and Africa Vehicle Analytics Market Revenue Share (%), by Application 2024 & 2032
- Figure 56: Middle East and Africa Vehicle Analytics Market Revenue (Million), by End-user Industry 2024 & 2032
- Figure 57: Middle East and Africa Vehicle Analytics Market Revenue Share (%), by End-user Industry 2024 & 2032
- Figure 58: Middle East and Africa Vehicle Analytics Market Revenue (Million), by Country 2024 & 2032
- Figure 59: Middle East and Africa Vehicle Analytics Market Revenue Share (%), by Country 2024 & 2032
List of Tables
- Table 1: Global Vehicle Analytics Market Revenue Million Forecast, by Region 2019 & 2032
- Table 2: Global Vehicle Analytics Market Revenue Million Forecast, by Deployment 2019 & 2032
- Table 3: Global Vehicle Analytics Market Revenue Million Forecast, by Application 2019 & 2032
- Table 4: Global Vehicle Analytics Market Revenue Million Forecast, by End-user Industry 2019 & 2032
- Table 5: Global Vehicle Analytics Market Revenue Million Forecast, by Region 2019 & 2032
- Table 6: Global Vehicle Analytics Market Revenue Million Forecast, by Country 2019 & 2032
- Table 7: Vehicle Analytics Market Revenue (Million) Forecast, by Application 2019 & 2032
- Table 8: Global Vehicle Analytics Market Revenue Million Forecast, by Country 2019 & 2032
- Table 9: Vehicle Analytics Market Revenue (Million) Forecast, by Application 2019 & 2032
- Table 10: Global Vehicle Analytics Market Revenue Million Forecast, by Country 2019 & 2032
- Table 11: Vehicle Analytics Market Revenue (Million) Forecast, by Application 2019 & 2032
- Table 12: Global Vehicle Analytics Market Revenue Million Forecast, by Country 2019 & 2032
- Table 13: Vehicle Analytics Market Revenue (Million) Forecast, by Application 2019 & 2032
- Table 14: Global Vehicle Analytics Market Revenue Million Forecast, by Country 2019 & 2032
- Table 15: Vehicle Analytics Market Revenue (Million) Forecast, by Application 2019 & 2032
- Table 16: Global Vehicle Analytics Market Revenue Million Forecast, by Deployment 2019 & 2032
- Table 17: Global Vehicle Analytics Market Revenue Million Forecast, by Application 2019 & 2032
- Table 18: Global Vehicle Analytics Market Revenue Million Forecast, by End-user Industry 2019 & 2032
- Table 19: Global Vehicle Analytics Market Revenue Million Forecast, by Country 2019 & 2032
- Table 20: Global Vehicle Analytics Market Revenue Million Forecast, by Deployment 2019 & 2032
- Table 21: Global Vehicle Analytics Market Revenue Million Forecast, by Application 2019 & 2032
- Table 22: Global Vehicle Analytics Market Revenue Million Forecast, by End-user Industry 2019 & 2032
- Table 23: Global Vehicle Analytics Market Revenue Million Forecast, by Country 2019 & 2032
- Table 24: Global Vehicle Analytics Market Revenue Million Forecast, by Deployment 2019 & 2032
- Table 25: Global Vehicle Analytics Market Revenue Million Forecast, by Application 2019 & 2032
- Table 26: Global Vehicle Analytics Market Revenue Million Forecast, by End-user Industry 2019 & 2032
- Table 27: Global Vehicle Analytics Market Revenue Million Forecast, by Country 2019 & 2032
- Table 28: Global Vehicle Analytics Market Revenue Million Forecast, by Deployment 2019 & 2032
- Table 29: Global Vehicle Analytics Market Revenue Million Forecast, by Application 2019 & 2032
- Table 30: Global Vehicle Analytics Market Revenue Million Forecast, by End-user Industry 2019 & 2032
- Table 31: Global Vehicle Analytics Market Revenue Million Forecast, by Country 2019 & 2032
- Table 32: Global Vehicle Analytics Market Revenue Million Forecast, by Deployment 2019 & 2032
- Table 33: Global Vehicle Analytics Market Revenue Million Forecast, by Application 2019 & 2032
- Table 34: Global Vehicle Analytics Market Revenue Million Forecast, by End-user Industry 2019 & 2032
- Table 35: Global Vehicle Analytics Market Revenue Million Forecast, by Country 2019 & 2032
- Table 36: Global Vehicle Analytics Market Revenue Million Forecast, by Deployment 2019 & 2032
- Table 37: Global Vehicle Analytics Market Revenue Million Forecast, by Application 2019 & 2032
- Table 38: Global Vehicle Analytics Market Revenue Million Forecast, by End-user Industry 2019 & 2032
- Table 39: Global Vehicle Analytics Market Revenue Million Forecast, by Country 2019 & 2032
Frequently Asked Questions
1. What is the projected Compound Annual Growth Rate (CAGR) of the Vehicle Analytics Market?
The projected CAGR is approximately 24.30%.
2. Which companies are prominent players in the Vehicle Analytics Market?
Key companies in the market include IBM Corporation, Teletrac Navman US Ltd*List Not Exhaustive, HARMAN International Industries Inc (Samsung Electronics Co Ltd), Microsoft Corporation, Intelligent Mechatronic Systems Inc, Genetec Inc, Inquiron Ltd, CloudMade, SAP SE.
3. What are the main segments of the Vehicle Analytics Market?
The market segments include Deployment, Application, End-user Industry.
4. Can you provide details about the market size?
The market size is estimated to be USD XX Million as of 2022.
5. What are some drivers contributing to market growth?
Growing Adoption Of Vehicle Telematics; Advancements in Technology. Such as Artificial Intelligence and Predictive Analytics Leading to Applications in Vehicle Management.
6. What are the notable trends driving market growth?
Predictive Maintenence is Expected to Hold Significant Market Share.
7. Are there any restraints impacting market growth?
High Cost of Solutions Limiting Adoption in High End Cars.
8. Can you provide examples of recent developments in the market?
October 2022: BMW partnered with Amazon Web Services (AWS) to develop software that would collect and analyze data generated by connected vehicles. The data collection would expedite the development of features to enhance software life cycle management.
9. What pricing options are available for accessing the report?
Pricing options include single-user, multi-user, and enterprise licenses priced at USD 4750, USD 5250, and USD 8750 respectively.
10. Is the market size provided in terms of value or volume?
The market size is provided in terms of value, measured in Million.
11. Are there any specific market keywords associated with the report?
Yes, the market keyword associated with the report is "Vehicle Analytics Market," which aids in identifying and referencing the specific market segment covered.
12. How do I determine which pricing option suits my needs best?
The pricing options vary based on user requirements and access needs. Individual users may opt for single-user licenses, while businesses requiring broader access may choose multi-user or enterprise licenses for cost-effective access to the report.
13. Are there any additional resources or data provided in the Vehicle Analytics Market report?
While the report offers comprehensive insights, it's advisable to review the specific contents or supplementary materials provided to ascertain if additional resources or data are available.
14. How can I stay updated on further developments or reports in the Vehicle Analytics Market?
To stay informed about further developments, trends, and reports in the Vehicle Analytics Market, consider subscribing to industry newsletters, following relevant companies and organizations, or regularly checking reputable industry news sources and publications.
Methodology
Step 1 - Identification of Relevant Samples Size from Population Database


Step 2 - Approaches for Defining Global Market Size (Value, Volume* & Price*)

Note*: In applicable scenarios
Step 3 - Data Sources
Primary Research
- Web Analytics
- Survey Reports
- Research Institute
- Latest Research Reports
- Opinion Leaders
Secondary Research
- Annual Reports
- White Paper
- Latest Press Release
- Industry Association
- Paid Database
- Investor Presentations

Step 4 - Data Triangulation
Involves using different sources of information in order to increase the validity of a study
These sources are likely to be stakeholders in a program - participants, other researchers, program staff, other community members, and so on.
Then we put all data in single framework & apply various statistical tools to find out the dynamic on the market.
During the analysis stage, feedback from the stakeholder groups would be compared to determine areas of agreement as well as areas of divergence
