

Key Insights
The global veterinary scales market is projected to reach $279.96 million by 2025, with a Compound Annual Growth Rate (CAGR) of 4.85% from 2025 to 2033. This growth is propelled by an expanding global pet population, increasing pet humanization, and rising veterinary healthcare expenditures. The demand for precise and reliable measurement devices is intensifying due to advancements in veterinary diagnostics and treatment. Key market drivers include a greater focus on preventative care and the proliferation of veterinary clinics and hospitals. The market is segmented by configuration (platform, bench-top, portable) and technology (electronic scales dominate due to accuracy and usability). Applications are categorized into large and small animals, with specialized and research settings also included.
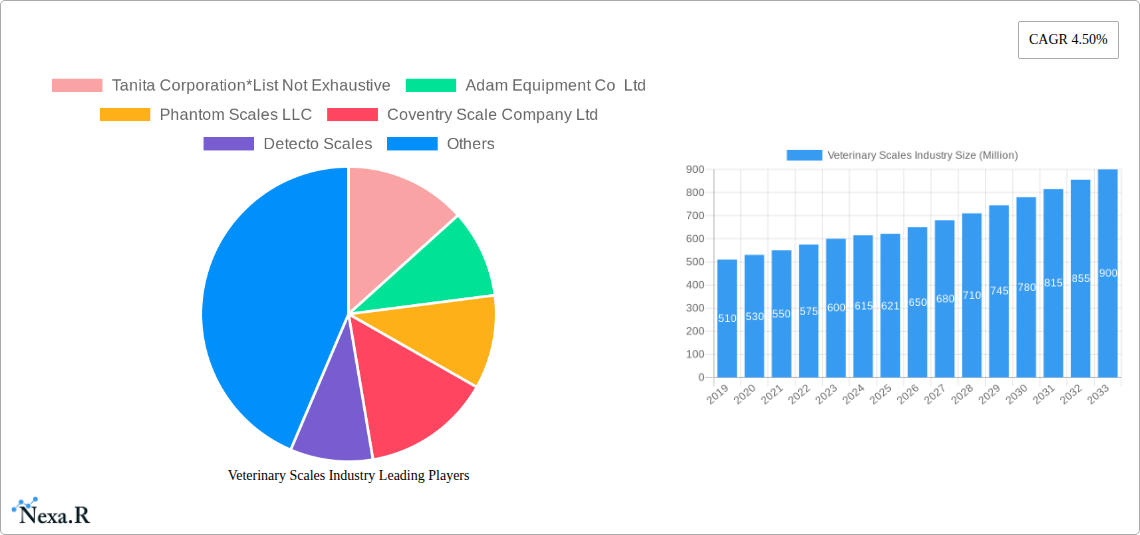
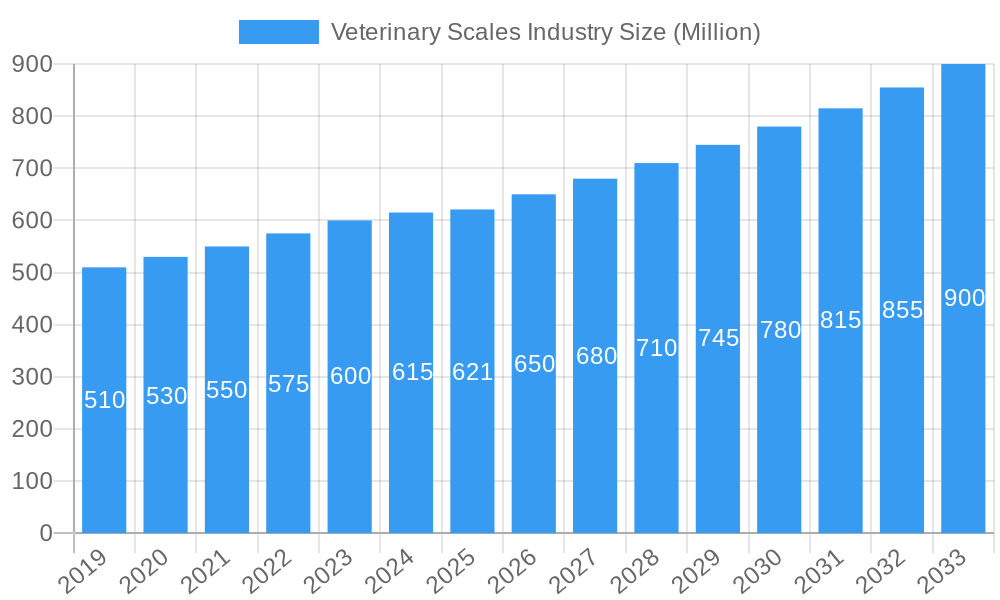
Veterinary Scales Industry Market Size (In Million)
The competitive landscape is characterized by innovation, strategic collaborations, and market expansion efforts from established and emerging companies. Manufacturers are developing scales with advanced features such as electronic health record connectivity, enhanced portability, and species-specific designs. Evolving animal welfare and veterinary practice regulations further stimulate the adoption of accurate weighing solutions. Geographically, North America and Europe lead the market, supported by robust veterinary infrastructure and high pet ownership. The Asia Pacific region is anticipated to experience the most rapid expansion, driven by rising disposable incomes, a flourishing pet care industry, and heightened awareness of animal health. Market challenges include the initial investment for advanced scales and the availability of more affordable alternatives in certain developing economies.
Veterinary Scales Industry Company Market Share
This comprehensive report analyzes the global veterinary scales industry, covering historical performance, current market dynamics, and future growth prospects. Optimized for search engines with keywords such as "veterinary scales," "animal weighing scales," "pet scales," "livestock scales," and "veterinary diagnostic equipment," this research provides crucial insights for industry stakeholders. The analysis offers a detailed examination of market segments, identifying key opportunities and challenges. All data is presented in millions for clear strategic decision-making.
Veterinary Scales Industry Market Dynamics & Structure
The global Veterinary Scales Industry is characterized by a moderately concentrated market, driven by increasing pet ownership, a growing focus on animal health and welfare, and the expansion of veterinary services worldwide. Technological innovation, particularly in precision weighing and digital integration, is a significant driver, enabling more accurate diagnostics and treatment planning. Regulatory frameworks related to animal safety and device standards also influence market entry and product development. Competitive product substitutes, such as manual measurement techniques and less advanced weighing solutions, exist but are increasingly being displaced by sophisticated electronic veterinary scales. End-user demographics are shifting, with a rise in demand for scales suitable for a wider range of animal sizes and species, from small companion animals to large livestock. Mergers and acquisitions (M&A) trends, while not as prevalent as in broader healthcare sectors, are indicative of strategic consolidation and expansion by key players aiming to enhance their product portfolios and market reach. The market is projected to witness xx M&A deals in the forecast period, with an estimated value of $xx Million. Key innovation barriers include high R&D costs for specialized veterinary applications and the need for robust calibration and validation processes.
- Market Concentration: Moderately concentrated, with a few key global players holding significant market share.
- Technological Innovation Drivers: Precision weighing, IoT integration for data management, mobile compatibility, and multi-species weighing capabilities.
- Regulatory Frameworks: Adherence to international and national standards for medical devices, animal welfare, and data privacy.
- Competitive Product Substitutes: Manual measurement methods, traditional weighing systems, and less advanced scales.
- End-User Demographics: Growing demand from veterinary clinics, animal hospitals, research institutions, farms, and pet owners.
- M&A Trends: Strategic acquisitions to expand product lines and geographical presence; estimated xx M&A deals valued at $xx Million in the forecast period.
Veterinary Scales Industry Growth Trends & Insights
The Veterinary Scales Industry is poised for robust growth, projected to expand significantly from its current market size of $xxx Million in 2025. This expansion is driven by a confluence of factors, including the escalating global expenditure on pet healthcare, an increasing awareness of preventative animal care, and the continuous advancement of veterinary medicine. The adoption rates for digital and smart veterinary scales are accelerating, as veterinarians recognize the benefits of accurate weight monitoring for disease management, dosage calculation, and overall animal well-being. Technological disruptions are playing a crucial role, with the integration of features like built-in data logging, connectivity to practice management software, and specialized weighing platforms for different animal types. Consumer behavior shifts are also contributing, with pet owners increasingly seeking professional veterinary services and demanding higher quality care for their animals. This translates into greater demand for precise and reliable diagnostic tools, including veterinary scales.
The market penetration of advanced veterinary scales is expected to rise, driven by their ability to provide objective health metrics. The CAGR for the Veterinary Scales Industry is estimated to be xx% during the forecast period of 2025–2033. The historical period from 2019–2024 saw a steady growth of xx% annually, laying a strong foundation for future expansion. The increasing emphasis on the human-animal bond fuels investment in companion animal health, directly impacting the demand for high-quality veterinary scales. Furthermore, the growing importance of livestock management in ensuring food security and optimizing agricultural productivity is a significant driver for the livestock scales segment. Technological advancements such as the development of ultra-lightweight and portable scales for mobile veterinary units and field use are expanding the market's reach. The shift towards remote patient monitoring and the increasing use of AI in veterinary diagnostics will further necessitate accurate and integrated weighing solutions. The market size for veterinary scales is projected to reach $xxx Million by 2033.
Dominant Regions, Countries, or Segments in Veterinary Scales Industry
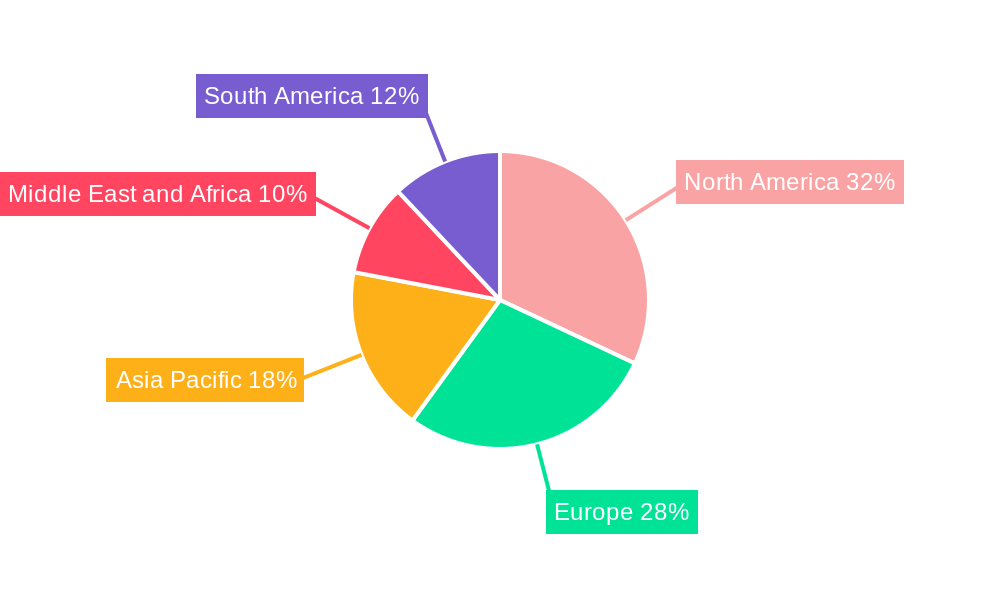
North America currently stands as the dominant region in the Veterinary Scales Industry, driven by its well-established veterinary healthcare infrastructure, high pet ownership rates, and substantial disposable income allocated to pet care. The United States, in particular, represents a significant market due to the presence of numerous veterinary clinics, animal hospitals, and a growing number of specialized animal care facilities. The Electronic technology segment is overwhelmingly dominant across all applications, owing to its precision, ease of use, and integration capabilities. Within the Configuration segment, Platform veterinary scales are highly sought after for their versatility in weighing larger animals and their stability for smaller pets, contributing significantly to regional market share.
The Application segment of Small Animals is experiencing exponential growth, fueled by the booming companion animal market. This surge in demand for pet-specific weighing solutions, from diagnostic scales in clinics to home pet scales, is a primary growth engine. However, the Large Animals segment, encompassing livestock and equine weighing, also holds substantial market value, particularly in agricultural economies within North America and Europe. Key drivers for dominance in this region include strong economic policies supporting animal health research and development, advanced healthcare infrastructure, and a proactive approach to adopting new technologies.
Europe follows closely behind North America, with countries like Germany, the United Kingdom, and France exhibiting strong demand for veterinary scales. The emphasis on animal welfare regulations and the robust presence of veterinary research institutions in Europe contribute to market growth. In Asia-Pacific, countries like China and India are emerging as rapidly growing markets, propelled by increasing pet ownership, rising disposable incomes, and a developing veterinary infrastructure. The Bench-top configuration, while smaller in market share compared to platform scales, is crucial for specialized applications in laboratories and diagnostic settings. The ongoing development of smart and connected veterinary scales is expected to further boost the market penetration of the Electronic technology segment globally, as practitioners seek data-driven insights into animal health. The combined market share of these dominant regions is estimated at xx% of the global Veterinary Scales Industry.
Veterinary Scales Industry Product Landscape
The veterinary scales market is continuously evolving with innovative product designs tailored for specific animal needs. Advanced electronic scales now offer features such as integrated data logging, connectivity to electronic health records (EHRs), and Wi-Fi capabilities for seamless data transfer. These include ultra-precise scales for small animal dosages, robust platform scales capable of handling large livestock with high weight capacities, and portable, battery-operated units for mobile veterinary services. Developments also focus on user-friendly interfaces, easy-to-clean surfaces, and durable construction suitable for demanding veterinary environments. Unique selling propositions often revolve around enhanced accuracy, specialized animal restraint features on platforms, and software integration for comprehensive health monitoring. Technological advancements are leading to scales with built-in diagnostic capabilities beyond simple weight measurement.
Key Drivers, Barriers & Challenges in Veterinary Scales Industry
The Veterinary Scales Industry is propelled by several key drivers, including the rising global demand for animal healthcare services, the increasing trend of pet humanization, and advancements in veterinary diagnostic technologies. The growing emphasis on precise medication dosages and nutritional management for both companion animals and livestock also fuels the need for accurate weighing solutions. Furthermore, government initiatives promoting animal welfare and public health are indirectly supporting market growth.
Conversely, the industry faces barriers and challenges such as the high cost of advanced veterinary scales, which can be a restraint for smaller veterinary practices or in developing economies. Supply chain disruptions, as witnessed in recent global events, can impact manufacturing and distribution. Stringent regulatory approval processes for new medical devices and the need for continuous compliance add to operational complexities. Intense competition from established players and emerging manufacturers also poses a challenge, necessitating constant innovation and competitive pricing strategies. The overall impact of these challenges on market growth is estimated at -xx% annually.
Emerging Opportunities in Veterinary Scales Industry
Emerging opportunities in the Veterinary Scales Industry lie in the development of smart, connected scales integrated with AI-powered diagnostic platforms, enabling predictive health insights. The burgeoning pet wellness market presents a significant opportunity for home-use veterinary scales with features like body composition analysis. Untapped markets in developing regions with growing pet ownership and livestock industries offer substantial expansion potential. Innovative applications such as specialized scales for exotics, rehabilitation, and research purposes also represent niche growth areas. Evolving consumer preferences for technologically advanced and convenient pet care solutions will continue to drive demand for sophisticated veterinary weighing equipment.
Growth Accelerators in the Veterinary Scales Industry Industry
Several growth accelerators are set to propel the Veterinary Scales Industry forward. Technological breakthroughs in sensor technology and wireless connectivity are enabling the development of more accurate, portable, and data-rich veterinary scales. Strategic partnerships between veterinary scale manufacturers and veterinary software providers are creating integrated ecosystems that enhance practice efficiency and animal care. Market expansion strategies targeting emerging economies, where pet ownership and livestock farming are on the rise, present significant growth opportunities. The increasing investment in veterinary research and development, coupled with a growing awareness of the importance of accurate weight tracking for animal health management, will act as further catalysts for sustained growth in the coming years.
Key Players Shaping the Veterinary Scales Industry Market
- Tanita Corporation
- Adam Equipment Co Ltd
- Phantom Scales LLC
- Coventry Scale Company Ltd
- Detecto Scales
- Bosche GmbH & Co KG
- Soehnle Industrial Solutions GmbH
- Brecknell
- apexx Veterinary Equipment Inc
Notable Milestones in Veterinary Scales Industry Sector
- 2019: Introduction of advanced Bluetooth-enabled veterinary scales for remote data access.
- 2020: Launch of specialized, ultra-low profile scales designed for avian and exotic animals.
- 2021: Increased adoption of cloud-based data management systems for veterinary scales, enhancing analytics.
- 2022: Development of antimicrobial coatings for veterinary scales, improving hygiene in clinical settings.
- 2023: Integration of AI algorithms into veterinary scales for basic health trend analysis.
- 2024: Rollout of highly durable, wash-down capable scales for large animal facilities.
In-Depth Veterinary Scales Industry Market Outlook
The Veterinary Scales Industry is projected for sustained and robust growth, driven by the increasing commodification of pet care and the critical role of accurate weight monitoring in animal health management. Future market potential lies in the continued innovation of smart scales that offer comprehensive health insights, moving beyond simple weight measurements. Strategic opportunities include deeper integration with veterinary practice management software and the expansion of home-use pet wellness scales. The industry will likely see a rise in customizable solutions for specialized veterinary needs and a greater focus on sustainable manufacturing practices. This outlook signifies a dynamic and expanding market for veterinary scale manufacturers and suppliers.
Veterinary Scales Industry Segmentation
-
1. Configuration
- 1.1. Platform
- 1.2. Bench-top
- 1.3. Portable
-
2. Technology
- 2.1. Electronic
- 2.2. Mechanical
-
3. Application
- 3.1. Large Animals
- 3.2. Small Animals
- 3.3. Others
Veterinary Scales Industry Segmentation By Geography
-
1. North America
- 1.1. United States
- 1.2. Canada
- 1.3. Mexico
-
2. Europe
- 2.1. Germany
- 2.2. United Kingdom
- 2.3. France
- 2.4. Italy
- 2.5. Spain
- 2.6. Rest of Europe
-
3. Asia Pacific
- 3.1. China
- 3.2. Japan
- 3.3. India
- 3.4. Australia
- 3.5. South Korea
- 3.6. Rest of Asia Pacific
-
4. Middle East and Africa
- 4.1. GCC
- 4.2. South Africa
- 4.3. Rest of Middle East and Africa
-
5. South America
- 5.1. Brazil
- 5.2. Argentina
- 5.3. Rest of South America
Veterinary Scales Industry Regional Market Share
Geographic Coverage of Veterinary Scales Industry
Veterinary Scales Industry REPORT HIGHLIGHTS
| Aspects | Details |
|---|---|
| Study Period | 2020-2034 |
| Base Year | 2025 |
| Estimated Year | 2026 |
| Forecast Period | 2026-2034 |
| Historical Period | 2020-2025 |
| Growth Rate | CAGR of 4.85% from 2020-2034 |
| Segmentation |
|
Table of Contents
- 1. Introduction
- 1.1. Research Scope
- 1.2. Market Segmentation
- 1.3. Research Objective
- 1.4. Definitions and Assumptions
- 2. Executive Summary
- 2.1. Market Snapshot
- 3. Market Dynamics
- 3.1. Market Drivers
- 3.2. Market Restrains
- 3.3. Market Trends
- 3.4. Market Opportunities
- 4. Market Factor Analysis
- 4.1. Porters Five Forces
- 4.1.1. Bargaining Power of Suppliers
- 4.1.2. Bargaining Power of Buyers
- 4.1.3. Threat of New Entrants
- 4.1.4. Threat of Substitutes
- 4.1.5. Competitive Rivalry
- 4.2. PESTEL analysis
- 4.3. BCG Analysis
- 4.3.1. Stars (High Growth, High Market Share)
- 4.3.2. Cash Cows (Low Growth, High Market Share)
- 4.3.3. Question Mark (High Growth, Low Market Share)
- 4.3.4. Dogs (Low Growth, Low Market Share)
- 4.4. Ansoff Matrix Analysis
- 4.5. Supply Chain Analysis
- 4.6. Regulatory Landscape
- 4.7. Current Market Potential and Opportunity Assessment (TAM–SAM–SOM Framework)
- 4.8. NRP Analyst Note
- 4.1. Porters Five Forces
- 5. Market Analysis, Insights and Forecast 2021-2033
- 5.1. Market Analysis, Insights and Forecast - by Configuration
- 5.1.1. Platform
- 5.1.2. Bench-top
- 5.1.3. Portable
- 5.2. Market Analysis, Insights and Forecast - by Technology
- 5.2.1. Electronic
- 5.2.2. Mechanical
- 5.3. Market Analysis, Insights and Forecast - by Application
- 5.3.1. Large Animals
- 5.3.2. Small Animals
- 5.3.3. Others
- 5.4. Market Analysis, Insights and Forecast - by Region
- 5.4.1. North America
- 5.4.2. Europe
- 5.4.3. Asia Pacific
- 5.4.4. Middle East and Africa
- 5.4.5. South America
- 5.1. Market Analysis, Insights and Forecast - by Configuration
- 6. Global Veterinary Scales Industry Analysis, Insights and Forecast, 2021-2033
- 6.1. Market Analysis, Insights and Forecast - by Configuration
- 6.1.1. Platform
- 6.1.2. Bench-top
- 6.1.3. Portable
- 6.2. Market Analysis, Insights and Forecast - by Technology
- 6.2.1. Electronic
- 6.2.2. Mechanical
- 6.3. Market Analysis, Insights and Forecast - by Application
- 6.3.1. Large Animals
- 6.3.2. Small Animals
- 6.3.3. Others
- 6.1. Market Analysis, Insights and Forecast - by Configuration
- 7. North America Veterinary Scales Industry Analysis, Insights and Forecast, 2020-2032
- 7.1. Market Analysis, Insights and Forecast - by Configuration
- 7.1.1. Platform
- 7.1.2. Bench-top
- 7.1.3. Portable
- 7.2. Market Analysis, Insights and Forecast - by Technology
- 7.2.1. Electronic
- 7.2.2. Mechanical
- 7.3. Market Analysis, Insights and Forecast - by Application
- 7.3.1. Large Animals
- 7.3.2. Small Animals
- 7.3.3. Others
- 7.1. Market Analysis, Insights and Forecast - by Configuration
- 8. Europe Veterinary Scales Industry Analysis, Insights and Forecast, 2020-2032
- 8.1. Market Analysis, Insights and Forecast - by Configuration
- 8.1.1. Platform
- 8.1.2. Bench-top
- 8.1.3. Portable
- 8.2. Market Analysis, Insights and Forecast - by Technology
- 8.2.1. Electronic
- 8.2.2. Mechanical
- 8.3. Market Analysis, Insights and Forecast - by Application
- 8.3.1. Large Animals
- 8.3.2. Small Animals
- 8.3.3. Others
- 8.1. Market Analysis, Insights and Forecast - by Configuration
- 9. Asia Pacific Veterinary Scales Industry Analysis, Insights and Forecast, 2020-2032
- 9.1. Market Analysis, Insights and Forecast - by Configuration
- 9.1.1. Platform
- 9.1.2. Bench-top
- 9.1.3. Portable
- 9.2. Market Analysis, Insights and Forecast - by Technology
- 9.2.1. Electronic
- 9.2.2. Mechanical
- 9.3. Market Analysis, Insights and Forecast - by Application
- 9.3.1. Large Animals
- 9.3.2. Small Animals
- 9.3.3. Others
- 9.1. Market Analysis, Insights and Forecast - by Configuration
- 10. Middle East and Africa Veterinary Scales Industry Analysis, Insights and Forecast, 2020-2032
- 10.1. Market Analysis, Insights and Forecast - by Configuration
- 10.1.1. Platform
- 10.1.2. Bench-top
- 10.1.3. Portable
- 10.2. Market Analysis, Insights and Forecast - by Technology
- 10.2.1. Electronic
- 10.2.2. Mechanical
- 10.3. Market Analysis, Insights and Forecast - by Application
- 10.3.1. Large Animals
- 10.3.2. Small Animals
- 10.3.3. Others
- 10.1. Market Analysis, Insights and Forecast - by Configuration
- 11. South America Veterinary Scales Industry Analysis, Insights and Forecast, 2020-2032
- 11.1. Market Analysis, Insights and Forecast - by Configuration
- 11.1.1. Platform
- 11.1.2. Bench-top
- 11.1.3. Portable
- 11.2. Market Analysis, Insights and Forecast - by Technology
- 11.2.1. Electronic
- 11.2.2. Mechanical
- 11.3. Market Analysis, Insights and Forecast - by Application
- 11.3.1. Large Animals
- 11.3.2. Small Animals
- 11.3.3. Others
- 11.1. Market Analysis, Insights and Forecast - by Configuration
- 12. Competitive Analysis
- 12.1. Company Profiles
- 12.1.1 Tanita Corporation*List Not Exhaustive
- 12.1.1.1. Company Overview
- 12.1.1.2. Products
- 12.1.1.3. Company Financials
- 12.1.1.4. SWOT Analysis
- 12.1.2 Adam Equipment Co Ltd
- 12.1.2.1. Company Overview
- 12.1.2.2. Products
- 12.1.2.3. Company Financials
- 12.1.2.4. SWOT Analysis
- 12.1.3 Phantom Scales LLC
- 12.1.3.1. Company Overview
- 12.1.3.2. Products
- 12.1.3.3. Company Financials
- 12.1.3.4. SWOT Analysis
- 12.1.4 Coventry Scale Company Ltd
- 12.1.4.1. Company Overview
- 12.1.4.2. Products
- 12.1.4.3. Company Financials
- 12.1.4.4. SWOT Analysis
- 12.1.5 Detecto Scales
- 12.1.5.1. Company Overview
- 12.1.5.2. Products
- 12.1.5.3. Company Financials
- 12.1.5.4. SWOT Analysis
- 12.1.6 Bosche GmbH & Co KG
- 12.1.6.1. Company Overview
- 12.1.6.2. Products
- 12.1.6.3. Company Financials
- 12.1.6.4. SWOT Analysis
- 12.1.7 Soehnle Industrial Solutions GmbH
- 12.1.7.1. Company Overview
- 12.1.7.2. Products
- 12.1.7.3. Company Financials
- 12.1.7.4. SWOT Analysis
- 12.1.8 Brecknell
- 12.1.8.1. Company Overview
- 12.1.8.2. Products
- 12.1.8.3. Company Financials
- 12.1.8.4. SWOT Analysis
- 12.1.9 apexx Veterinary Equipment Inc
- 12.1.9.1. Company Overview
- 12.1.9.2. Products
- 12.1.9.3. Company Financials
- 12.1.9.4. SWOT Analysis
- 12.1.1 Tanita Corporation*List Not Exhaustive
- 12.2. Market Entropy
- 12.2.1 Company's Key Areas Served
- 12.2.2 Recent Developments
- 12.3. Company Market Share Analysis 2025
- 12.3.1 Top 5 Companies Market Share Analysis
- 12.3.2 Top 3 Companies Market Share Analysis
- 12.4. List of Potential Customers
- 13. Research Methodology
List of Figures
- Figure 1: Global Veterinary Scales Industry Revenue Breakdown (million, %) by Region 2025 & 2033
- Figure 2: North America Veterinary Scales Industry Revenue (million), by Configuration 2025 & 2033
- Figure 3: North America Veterinary Scales Industry Revenue Share (%), by Configuration 2025 & 2033
- Figure 4: North America Veterinary Scales Industry Revenue (million), by Technology 2025 & 2033
- Figure 5: North America Veterinary Scales Industry Revenue Share (%), by Technology 2025 & 2033
- Figure 6: North America Veterinary Scales Industry Revenue (million), by Application 2025 & 2033
- Figure 7: North America Veterinary Scales Industry Revenue Share (%), by Application 2025 & 2033
- Figure 8: North America Veterinary Scales Industry Revenue (million), by Country 2025 & 2033
- Figure 9: North America Veterinary Scales Industry Revenue Share (%), by Country 2025 & 2033
- Figure 10: Europe Veterinary Scales Industry Revenue (million), by Configuration 2025 & 2033
- Figure 11: Europe Veterinary Scales Industry Revenue Share (%), by Configuration 2025 & 2033
- Figure 12: Europe Veterinary Scales Industry Revenue (million), by Technology 2025 & 2033
- Figure 13: Europe Veterinary Scales Industry Revenue Share (%), by Technology 2025 & 2033
- Figure 14: Europe Veterinary Scales Industry Revenue (million), by Application 2025 & 2033
- Figure 15: Europe Veterinary Scales Industry Revenue Share (%), by Application 2025 & 2033
- Figure 16: Europe Veterinary Scales Industry Revenue (million), by Country 2025 & 2033
- Figure 17: Europe Veterinary Scales Industry Revenue Share (%), by Country 2025 & 2033
- Figure 18: Asia Pacific Veterinary Scales Industry Revenue (million), by Configuration 2025 & 2033
- Figure 19: Asia Pacific Veterinary Scales Industry Revenue Share (%), by Configuration 2025 & 2033
- Figure 20: Asia Pacific Veterinary Scales Industry Revenue (million), by Technology 2025 & 2033
- Figure 21: Asia Pacific Veterinary Scales Industry Revenue Share (%), by Technology 2025 & 2033
- Figure 22: Asia Pacific Veterinary Scales Industry Revenue (million), by Application 2025 & 2033
- Figure 23: Asia Pacific Veterinary Scales Industry Revenue Share (%), by Application 2025 & 2033
- Figure 24: Asia Pacific Veterinary Scales Industry Revenue (million), by Country 2025 & 2033
- Figure 25: Asia Pacific Veterinary Scales Industry Revenue Share (%), by Country 2025 & 2033
- Figure 26: Middle East and Africa Veterinary Scales Industry Revenue (million), by Configuration 2025 & 2033
- Figure 27: Middle East and Africa Veterinary Scales Industry Revenue Share (%), by Configuration 2025 & 2033
- Figure 28: Middle East and Africa Veterinary Scales Industry Revenue (million), by Technology 2025 & 2033
- Figure 29: Middle East and Africa Veterinary Scales Industry Revenue Share (%), by Technology 2025 & 2033
- Figure 30: Middle East and Africa Veterinary Scales Industry Revenue (million), by Application 2025 & 2033
- Figure 31: Middle East and Africa Veterinary Scales Industry Revenue Share (%), by Application 2025 & 2033
- Figure 32: Middle East and Africa Veterinary Scales Industry Revenue (million), by Country 2025 & 2033
- Figure 33: Middle East and Africa Veterinary Scales Industry Revenue Share (%), by Country 2025 & 2033
- Figure 34: South America Veterinary Scales Industry Revenue (million), by Configuration 2025 & 2033
- Figure 35: South America Veterinary Scales Industry Revenue Share (%), by Configuration 2025 & 2033
- Figure 36: South America Veterinary Scales Industry Revenue (million), by Technology 2025 & 2033
- Figure 37: South America Veterinary Scales Industry Revenue Share (%), by Technology 2025 & 2033
- Figure 38: South America Veterinary Scales Industry Revenue (million), by Application 2025 & 2033
- Figure 39: South America Veterinary Scales Industry Revenue Share (%), by Application 2025 & 2033
- Figure 40: South America Veterinary Scales Industry Revenue (million), by Country 2025 & 2033
- Figure 41: South America Veterinary Scales Industry Revenue Share (%), by Country 2025 & 2033
List of Tables
- Table 1: Global Veterinary Scales Industry Revenue million Forecast, by Configuration 2020 & 2033
- Table 2: Global Veterinary Scales Industry Revenue million Forecast, by Technology 2020 & 2033
- Table 3: Global Veterinary Scales Industry Revenue million Forecast, by Application 2020 & 2033
- Table 4: Global Veterinary Scales Industry Revenue million Forecast, by Region 2020 & 2033
- Table 5: Global Veterinary Scales Industry Revenue million Forecast, by Configuration 2020 & 2033
- Table 6: Global Veterinary Scales Industry Revenue million Forecast, by Technology 2020 & 2033
- Table 7: Global Veterinary Scales Industry Revenue million Forecast, by Application 2020 & 2033
- Table 8: Global Veterinary Scales Industry Revenue million Forecast, by Country 2020 & 2033
- Table 9: United States Veterinary Scales Industry Revenue (million) Forecast, by Application 2020 & 2033
- Table 10: Canada Veterinary Scales Industry Revenue (million) Forecast, by Application 2020 & 2033
- Table 11: Mexico Veterinary Scales Industry Revenue (million) Forecast, by Application 2020 & 2033
- Table 12: Global Veterinary Scales Industry Revenue million Forecast, by Configuration 2020 & 2033
- Table 13: Global Veterinary Scales Industry Revenue million Forecast, by Technology 2020 & 2033
- Table 14: Global Veterinary Scales Industry Revenue million Forecast, by Application 2020 & 2033
- Table 15: Global Veterinary Scales Industry Revenue million Forecast, by Country 2020 & 2033
- Table 16: Germany Veterinary Scales Industry Revenue (million) Forecast, by Application 2020 & 2033
- Table 17: United Kingdom Veterinary Scales Industry Revenue (million) Forecast, by Application 2020 & 2033
- Table 18: France Veterinary Scales Industry Revenue (million) Forecast, by Application 2020 & 2033
- Table 19: Italy Veterinary Scales Industry Revenue (million) Forecast, by Application 2020 & 2033
- Table 20: Spain Veterinary Scales Industry Revenue (million) Forecast, by Application 2020 & 2033
- Table 21: Rest of Europe Veterinary Scales Industry Revenue (million) Forecast, by Application 2020 & 2033
- Table 22: Global Veterinary Scales Industry Revenue million Forecast, by Configuration 2020 & 2033
- Table 23: Global Veterinary Scales Industry Revenue million Forecast, by Technology 2020 & 2033
- Table 24: Global Veterinary Scales Industry Revenue million Forecast, by Application 2020 & 2033
- Table 25: Global Veterinary Scales Industry Revenue million Forecast, by Country 2020 & 2033
- Table 26: China Veterinary Scales Industry Revenue (million) Forecast, by Application 2020 & 2033
- Table 27: Japan Veterinary Scales Industry Revenue (million) Forecast, by Application 2020 & 2033
- Table 28: India Veterinary Scales Industry Revenue (million) Forecast, by Application 2020 & 2033
- Table 29: Australia Veterinary Scales Industry Revenue (million) Forecast, by Application 2020 & 2033
- Table 30: South Korea Veterinary Scales Industry Revenue (million) Forecast, by Application 2020 & 2033
- Table 31: Rest of Asia Pacific Veterinary Scales Industry Revenue (million) Forecast, by Application 2020 & 2033
- Table 32: Global Veterinary Scales Industry Revenue million Forecast, by Configuration 2020 & 2033
- Table 33: Global Veterinary Scales Industry Revenue million Forecast, by Technology 2020 & 2033
- Table 34: Global Veterinary Scales Industry Revenue million Forecast, by Application 2020 & 2033
- Table 35: Global Veterinary Scales Industry Revenue million Forecast, by Country 2020 & 2033
- Table 36: GCC Veterinary Scales Industry Revenue (million) Forecast, by Application 2020 & 2033
- Table 37: South Africa Veterinary Scales Industry Revenue (million) Forecast, by Application 2020 & 2033
- Table 38: Rest of Middle East and Africa Veterinary Scales Industry Revenue (million) Forecast, by Application 2020 & 2033
- Table 39: Global Veterinary Scales Industry Revenue million Forecast, by Configuration 2020 & 2033
- Table 40: Global Veterinary Scales Industry Revenue million Forecast, by Technology 2020 & 2033
- Table 41: Global Veterinary Scales Industry Revenue million Forecast, by Application 2020 & 2033
- Table 42: Global Veterinary Scales Industry Revenue million Forecast, by Country 2020 & 2033
- Table 43: Brazil Veterinary Scales Industry Revenue (million) Forecast, by Application 2020 & 2033
- Table 44: Argentina Veterinary Scales Industry Revenue (million) Forecast, by Application 2020 & 2033
- Table 45: Rest of South America Veterinary Scales Industry Revenue (million) Forecast, by Application 2020 & 2033
Frequently Asked Questions
1. What is the projected Compound Annual Growth Rate (CAGR) of the Veterinary Scales Industry?
The projected CAGR is approximately 4.85%.
2. Which companies are prominent players in the Veterinary Scales Industry?
Key companies in the market include Tanita Corporation*List Not Exhaustive, Adam Equipment Co Ltd, Phantom Scales LLC, Coventry Scale Company Ltd, Detecto Scales, Bosche GmbH & Co KG, Soehnle Industrial Solutions GmbH, Brecknell, apexx Veterinary Equipment Inc.
3. What are the main segments of the Veterinary Scales Industry?
The market segments include Configuration, Technology, Application.
4. Can you provide details about the market size?
The market size is estimated to be USD 279.96 million as of 2022.
5. What are some drivers contributing to market growth?
; Rise in Awareness about Animal Health Examination; Growth in Demand of Weight-Based Diet and Drug Dosing; Product Innovation and Competitive Pricing.
6. What are the notable trends driving market growth?
Electronic Segment is Expected to Show Better Growth in the Forecast Years.
7. Are there any restraints impacting market growth?
; Lack of Precision and Unresponsiveness.
8. Can you provide examples of recent developments in the market?
N/A
9. What pricing options are available for accessing the report?
Pricing options include single-user, multi-user, and enterprise licenses priced at USD 4750, USD 5250, and USD 8750 respectively.
10. Is the market size provided in terms of value or volume?
The market size is provided in terms of value, measured in million.
11. Are there any specific market keywords associated with the report?
Yes, the market keyword associated with the report is "Veterinary Scales Industry," which aids in identifying and referencing the specific market segment covered.
12. How do I determine which pricing option suits my needs best?
The pricing options vary based on user requirements and access needs. Individual users may opt for single-user licenses, while businesses requiring broader access may choose multi-user or enterprise licenses for cost-effective access to the report.
13. Are there any additional resources or data provided in the Veterinary Scales Industry report?
While the report offers comprehensive insights, it's advisable to review the specific contents or supplementary materials provided to ascertain if additional resources or data are available.
14. How can I stay updated on further developments or reports in the Veterinary Scales Industry?
To stay informed about further developments, trends, and reports in the Veterinary Scales Industry, consider subscribing to industry newsletters, following relevant companies and organizations, or regularly checking reputable industry news sources and publications.
Methodology
Step 1 - Identification of Relevant Samples Size from Population Database


Step 2 - Approaches for Defining Global Market Size (Value, Volume* & Price*)

Note*: In applicable scenarios
Step 3 - Data Sources
Primary Research
- Web Analytics
- Survey Reports
- Research Institute
- Latest Research Reports
- Opinion Leaders
Secondary Research
- Annual Reports
- White Paper
- Latest Press Release
- Industry Association
- Paid Database
- Investor Presentations

Step 4 - Data Triangulation
Involves using different sources of information in order to increase the validity of a study
These sources are likely to be stakeholders in a program - participants, other researchers, program staff, other community members, and so on.
Then we put all data in single framework & apply various statistical tools to find out the dynamic on the market.
During the analysis stage, feedback from the stakeholder groups would be compared to determine areas of agreement as well as areas of divergence