

Key Insights
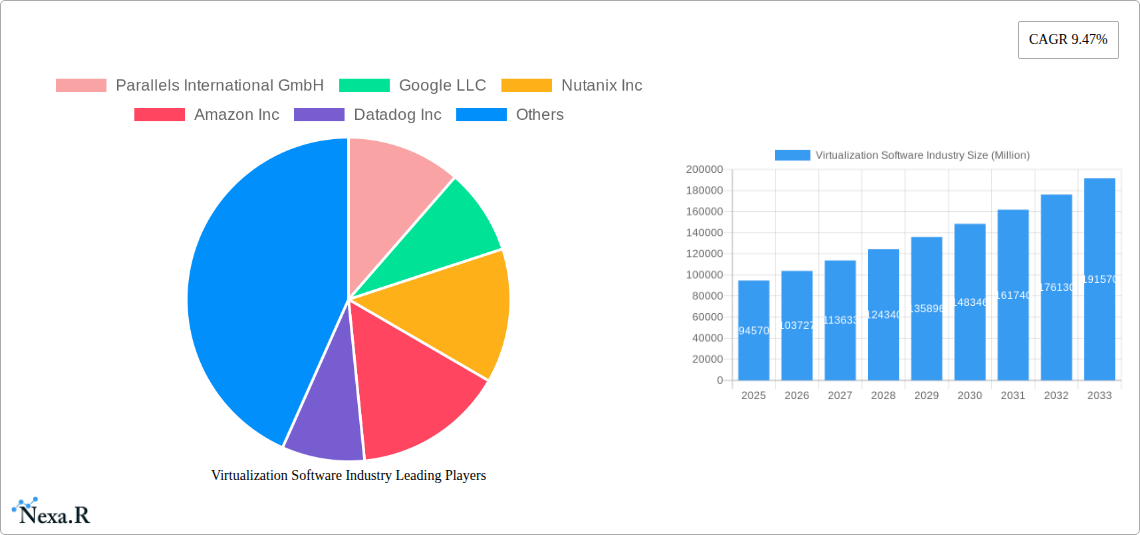
The virtualization software market, currently valued at $94.57 billion in 2025, is projected to experience robust growth, driven by the increasing adoption of cloud computing, the rise of big data analytics requiring efficient resource management, and the expanding need for enhanced data security and disaster recovery solutions. The market's Compound Annual Growth Rate (CAGR) of 9.47% from 2025 to 2033 signifies a considerable expansion, fueled by the continuous evolution of virtualization technologies catering to diverse platforms and application needs. Key segments within the market include PC virtualization, mobile virtualization, application virtualization, network virtualization, and hardware virtualization. The competitive landscape is populated by major players such as VMware, Citrix, Microsoft, Amazon, and Google, alongside several other significant contributors, indicating a healthy level of innovation and competition within the industry. Further growth drivers include the increasing demand for streamlined IT infrastructure management and reduced operational costs associated with virtualization solutions.
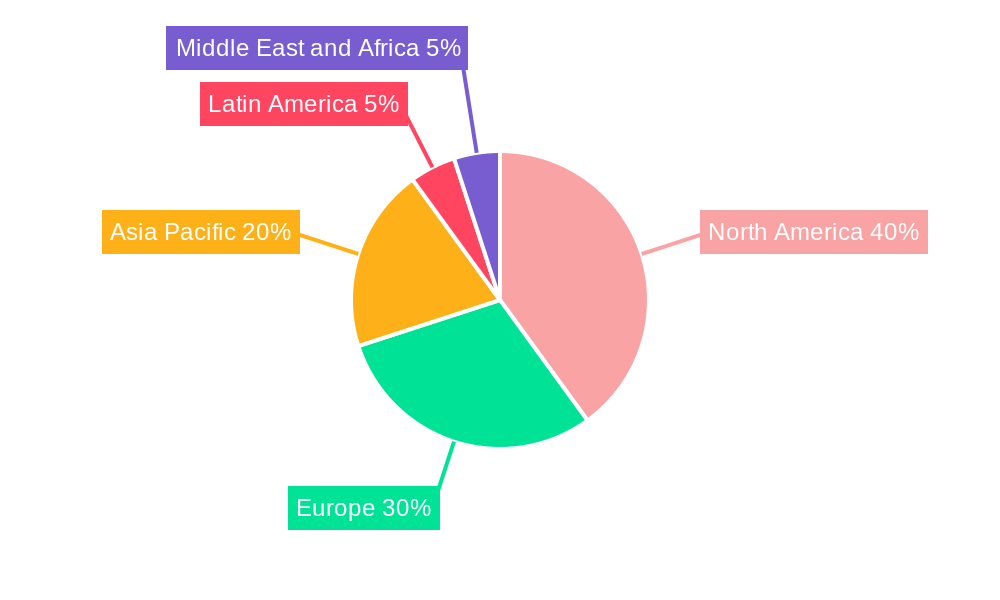
The growth trajectory of the virtualization software market is further shaped by several key trends. These include the increasing adoption of containerization technologies, the growing demand for hybrid and multi-cloud environments, and the rise of edge computing necessitating efficient resource management at the network edge. While certain restraints such as security concerns related to virtualized environments and the complexity of implementing virtualization solutions exist, the overall market outlook remains overwhelmingly positive. The continued development of advanced virtualization technologies, coupled with rising digital transformation initiatives across various industries, will likely mitigate these challenges and solidify the market's long-term growth prospects. Regional analysis suggests a strong presence across North America and Europe, with Asia Pacific showing significant potential for future expansion. The market is anticipated to surpass $200 billion by 2033, driven by the factors outlined above.
Virtualization Software Industry Market Report: 2019-2033
This comprehensive report provides a detailed analysis of the Virtualization Software industry, encompassing market dynamics, growth trends, regional segmentation, product landscape, and key players. The study period covers 2019-2033, with a focus on the base year 2025 and a forecast period of 2025-2033. The report is designed for industry professionals, investors, and researchers seeking in-depth insights into this rapidly evolving market. The total market size is projected to reach xx Million units by 2033.
Virtualization Software Industry Market Dynamics & Structure
The virtualization software market is characterized by a moderately concentrated landscape with several dominant players and numerous niche competitors. Market concentration is influenced by factors such as technological innovation, regulatory frameworks, and the availability of competitive substitutes. The market exhibits significant M&A activity, driven by the need to expand product portfolios, enhance technological capabilities, and access new customer segments.
- Market Concentration: The top 5 players hold an estimated xx% market share in 2025, while the remaining xx% is fragmented across numerous smaller vendors.
- Technological Innovation Drivers: Continuous advancements in cloud computing, AI, and 5G are driving innovation in virtualization technologies. This includes improvements in performance, scalability, and security features.
- Regulatory Frameworks: Government regulations concerning data privacy and security are shaping the market landscape, influencing product development and deployment strategies.
- Competitive Product Substitutes: Containerization technologies pose a significant competitive threat to traditional virtualization solutions. The adoption of serverless computing and cloud-native architectures are emerging alternatives.
- End-User Demographics: The primary end-users are enterprises across diverse sectors (IT, finance, healthcare, etc.) that adopt virtualization for various applications, such as server consolidation, application delivery, and disaster recovery.
- M&A Trends: The number of M&A deals in the virtualization software market has averaged xx per year during the historical period (2019-2024), with larger companies acquiring smaller firms to gain access to specialized technologies or expand their market reach. Consolidation is expected to accelerate in the forecast period.
Virtualization Software Industry Growth Trends & Insights
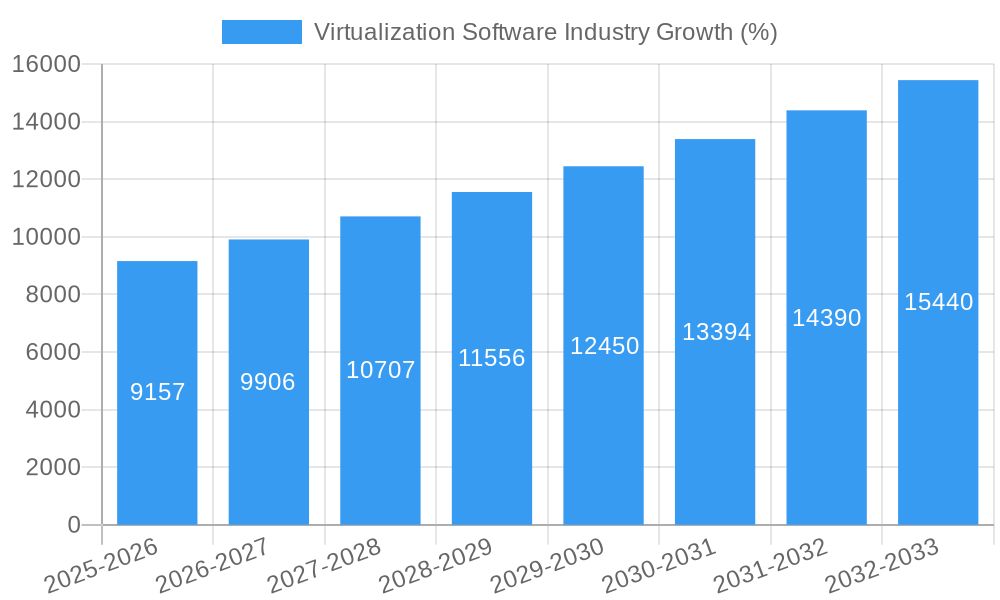
The virtualization software market has witnessed substantial growth during the historical period (2019-2024), driven by increasing adoption of cloud computing, big data analytics, and the rise of the digital economy. The market size expanded from xx Million units in 2019 to xx Million units in 2024. The CAGR for the historical period is estimated at xx%. This growth is expected to continue, with a projected CAGR of xx% during the forecast period (2025-2033). Market penetration is also increasing, particularly in developing economies where digital transformation initiatives are accelerating. Technological disruptions, such as the rise of serverless computing, present both opportunities and challenges, requiring vendors to adapt their strategies. Consumer behavior shifts towards cloud-based solutions are further propelling market growth. The increase in remote work has also increased the demand for virtualization technologies.
Dominant Regions, Countries, or Segments in Virtualization Software Industry
North America currently holds the largest market share in the virtualization software market, driven by high technology adoption rates, strong IT infrastructure, and a significant presence of major technology vendors. Within the segments, PC virtualization remains the largest by platform, however, mobile virtualization is experiencing the fastest growth due to the expanding mobile workforce. In terms of type, application virtualization is a significant market segment due to its wide range of applications.
- Key Drivers: Strong IT infrastructure, high digital adoption rates, supportive government policies promoting technological innovation, robust economic growth in developed nations.
- Dominance Factors: High technological maturity, early adoption of virtualization technologies, strong presence of key players, substantial investments in R&D.
- Growth Potential: While North America maintains market dominance, regions such as Asia-Pacific and EMEA are poised for significant growth due to expanding IT spending and rising digitalization initiatives. Specifically, countries like China and India exhibit substantial growth potential for virtualization software.
Virtualization Software Industry Product Landscape
Virtualization software products are increasingly incorporating advanced features, such as enhanced security, scalability, and management capabilities. The focus is shifting toward integrated solutions that address diverse business needs and seamlessly integrate with existing IT infrastructure. Products are also becoming more user-friendly, facilitating wider adoption across various organizational levels. The integration of AI and machine learning is leading to automated management and improved performance optimization.
Key Drivers, Barriers & Challenges in Virtualization Software Industry
Key Drivers: Increasing demand for cloud computing, rising adoption of DevOps methodologies, growing need for data center consolidation, increased demand for business continuity and disaster recovery solutions. The shift towards hybrid and multi-cloud environments is also a major driver.
Key Challenges & Restraints: High initial investment costs, complexity of implementation, security concerns related to virtualized environments, skill gap in managing virtualization technologies. The increasing competition from open-source and cloud-based solutions adds pressure on margins and market share. Supply chain disruptions can impact the availability of hardware components, impacting deployment timelines. Data sovereignty regulations vary by region, affecting implementation plans and strategic choices. These challenges and restraints are projected to impact growth by approximately xx% during the forecast period.
Emerging Opportunities in Virtualization Software Industry
The emergence of edge computing presents significant opportunities, enabling the deployment of virtualized applications closer to data sources. The increasing adoption of IoT devices and the growth of the metaverse will drive further demand for specialized virtualization solutions. New applications in sectors like healthcare, finance, and manufacturing will open up untapped markets. The development of virtualization solutions specifically addressing the needs of specific industries will contribute to further growth.
Growth Accelerators in the Virtualization Software Industry
Technological breakthroughs, particularly in areas like AI-powered automation, improved security protocols, and enhanced performance optimization, will serve as strong growth catalysts. Strategic partnerships and collaborations among major technology vendors, aiming for integrated solutions and wider market reach, will drive accelerated growth. The expansion of virtualization solutions into newer market segments and geographic regions, especially in emerging economies, will foster considerable growth.
Key Players Shaping the Virtualization Software Industry Market
- Parallels International GmbH
- Google LLC
- Nutanix Inc
- Amazon Inc
- Datadog Inc
- Microsoft Corporation
- TenAsys Corporation
- NComupting Co Ltd
- Red Hat Inc (IBM Corporation)
- Lynx Software Technologies
- Huawei Technologies Co Ltd
- Oracle Corporation
- VMware Inc
- Citrix Systems Inc
Notable Milestones in Virtualization Software Industry Sector
- October 2022: Microsoft and Meta's collaboration to bring Mesh for Microsoft Teams to Meta Quest devices, enhancing virtual collaboration capabilities.
- August 2022: NetApp and VMware's strengthened partnership to support multi-cloud modernization, simplifying virtual machine and container management.
In-Depth Virtualization Software Industry Market Outlook
The future of the virtualization software market is bright, with continued growth driven by the factors outlined above. Strategic investments in R&D, focusing on innovation in areas such as AI, edge computing, and enhanced security, will be critical for sustained success. Companies that successfully adapt to the evolving technological landscape and changing customer needs will capture significant market share. The development of innovative solutions catering to specific industry needs and regional markets presents compelling growth opportunities. The global market is set to experience a sustained growth trajectory, with the total market value exceeding xx Million units by 2033.
Virtualization Software Industry Segmentation
-
1. Platform
- 1.1. PC Virtualization
- 1.2. Mobile Virtualization
-
2. Type
- 2.1. Application Virtualization
- 2.2. Network Virtualization
- 2.3. Hardware Virtualization
- 2.4. Other Types
Virtualization Software Industry Segmentation By Geography
- 1. North America
- 2. Europe
- 3. Asia
- 4. Australia and New Zealand
- 5. Latin America
- 6. Middle East and Africa
Virtualization Software Industry REPORT HIGHLIGHTS
| Aspects | Details |
|---|---|
| Study Period | 2019-2033 |
| Base Year | 2024 |
| Estimated Year | 2025 |
| Forecast Period | 2025-2033 |
| Historical Period | 2019-2024 |
| Growth Rate | CAGR of 9.47% from 2019-2033 |
| Segmentation |
|
Table of Contents
- 1. Introduction
- 1.1. Research Scope
- 1.2. Market Segmentation
- 1.3. Research Methodology
- 1.4. Definitions and Assumptions
- 2. Executive Summary
- 2.1. Introduction
- 3. Market Dynamics
- 3.1. Introduction
- 3.2. Market Drivers
- 3.2.1. Cost Reductions due to Reduced Hardware Spending; Improved IT Efficiency due to Virtualization
- 3.3. Market Restrains
- 3.3.1. High Initial Investment During the Deployment in the Infrastructure
- 3.4. Market Trends
- 3.4.1. PC/ Desktop Virtualization is expected to hold Major Market share
- 4. Market Factor Analysis
- 4.1. Porters Five Forces
- 4.2. Supply/Value Chain
- 4.3. PESTEL analysis
- 4.4. Market Entropy
- 4.5. Patent/Trademark Analysis
- 5. Global Virtualization Software Industry Analysis, Insights and Forecast, 2019-2031
- 5.1. Market Analysis, Insights and Forecast - by Platform
- 5.1.1. PC Virtualization
- 5.1.2. Mobile Virtualization
- 5.2. Market Analysis, Insights and Forecast - by Type
- 5.2.1. Application Virtualization
- 5.2.2. Network Virtualization
- 5.2.3. Hardware Virtualization
- 5.2.4. Other Types
- 5.3. Market Analysis, Insights and Forecast - by Region
- 5.3.1. North America
- 5.3.2. Europe
- 5.3.3. Asia
- 5.3.4. Australia and New Zealand
- 5.3.5. Latin America
- 5.3.6. Middle East and Africa
- 5.1. Market Analysis, Insights and Forecast - by Platform
- 6. North America Virtualization Software Industry Analysis, Insights and Forecast, 2019-2031
- 6.1. Market Analysis, Insights and Forecast - by Platform
- 6.1.1. PC Virtualization
- 6.1.2. Mobile Virtualization
- 6.2. Market Analysis, Insights and Forecast - by Type
- 6.2.1. Application Virtualization
- 6.2.2. Network Virtualization
- 6.2.3. Hardware Virtualization
- 6.2.4. Other Types
- 6.1. Market Analysis, Insights and Forecast - by Platform
- 7. Europe Virtualization Software Industry Analysis, Insights and Forecast, 2019-2031
- 7.1. Market Analysis, Insights and Forecast - by Platform
- 7.1.1. PC Virtualization
- 7.1.2. Mobile Virtualization
- 7.2. Market Analysis, Insights and Forecast - by Type
- 7.2.1. Application Virtualization
- 7.2.2. Network Virtualization
- 7.2.3. Hardware Virtualization
- 7.2.4. Other Types
- 7.1. Market Analysis, Insights and Forecast - by Platform
- 8. Asia Virtualization Software Industry Analysis, Insights and Forecast, 2019-2031
- 8.1. Market Analysis, Insights and Forecast - by Platform
- 8.1.1. PC Virtualization
- 8.1.2. Mobile Virtualization
- 8.2. Market Analysis, Insights and Forecast - by Type
- 8.2.1. Application Virtualization
- 8.2.2. Network Virtualization
- 8.2.3. Hardware Virtualization
- 8.2.4. Other Types
- 8.1. Market Analysis, Insights and Forecast - by Platform
- 9. Australia and New Zealand Virtualization Software Industry Analysis, Insights and Forecast, 2019-2031
- 9.1. Market Analysis, Insights and Forecast - by Platform
- 9.1.1. PC Virtualization
- 9.1.2. Mobile Virtualization
- 9.2. Market Analysis, Insights and Forecast - by Type
- 9.2.1. Application Virtualization
- 9.2.2. Network Virtualization
- 9.2.3. Hardware Virtualization
- 9.2.4. Other Types
- 9.1. Market Analysis, Insights and Forecast - by Platform
- 10. Latin America Virtualization Software Industry Analysis, Insights and Forecast, 2019-2031
- 10.1. Market Analysis, Insights and Forecast - by Platform
- 10.1.1. PC Virtualization
- 10.1.2. Mobile Virtualization
- 10.2. Market Analysis, Insights and Forecast - by Type
- 10.2.1. Application Virtualization
- 10.2.2. Network Virtualization
- 10.2.3. Hardware Virtualization
- 10.2.4. Other Types
- 10.1. Market Analysis, Insights and Forecast - by Platform
- 11. Middle East and Africa Virtualization Software Industry Analysis, Insights and Forecast, 2019-2031
- 11.1. Market Analysis, Insights and Forecast - by Platform
- 11.1.1. PC Virtualization
- 11.1.2. Mobile Virtualization
- 11.2. Market Analysis, Insights and Forecast - by Type
- 11.2.1. Application Virtualization
- 11.2.2. Network Virtualization
- 11.2.3. Hardware Virtualization
- 11.2.4. Other Types
- 11.1. Market Analysis, Insights and Forecast - by Platform
- 12. North America Virtualization Software Industry Analysis, Insights and Forecast, 2019-2031
- 12.1. Market Analysis, Insights and Forecast - By Country/Sub-region
- 12.1.1.
- 13. Europe Virtualization Software Industry Analysis, Insights and Forecast, 2019-2031
- 13.1. Market Analysis, Insights and Forecast - By Country/Sub-region
- 13.1.1.
- 14. Asia Pacific Virtualization Software Industry Analysis, Insights and Forecast, 2019-2031
- 14.1. Market Analysis, Insights and Forecast - By Country/Sub-region
- 14.1.1.
- 15. Latin America Virtualization Software Industry Analysis, Insights and Forecast, 2019-2031
- 15.1. Market Analysis, Insights and Forecast - By Country/Sub-region
- 15.1.1.
- 16. Middle East and Africa Virtualization Software Industry Analysis, Insights and Forecast, 2019-2031
- 16.1. Market Analysis, Insights and Forecast - By Country/Sub-region
- 16.1.1.
- 17. Competitive Analysis
- 17.1. Global Market Share Analysis 2024
- 17.2. Company Profiles
- 17.2.1 Parallels International GmbH
- 17.2.1.1. Overview
- 17.2.1.2. Products
- 17.2.1.3. SWOT Analysis
- 17.2.1.4. Recent Developments
- 17.2.1.5. Financials (Based on Availability)
- 17.2.2 Google LLC
- 17.2.2.1. Overview
- 17.2.2.2. Products
- 17.2.2.3. SWOT Analysis
- 17.2.2.4. Recent Developments
- 17.2.2.5. Financials (Based on Availability)
- 17.2.3 Nutanix Inc
- 17.2.3.1. Overview
- 17.2.3.2. Products
- 17.2.3.3. SWOT Analysis
- 17.2.3.4. Recent Developments
- 17.2.3.5. Financials (Based on Availability)
- 17.2.4 Amazon Inc
- 17.2.4.1. Overview
- 17.2.4.2. Products
- 17.2.4.3. SWOT Analysis
- 17.2.4.4. Recent Developments
- 17.2.4.5. Financials (Based on Availability)
- 17.2.5 Datadog Inc
- 17.2.5.1. Overview
- 17.2.5.2. Products
- 17.2.5.3. SWOT Analysis
- 17.2.5.4. Recent Developments
- 17.2.5.5. Financials (Based on Availability)
- 17.2.6 Microsoft Corporation
- 17.2.6.1. Overview
- 17.2.6.2. Products
- 17.2.6.3. SWOT Analysis
- 17.2.6.4. Recent Developments
- 17.2.6.5. Financials (Based on Availability)
- 17.2.7 TenAsys Corporation
- 17.2.7.1. Overview
- 17.2.7.2. Products
- 17.2.7.3. SWOT Analysis
- 17.2.7.4. Recent Developments
- 17.2.7.5. Financials (Based on Availability)
- 17.2.8 NComupting Co Ltd
- 17.2.8.1. Overview
- 17.2.8.2. Products
- 17.2.8.3. SWOT Analysis
- 17.2.8.4. Recent Developments
- 17.2.8.5. Financials (Based on Availability)
- 17.2.9 Red Hat Inc (IBM Corporation)
- 17.2.9.1. Overview
- 17.2.9.2. Products
- 17.2.9.3. SWOT Analysis
- 17.2.9.4. Recent Developments
- 17.2.9.5. Financials (Based on Availability)
- 17.2.10 Lynx Software Technologies*List Not Exhaustive
- 17.2.10.1. Overview
- 17.2.10.2. Products
- 17.2.10.3. SWOT Analysis
- 17.2.10.4. Recent Developments
- 17.2.10.5. Financials (Based on Availability)
- 17.2.11 Huawei Technologies Co Ltd
- 17.2.11.1. Overview
- 17.2.11.2. Products
- 17.2.11.3. SWOT Analysis
- 17.2.11.4. Recent Developments
- 17.2.11.5. Financials (Based on Availability)
- 17.2.12 Oracle Corporation
- 17.2.12.1. Overview
- 17.2.12.2. Products
- 17.2.12.3. SWOT Analysis
- 17.2.12.4. Recent Developments
- 17.2.12.5. Financials (Based on Availability)
- 17.2.13 VMware Inc
- 17.2.13.1. Overview
- 17.2.13.2. Products
- 17.2.13.3. SWOT Analysis
- 17.2.13.4. Recent Developments
- 17.2.13.5. Financials (Based on Availability)
- 17.2.14 Citrix Systems Inc
- 17.2.14.1. Overview
- 17.2.14.2. Products
- 17.2.14.3. SWOT Analysis
- 17.2.14.4. Recent Developments
- 17.2.14.5. Financials (Based on Availability)
- 17.2.1 Parallels International GmbH
List of Figures
- Figure 1: Global Virtualization Software Industry Revenue Breakdown (Million, %) by Region 2024 & 2032
- Figure 2: North America Virtualization Software Industry Revenue (Million), by Country 2024 & 2032
- Figure 3: North America Virtualization Software Industry Revenue Share (%), by Country 2024 & 2032
- Figure 4: Europe Virtualization Software Industry Revenue (Million), by Country 2024 & 2032
- Figure 5: Europe Virtualization Software Industry Revenue Share (%), by Country 2024 & 2032
- Figure 6: Asia Pacific Virtualization Software Industry Revenue (Million), by Country 2024 & 2032
- Figure 7: Asia Pacific Virtualization Software Industry Revenue Share (%), by Country 2024 & 2032
- Figure 8: Latin America Virtualization Software Industry Revenue (Million), by Country 2024 & 2032
- Figure 9: Latin America Virtualization Software Industry Revenue Share (%), by Country 2024 & 2032
- Figure 10: Middle East and Africa Virtualization Software Industry Revenue (Million), by Country 2024 & 2032
- Figure 11: Middle East and Africa Virtualization Software Industry Revenue Share (%), by Country 2024 & 2032
- Figure 12: North America Virtualization Software Industry Revenue (Million), by Platform 2024 & 2032
- Figure 13: North America Virtualization Software Industry Revenue Share (%), by Platform 2024 & 2032
- Figure 14: North America Virtualization Software Industry Revenue (Million), by Type 2024 & 2032
- Figure 15: North America Virtualization Software Industry Revenue Share (%), by Type 2024 & 2032
- Figure 16: North America Virtualization Software Industry Revenue (Million), by Country 2024 & 2032
- Figure 17: North America Virtualization Software Industry Revenue Share (%), by Country 2024 & 2032
- Figure 18: Europe Virtualization Software Industry Revenue (Million), by Platform 2024 & 2032
- Figure 19: Europe Virtualization Software Industry Revenue Share (%), by Platform 2024 & 2032
- Figure 20: Europe Virtualization Software Industry Revenue (Million), by Type 2024 & 2032
- Figure 21: Europe Virtualization Software Industry Revenue Share (%), by Type 2024 & 2032
- Figure 22: Europe Virtualization Software Industry Revenue (Million), by Country 2024 & 2032
- Figure 23: Europe Virtualization Software Industry Revenue Share (%), by Country 2024 & 2032
- Figure 24: Asia Virtualization Software Industry Revenue (Million), by Platform 2024 & 2032
- Figure 25: Asia Virtualization Software Industry Revenue Share (%), by Platform 2024 & 2032
- Figure 26: Asia Virtualization Software Industry Revenue (Million), by Type 2024 & 2032
- Figure 27: Asia Virtualization Software Industry Revenue Share (%), by Type 2024 & 2032
- Figure 28: Asia Virtualization Software Industry Revenue (Million), by Country 2024 & 2032
- Figure 29: Asia Virtualization Software Industry Revenue Share (%), by Country 2024 & 2032
- Figure 30: Australia and New Zealand Virtualization Software Industry Revenue (Million), by Platform 2024 & 2032
- Figure 31: Australia and New Zealand Virtualization Software Industry Revenue Share (%), by Platform 2024 & 2032
- Figure 32: Australia and New Zealand Virtualization Software Industry Revenue (Million), by Type 2024 & 2032
- Figure 33: Australia and New Zealand Virtualization Software Industry Revenue Share (%), by Type 2024 & 2032
- Figure 34: Australia and New Zealand Virtualization Software Industry Revenue (Million), by Country 2024 & 2032
- Figure 35: Australia and New Zealand Virtualization Software Industry Revenue Share (%), by Country 2024 & 2032
- Figure 36: Latin America Virtualization Software Industry Revenue (Million), by Platform 2024 & 2032
- Figure 37: Latin America Virtualization Software Industry Revenue Share (%), by Platform 2024 & 2032
- Figure 38: Latin America Virtualization Software Industry Revenue (Million), by Type 2024 & 2032
- Figure 39: Latin America Virtualization Software Industry Revenue Share (%), by Type 2024 & 2032
- Figure 40: Latin America Virtualization Software Industry Revenue (Million), by Country 2024 & 2032
- Figure 41: Latin America Virtualization Software Industry Revenue Share (%), by Country 2024 & 2032
- Figure 42: Middle East and Africa Virtualization Software Industry Revenue (Million), by Platform 2024 & 2032
- Figure 43: Middle East and Africa Virtualization Software Industry Revenue Share (%), by Platform 2024 & 2032
- Figure 44: Middle East and Africa Virtualization Software Industry Revenue (Million), by Type 2024 & 2032
- Figure 45: Middle East and Africa Virtualization Software Industry Revenue Share (%), by Type 2024 & 2032
- Figure 46: Middle East and Africa Virtualization Software Industry Revenue (Million), by Country 2024 & 2032
- Figure 47: Middle East and Africa Virtualization Software Industry Revenue Share (%), by Country 2024 & 2032
List of Tables
- Table 1: Global Virtualization Software Industry Revenue Million Forecast, by Region 2019 & 2032
- Table 2: Global Virtualization Software Industry Revenue Million Forecast, by Platform 2019 & 2032
- Table 3: Global Virtualization Software Industry Revenue Million Forecast, by Type 2019 & 2032
- Table 4: Global Virtualization Software Industry Revenue Million Forecast, by Region 2019 & 2032
- Table 5: Global Virtualization Software Industry Revenue Million Forecast, by Country 2019 & 2032
- Table 6: Virtualization Software Industry Revenue (Million) Forecast, by Application 2019 & 2032
- Table 7: Global Virtualization Software Industry Revenue Million Forecast, by Country 2019 & 2032
- Table 8: Virtualization Software Industry Revenue (Million) Forecast, by Application 2019 & 2032
- Table 9: Global Virtualization Software Industry Revenue Million Forecast, by Country 2019 & 2032
- Table 10: Virtualization Software Industry Revenue (Million) Forecast, by Application 2019 & 2032
- Table 11: Global Virtualization Software Industry Revenue Million Forecast, by Country 2019 & 2032
- Table 12: Virtualization Software Industry Revenue (Million) Forecast, by Application 2019 & 2032
- Table 13: Global Virtualization Software Industry Revenue Million Forecast, by Country 2019 & 2032
- Table 14: Virtualization Software Industry Revenue (Million) Forecast, by Application 2019 & 2032
- Table 15: Global Virtualization Software Industry Revenue Million Forecast, by Platform 2019 & 2032
- Table 16: Global Virtualization Software Industry Revenue Million Forecast, by Type 2019 & 2032
- Table 17: Global Virtualization Software Industry Revenue Million Forecast, by Country 2019 & 2032
- Table 18: Global Virtualization Software Industry Revenue Million Forecast, by Platform 2019 & 2032
- Table 19: Global Virtualization Software Industry Revenue Million Forecast, by Type 2019 & 2032
- Table 20: Global Virtualization Software Industry Revenue Million Forecast, by Country 2019 & 2032
- Table 21: Global Virtualization Software Industry Revenue Million Forecast, by Platform 2019 & 2032
- Table 22: Global Virtualization Software Industry Revenue Million Forecast, by Type 2019 & 2032
- Table 23: Global Virtualization Software Industry Revenue Million Forecast, by Country 2019 & 2032
- Table 24: Global Virtualization Software Industry Revenue Million Forecast, by Platform 2019 & 2032
- Table 25: Global Virtualization Software Industry Revenue Million Forecast, by Type 2019 & 2032
- Table 26: Global Virtualization Software Industry Revenue Million Forecast, by Country 2019 & 2032
- Table 27: Global Virtualization Software Industry Revenue Million Forecast, by Platform 2019 & 2032
- Table 28: Global Virtualization Software Industry Revenue Million Forecast, by Type 2019 & 2032
- Table 29: Global Virtualization Software Industry Revenue Million Forecast, by Country 2019 & 2032
- Table 30: Global Virtualization Software Industry Revenue Million Forecast, by Platform 2019 & 2032
- Table 31: Global Virtualization Software Industry Revenue Million Forecast, by Type 2019 & 2032
- Table 32: Global Virtualization Software Industry Revenue Million Forecast, by Country 2019 & 2032
Frequently Asked Questions
1. What is the projected Compound Annual Growth Rate (CAGR) of the Virtualization Software Industry?
The projected CAGR is approximately 9.47%.
2. Which companies are prominent players in the Virtualization Software Industry?
Key companies in the market include Parallels International GmbH, Google LLC, Nutanix Inc, Amazon Inc, Datadog Inc, Microsoft Corporation, TenAsys Corporation, NComupting Co Ltd, Red Hat Inc (IBM Corporation), Lynx Software Technologies*List Not Exhaustive, Huawei Technologies Co Ltd, Oracle Corporation, VMware Inc, Citrix Systems Inc.
3. What are the main segments of the Virtualization Software Industry?
The market segments include Platform, Type.
4. Can you provide details about the market size?
The market size is estimated to be USD 94.57 Million as of 2022.
5. What are some drivers contributing to market growth?
Cost Reductions due to Reduced Hardware Spending; Improved IT Efficiency due to Virtualization.
6. What are the notable trends driving market growth?
PC/ Desktop Virtualization is expected to hold Major Market share.
7. Are there any restraints impacting market growth?
High Initial Investment During the Deployment in the Infrastructure.
8. Can you provide examples of recent developments in the market?
October 2022: Microsoft and Meta collaborated to create immersive experiences for the future of work and play. As announced during Meta Connect 2022, the collaboration enabled to bring Mesh for Microsoft Teams to Meta Quest devices. It will help people gather virtually where work happens on any device such as smartphones, laptops, and mixed-reality headsets. Mesh for Teams with Meta Quest Pro and Meta Quest 2 devices will enable people to connect and collaborate as if they are together in person.
9. What pricing options are available for accessing the report?
Pricing options include single-user, multi-user, and enterprise licenses priced at USD 4750, USD 5250, and USD 8750 respectively.
10. Is the market size provided in terms of value or volume?
The market size is provided in terms of value, measured in Million.
11. Are there any specific market keywords associated with the report?
Yes, the market keyword associated with the report is "Virtualization Software Industry," which aids in identifying and referencing the specific market segment covered.
12. How do I determine which pricing option suits my needs best?
The pricing options vary based on user requirements and access needs. Individual users may opt for single-user licenses, while businesses requiring broader access may choose multi-user or enterprise licenses for cost-effective access to the report.
13. Are there any additional resources or data provided in the Virtualization Software Industry report?
While the report offers comprehensive insights, it's advisable to review the specific contents or supplementary materials provided to ascertain if additional resources or data are available.
14. How can I stay updated on further developments or reports in the Virtualization Software Industry?
To stay informed about further developments, trends, and reports in the Virtualization Software Industry, consider subscribing to industry newsletters, following relevant companies and organizations, or regularly checking reputable industry news sources and publications.
Methodology
Step 1 - Identification of Relevant Samples Size from Population Database


Step 2 - Approaches for Defining Global Market Size (Value, Volume* & Price*)

Note*: In applicable scenarios
Step 3 - Data Sources
Primary Research
- Web Analytics
- Survey Reports
- Research Institute
- Latest Research Reports
- Opinion Leaders
Secondary Research
- Annual Reports
- White Paper
- Latest Press Release
- Industry Association
- Paid Database
- Investor Presentations

Step 4 - Data Triangulation
Involves using different sources of information in order to increase the validity of a study
These sources are likely to be stakeholders in a program - participants, other researchers, program staff, other community members, and so on.
Then we put all data in single framework & apply various statistical tools to find out the dynamic on the market.
During the analysis stage, feedback from the stakeholder groups would be compared to determine areas of agreement as well as areas of divergence
