

Key Insights
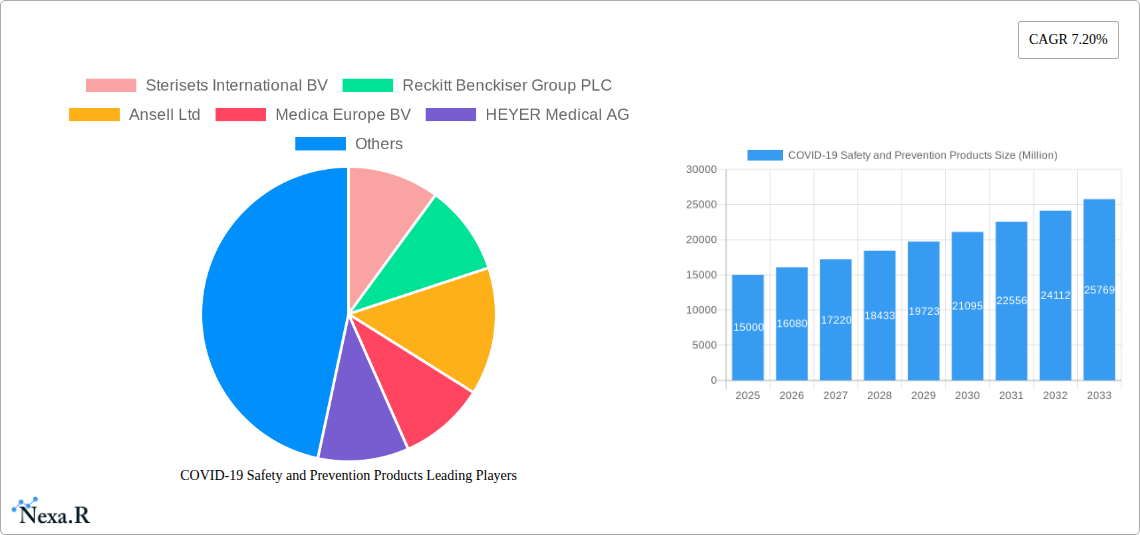
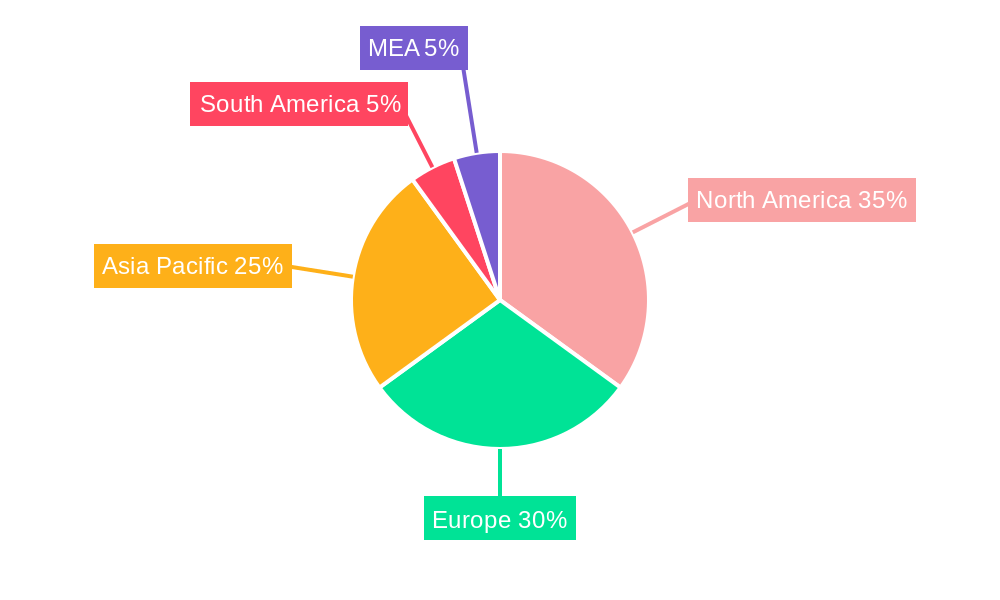
The global market for COVID-19 safety and prevention products experienced significant growth during the pandemic and continues to evolve. While the initial surge in demand for products like face masks, hand sanitizers, and ventilators has subsided, a sustained market remains due to ongoing concerns about infectious diseases and evolving public health protocols. The market is segmented by product type (masks, gloves, sanitizers, thermometers, ventilators, etc.), usage (disposable vs. reusable), material type (nitrile, latex, etc.), and filter standards. The 7.20% CAGR suggests a continued, albeit moderated, expansion. Growth is driven by increased awareness of hygiene practices, the emergence of new variants, and the ongoing need for personal protective equipment (PPE) in healthcare settings and other industries. Factors such as pricing fluctuations, raw material availability, and the potential for oversupply in some product categories represent key restraints. Regional differences exist, with North America and Europe initially demonstrating higher market penetration, followed by substantial growth in Asia-Pacific regions.
The market's long-term trajectory depends on several factors. The continued prevalence of respiratory illnesses and preparedness for future pandemics will support demand for certain product categories. The adoption of new technologies, such as improved sensor technology in thermal imagers, and innovation in material science for enhanced PPE will drive future growth. A gradual shift towards reusable and sustainable products is anticipated, while the demand for advanced medical equipment, like ventilators and isolation chambers, will be influenced by healthcare infrastructure developments and evolving public health policies. Major players in the market are multinational corporations and specialized medical equipment manufacturers, often with established distribution networks crucial for efficient supply chain management. Strategic acquisitions, partnerships, and research & development activities will shape the competitive landscape in the coming years.
COVID-19 Safety and Prevention Products Market Report: 2019-2033
This comprehensive report provides a detailed analysis of the COVID-19 Safety and Prevention Products market, encompassing market dynamics, growth trends, regional dominance, product landscape, key challenges, emerging opportunities, and key players. The study period spans from 2019 to 2033, with a base year of 2025 and a forecast period of 2025-2033. The report utilizes both parent and child market segmentation for enhanced granularity and insights, providing invaluable data for industry professionals, investors, and strategists. Units are expressed in millions.
COVID-19 Safety and Prevention Products Market Dynamics & Structure
This section analyzes the market structure, highlighting market concentration, technological advancements, regulatory landscapes, competitive dynamics, and end-user demographics. The analysis encompasses both qualitative and quantitative aspects, including market share distribution and M&A activity. The market exhibits a moderately consolidated structure, with key players holding significant shares. However, the entry of new players, particularly in the sanitizers and PPE segments, is continuously increasing competition.
- Market Concentration: The top 10 players account for approximately xx% of the global market in 2024. This is expected to decline slightly to xx% by 2033 due to increased competition.
- Technological Innovation: Continuous innovation in material science (e.g., development of more effective filter materials for masks), sensor technology (e.g., improved accuracy in infrared thermometers), and automation (e.g., automated production of PPE) are key drivers.
- Regulatory Frameworks: Stringent regulations regarding product safety and efficacy, particularly for medical devices like ventilators and respirators, significantly impact market dynamics. Variations in regulations across different geographies pose a challenge for global players.
- Competitive Product Substitutes: The market faces competition from substitute products, especially in the sanitizers segment, where various alternatives exist.
- End-User Demographics: The primary end-users include healthcare facilities, government agencies, and individual consumers. Demand patterns vary based on pandemic severity and public health guidelines.
- M&A Trends: The period 2019-2024 witnessed xx M&A deals, primarily focused on consolidating supply chains and expanding product portfolios. The forecast period is expected to see xx M&A deals.
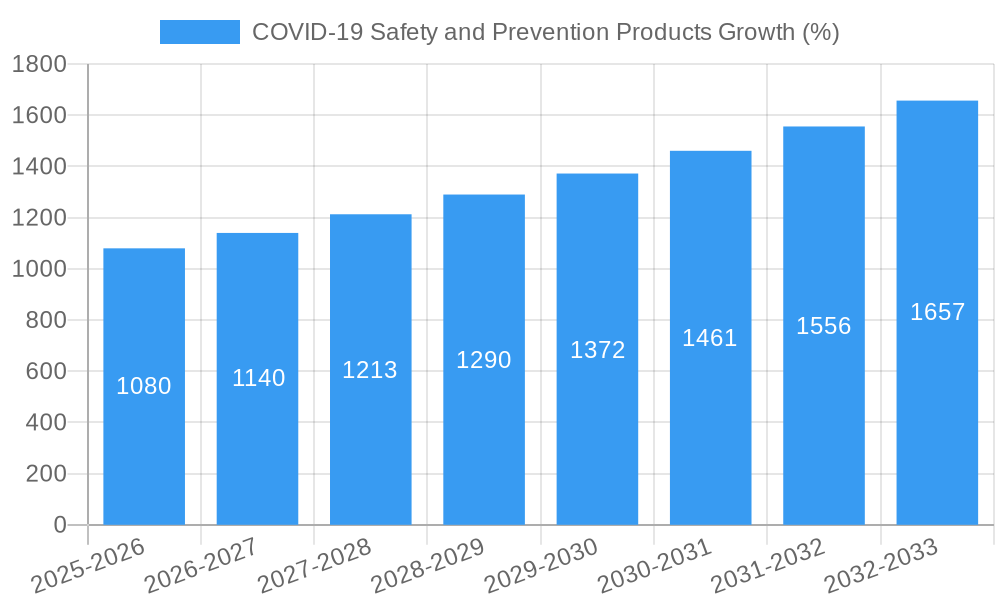
COVID-19 Safety and Prevention Products Growth Trends & Insights
The COVID-19 pandemic significantly impacted the market, leading to exponential growth in demand for various products. Post-pandemic, while demand may stabilize, a sustained need for certain products (e.g., hand sanitizers, masks, and advanced respiratory equipment) remains. Market size evolution is analyzed based on historical and projected data, including CAGR and market penetration rates. Adoption rates for new technologies, such as advanced filtration systems and contactless temperature screening devices, are also discussed. Consumer behavior shifts, reflecting an increased awareness of hygiene and personal safety, will contribute to long-term market growth. The market experienced a CAGR of xx% during the historical period (2019-2024) and is projected to grow at a CAGR of xx% during the forecast period (2025-2033), reaching a market size of xx million units by 2033. Market penetration of technologically advanced products will show substantial growth.
Dominant Regions, Countries, or Segments in COVID-19 Safety and Prevention Products
North America and Europe dominated the market in 2024, driven by high healthcare expenditure, stringent regulations, and early pandemic impact. However, Asia-Pacific is anticipated to witness substantial growth during the forecast period. The disposable segment holds a significant share in the "By Usage" category, followed by the reusable segment. Within "By Product/Equipment Type," the demand for temperature devices, particularly infrared thermometers, was high initially and remains steady, while ventilators experienced a surge in demand during the pandemic's peak. Surgical masks continued to hold a large share in the "By Type" category, demonstrating a resilient market despite the initial peak.
- Key Drivers: High healthcare expenditure in developed economies, stringent regulations, robust healthcare infrastructure, and rising public awareness of hygiene.
- Dominance Factors: North America and Europe benefited from early pandemic impact and established healthcare infrastructure. Asia-Pacific's growth potential stems from its large population and increasing disposable incomes.
COVID-19 Safety and Prevention Products Product Landscape
Product innovations are characterized by enhanced filtration efficiency in respirators, improved comfort and design in masks, and the development of more accurate and portable temperature screening devices. Applications span healthcare settings, workplaces, public spaces, and individual use. Performance metrics focus on filtration efficiency, comfort, durability, and accuracy. Unique selling propositions involve advanced features such as antimicrobial coatings, improved breathability, and integration with digital platforms for data tracking. Technological advancements include nanomaterials for filtration, AI-powered thermal imaging, and improved ventilator designs.
Key Drivers, Barriers & Challenges in COVID-19 Safety and Prevention Products
Key Drivers: The ongoing need for infection control in healthcare settings, increasing awareness of personal hygiene, technological advancements in product design and manufacturing, supportive government policies, and the demand for contactless solutions.
Key Challenges and Restraints: Supply chain disruptions can lead to product shortages and price volatility. Stringent regulatory approvals for medical devices create hurdles for market entry. Intense competition among numerous players can pressure profit margins. The potential for counterfeit products poses a significant challenge to market integrity. The market size and impact vary depending on the severity of future outbreaks.
Emerging Opportunities in COVID-19 Safety and Prevention Products
Emerging opportunities lie in developing sustainable and eco-friendly products, integrating AI and IoT for smart health monitoring solutions, expanding into untapped markets in developing economies, developing next-generation filtration technologies, and creating personalized protective equipment.
Growth Accelerators in the COVID-19 Safety and Prevention Products Industry
Technological breakthroughs in materials science, sensor technology, and manufacturing processes will continue to drive growth. Strategic partnerships between manufacturers and healthcare providers will facilitate product adoption and distribution. Market expansion into new geographies, especially in developing economies, will unlock significant growth potential.
Key Players Shaping the COVID-19 Safety and Prevention Products Market
- Sterisets International BV
- Reckitt Benckiser Group PLC
- Ansell Ltd
- Medica Europe BV
- HEYER Medical AG
- Guangzhou Pidegree Medical Technology Co Ltd
- Dynarex Corporation
- Koninklijke Philips N V
- Cardinal Health Inc
- DUPONT de Nemours Inc
- 3M Company
- Medtronic PLC
- A&D Company Limited
- Shandong Yuyuan Latex Gloves Co Ltd
- Shield Scientific
- Microgen Hygiene Pvt Ltd
- Procter & Gamble (P&G) Company
- ResMed Inc
- Smiths Medical Inc
- Kimberly Clark Corporation
Notable Milestones in COVID-19 Safety and Prevention Products Sector
- 2020 Q1: Surge in demand for PPE and ventilators globally.
- 2020 Q2: Significant investment in PPE manufacturing capacity expansion.
- 2020 Q4: Introduction of rapid antigen tests for COVID-19.
- 2021 Q1: Rollout of COVID-19 vaccines.
- 2022 onwards: Continuous innovation in improved PPE and sanitization products.
In-Depth COVID-19 Safety and Prevention Products Market Outlook
The long-term outlook for the COVID-19 Safety and Prevention Products market remains positive, driven by sustained demand for infection control solutions. Continued technological advancements, strategic partnerships, and expansion into new markets will contribute to significant growth. The focus will increasingly shift towards sustainable and innovative products tailored to evolving consumer needs and evolving public health guidelines, with a robust focus on preparedness for future pandemic threats.
COVID-19 Safety and Prevention Products Segmentation
-
1. Product/Equipment Type
-
1.1. Temperature Device
-
1.1.1. By Type
- 1.1.1.1. Infrared Thermometer
- 1.1.1.2. Thermal Imagers
-
1.1.1. By Type
-
1.2. Ventilators
- 1.2.1. Invasive/Mechanical Ventilators
- 1.2.2. Non-invasive Ventilators
- 1.3. Isolation Chambers
-
1.4. Protective Face Masks
- 1.4.1. Cloth Based Face Masks
- 1.4.2. Surgical Masks
-
1.4.3. Respirators
-
1.4.3.1. By Filter Standard
-
1.4.3.1.1. US Based Filter Class
- 1.4.3.1.1.1. N - Series
- 1.4.3.1.1.2. P - Series
- 1.4.3.1.1.3. R - Series
-
1.4.3.1.2. European Based Filter Class
- 1.4.3.1.2.1. FFP1
- 1.4.3.1.2.2. FFP2
- 1.4.3.1.2.3. FFP3
-
1.4.3.1.1. US Based Filter Class
-
1.4.3.1. By Filter Standard
-
1.5. Sanitizers
-
1.5.1. By Format
- 1.5.1.1. Gel
- 1.5.1.2. Foam
- 1.5.1.3. Liquid
- 1.5.1.4. Wipe
- 1.5.1.5. Spray
-
1.5.1. By Format
-
1.6. Gloves
-
1.6.1. By Material Type
- 1.6.1.1. Rubber
- 1.6.1.2. Poly(vinyl Chloride)
- 1.6.1.3. Poly Chloroprene
- 1.6.1.4. Nitrile
-
1.6.1. By Material Type
-
1.7. Medical Gowns (Coveralls)
-
1.7.1. By Usage
- 1.7.1.1. Disposable
- 1.7.1.2. Re-usable
-
1.7.1. By Usage
- 1.8. Others (
-
1.1. Temperature Device
COVID-19 Safety and Prevention Products Segmentation By Geography
- 1. North America
- 2. Europe
- 3. Asia Pacific
- 4. Rest of the World
COVID-19 Safety and Prevention Products REPORT HIGHLIGHTS
| Aspects | Details |
|---|---|
| Study Period | 2019-2033 |
| Base Year | 2024 |
| Estimated Year | 2025 |
| Forecast Period | 2025-2033 |
| Historical Period | 2019-2024 |
| Growth Rate | CAGR of 7.20% from 2019-2033 |
| Segmentation |
|
Table of Contents
- 1. Introduction
- 1.1. Research Scope
- 1.2. Market Segmentation
- 1.3. Research Methodology
- 1.4. Definitions and Assumptions
- 2. Executive Summary
- 2.1. Introduction
- 3. Market Dynamics
- 3.1. Introduction
- 3.2. Market Drivers
- 3.2.1. ; Rising EXIM of Medical Grade Supplies; Reduced Tariff on Protective Equipment
- 3.3. Market Restrains
- 3.3.1. ; Inadequate Supply of Safety Products Creating a Price Pressure
- 3.4. Market Trends
- 3.4.1. Ventilators to Record a Major Share of the Market Studied
- 4. Market Factor Analysis
- 4.1. Porters Five Forces
- 4.2. Supply/Value Chain
- 4.3. PESTEL analysis
- 4.4. Market Entropy
- 4.5. Patent/Trademark Analysis
- 5. Global COVID-19 Safety and Prevention Products Analysis, Insights and Forecast, 2019-2031
- 5.1. Market Analysis, Insights and Forecast - by Product/Equipment Type
- 5.1.1. Temperature Device
- 5.1.1.1. By Type
- 5.1.1.1.1. Infrared Thermometer
- 5.1.1.1.2. Thermal Imagers
- 5.1.1.1. By Type
- 5.1.2. Ventilators
- 5.1.2.1. Invasive/Mechanical Ventilators
- 5.1.2.2. Non-invasive Ventilators
- 5.1.3. Isolation Chambers
- 5.1.4. Protective Face Masks
- 5.1.4.1. Cloth Based Face Masks
- 5.1.4.2. Surgical Masks
- 5.1.4.3. Respirators
- 5.1.4.3.1. By Filter Standard
- 5.1.4.3.1.1. US Based Filter Class
- 5.1.4.3.1.1.1. N - Series
- 5.1.4.3.1.1.2. P - Series
- 5.1.4.3.1.1.3. R - Series
- 5.1.4.3.1.2. European Based Filter Class
- 5.1.4.3.1.2.1. FFP1
- 5.1.4.3.1.2.2. FFP2
- 5.1.4.3.1.2.3. FFP3
- 5.1.4.3.1.1. US Based Filter Class
- 5.1.4.3.1. By Filter Standard
- 5.1.5. Sanitizers
- 5.1.5.1. By Format
- 5.1.5.1.1. Gel
- 5.1.5.1.2. Foam
- 5.1.5.1.3. Liquid
- 5.1.5.1.4. Wipe
- 5.1.5.1.5. Spray
- 5.1.5.1. By Format
- 5.1.6. Gloves
- 5.1.6.1. By Material Type
- 5.1.6.1.1. Rubber
- 5.1.6.1.2. Poly(vinyl Chloride)
- 5.1.6.1.3. Poly Chloroprene
- 5.1.6.1.4. Nitrile
- 5.1.6.1. By Material Type
- 5.1.7. Medical Gowns (Coveralls)
- 5.1.7.1. By Usage
- 5.1.7.1.1. Disposable
- 5.1.7.1.2. Re-usable
- 5.1.7.1. By Usage
- 5.1.8. Others (
- 5.1.1. Temperature Device
- 5.2. Market Analysis, Insights and Forecast - by Region
- 5.2.1. North America
- 5.2.2. Europe
- 5.2.3. Asia Pacific
- 5.2.4. Rest of the World
- 5.1. Market Analysis, Insights and Forecast - by Product/Equipment Type
- 6. North America COVID-19 Safety and Prevention Products Analysis, Insights and Forecast, 2019-2031
- 6.1. Market Analysis, Insights and Forecast - by Product/Equipment Type
- 6.1.1. Temperature Device
- 6.1.1.1. By Type
- 6.1.1.1.1. Infrared Thermometer
- 6.1.1.1.2. Thermal Imagers
- 6.1.1.1. By Type
- 6.1.2. Ventilators
- 6.1.2.1. Invasive/Mechanical Ventilators
- 6.1.2.2. Non-invasive Ventilators
- 6.1.3. Isolation Chambers
- 6.1.4. Protective Face Masks
- 6.1.4.1. Cloth Based Face Masks
- 6.1.4.2. Surgical Masks
- 6.1.4.3. Respirators
- 6.1.4.3.1. By Filter Standard
- 6.1.4.3.1.1. US Based Filter Class
- 6.1.4.3.1.1.1. N - Series
- 6.1.4.3.1.1.2. P - Series
- 6.1.4.3.1.1.3. R - Series
- 6.1.4.3.1.2. European Based Filter Class
- 6.1.4.3.1.2.1. FFP1
- 6.1.4.3.1.2.2. FFP2
- 6.1.4.3.1.2.3. FFP3
- 6.1.4.3.1.1. US Based Filter Class
- 6.1.4.3.1. By Filter Standard
- 6.1.5. Sanitizers
- 6.1.5.1. By Format
- 6.1.5.1.1. Gel
- 6.1.5.1.2. Foam
- 6.1.5.1.3. Liquid
- 6.1.5.1.4. Wipe
- 6.1.5.1.5. Spray
- 6.1.5.1. By Format
- 6.1.6. Gloves
- 6.1.6.1. By Material Type
- 6.1.6.1.1. Rubber
- 6.1.6.1.2. Poly(vinyl Chloride)
- 6.1.6.1.3. Poly Chloroprene
- 6.1.6.1.4. Nitrile
- 6.1.6.1. By Material Type
- 6.1.7. Medical Gowns (Coveralls)
- 6.1.7.1. By Usage
- 6.1.7.1.1. Disposable
- 6.1.7.1.2. Re-usable
- 6.1.7.1. By Usage
- 6.1.8. Others (
- 6.1.1. Temperature Device
- 6.1. Market Analysis, Insights and Forecast - by Product/Equipment Type
- 7. Europe COVID-19 Safety and Prevention Products Analysis, Insights and Forecast, 2019-2031
- 7.1. Market Analysis, Insights and Forecast - by Product/Equipment Type
- 7.1.1. Temperature Device
- 7.1.1.1. By Type
- 7.1.1.1.1. Infrared Thermometer
- 7.1.1.1.2. Thermal Imagers
- 7.1.1.1. By Type
- 7.1.2. Ventilators
- 7.1.2.1. Invasive/Mechanical Ventilators
- 7.1.2.2. Non-invasive Ventilators
- 7.1.3. Isolation Chambers
- 7.1.4. Protective Face Masks
- 7.1.4.1. Cloth Based Face Masks
- 7.1.4.2. Surgical Masks
- 7.1.4.3. Respirators
- 7.1.4.3.1. By Filter Standard
- 7.1.4.3.1.1. US Based Filter Class
- 7.1.4.3.1.1.1. N - Series
- 7.1.4.3.1.1.2. P - Series
- 7.1.4.3.1.1.3. R - Series
- 7.1.4.3.1.2. European Based Filter Class
- 7.1.4.3.1.2.1. FFP1
- 7.1.4.3.1.2.2. FFP2
- 7.1.4.3.1.2.3. FFP3
- 7.1.4.3.1.1. US Based Filter Class
- 7.1.4.3.1. By Filter Standard
- 7.1.5. Sanitizers
- 7.1.5.1. By Format
- 7.1.5.1.1. Gel
- 7.1.5.1.2. Foam
- 7.1.5.1.3. Liquid
- 7.1.5.1.4. Wipe
- 7.1.5.1.5. Spray
- 7.1.5.1. By Format
- 7.1.6. Gloves
- 7.1.6.1. By Material Type
- 7.1.6.1.1. Rubber
- 7.1.6.1.2. Poly(vinyl Chloride)
- 7.1.6.1.3. Poly Chloroprene
- 7.1.6.1.4. Nitrile
- 7.1.6.1. By Material Type
- 7.1.7. Medical Gowns (Coveralls)
- 7.1.7.1. By Usage
- 7.1.7.1.1. Disposable
- 7.1.7.1.2. Re-usable
- 7.1.7.1. By Usage
- 7.1.8. Others (
- 7.1.1. Temperature Device
- 7.1. Market Analysis, Insights and Forecast - by Product/Equipment Type
- 8. Asia Pacific COVID-19 Safety and Prevention Products Analysis, Insights and Forecast, 2019-2031
- 8.1. Market Analysis, Insights and Forecast - by Product/Equipment Type
- 8.1.1. Temperature Device
- 8.1.1.1. By Type
- 8.1.1.1.1. Infrared Thermometer
- 8.1.1.1.2. Thermal Imagers
- 8.1.1.1. By Type
- 8.1.2. Ventilators
- 8.1.2.1. Invasive/Mechanical Ventilators
- 8.1.2.2. Non-invasive Ventilators
- 8.1.3. Isolation Chambers
- 8.1.4. Protective Face Masks
- 8.1.4.1. Cloth Based Face Masks
- 8.1.4.2. Surgical Masks
- 8.1.4.3. Respirators
- 8.1.4.3.1. By Filter Standard
- 8.1.4.3.1.1. US Based Filter Class
- 8.1.4.3.1.1.1. N - Series
- 8.1.4.3.1.1.2. P - Series
- 8.1.4.3.1.1.3. R - Series
- 8.1.4.3.1.2. European Based Filter Class
- 8.1.4.3.1.2.1. FFP1
- 8.1.4.3.1.2.2. FFP2
- 8.1.4.3.1.2.3. FFP3
- 8.1.4.3.1.1. US Based Filter Class
- 8.1.4.3.1. By Filter Standard
- 8.1.5. Sanitizers
- 8.1.5.1. By Format
- 8.1.5.1.1. Gel
- 8.1.5.1.2. Foam
- 8.1.5.1.3. Liquid
- 8.1.5.1.4. Wipe
- 8.1.5.1.5. Spray
- 8.1.5.1. By Format
- 8.1.6. Gloves
- 8.1.6.1. By Material Type
- 8.1.6.1.1. Rubber
- 8.1.6.1.2. Poly(vinyl Chloride)
- 8.1.6.1.3. Poly Chloroprene
- 8.1.6.1.4. Nitrile
- 8.1.6.1. By Material Type
- 8.1.7. Medical Gowns (Coveralls)
- 8.1.7.1. By Usage
- 8.1.7.1.1. Disposable
- 8.1.7.1.2. Re-usable
- 8.1.7.1. By Usage
- 8.1.8. Others (
- 8.1.1. Temperature Device
- 8.1. Market Analysis, Insights and Forecast - by Product/Equipment Type
- 9. Rest of the World COVID-19 Safety and Prevention Products Analysis, Insights and Forecast, 2019-2031
- 9.1. Market Analysis, Insights and Forecast - by Product/Equipment Type
- 9.1.1. Temperature Device
- 9.1.1.1. By Type
- 9.1.1.1.1. Infrared Thermometer
- 9.1.1.1.2. Thermal Imagers
- 9.1.1.1. By Type
- 9.1.2. Ventilators
- 9.1.2.1. Invasive/Mechanical Ventilators
- 9.1.2.2. Non-invasive Ventilators
- 9.1.3. Isolation Chambers
- 9.1.4. Protective Face Masks
- 9.1.4.1. Cloth Based Face Masks
- 9.1.4.2. Surgical Masks
- 9.1.4.3. Respirators
- 9.1.4.3.1. By Filter Standard
- 9.1.4.3.1.1. US Based Filter Class
- 9.1.4.3.1.1.1. N - Series
- 9.1.4.3.1.1.2. P - Series
- 9.1.4.3.1.1.3. R - Series
- 9.1.4.3.1.2. European Based Filter Class
- 9.1.4.3.1.2.1. FFP1
- 9.1.4.3.1.2.2. FFP2
- 9.1.4.3.1.2.3. FFP3
- 9.1.4.3.1.1. US Based Filter Class
- 9.1.4.3.1. By Filter Standard
- 9.1.5. Sanitizers
- 9.1.5.1. By Format
- 9.1.5.1.1. Gel
- 9.1.5.1.2. Foam
- 9.1.5.1.3. Liquid
- 9.1.5.1.4. Wipe
- 9.1.5.1.5. Spray
- 9.1.5.1. By Format
- 9.1.6. Gloves
- 9.1.6.1. By Material Type
- 9.1.6.1.1. Rubber
- 9.1.6.1.2. Poly(vinyl Chloride)
- 9.1.6.1.3. Poly Chloroprene
- 9.1.6.1.4. Nitrile
- 9.1.6.1. By Material Type
- 9.1.7. Medical Gowns (Coveralls)
- 9.1.7.1. By Usage
- 9.1.7.1.1. Disposable
- 9.1.7.1.2. Re-usable
- 9.1.7.1. By Usage
- 9.1.8. Others (
- 9.1.1. Temperature Device
- 9.1. Market Analysis, Insights and Forecast - by Product/Equipment Type
- 10. North America COVID-19 Safety and Prevention Products Analysis, Insights and Forecast, 2019-2031
- 10.1. Market Analysis, Insights and Forecast - By Country/Sub-region
- 10.1.1 United States
- 10.1.2 Canada
- 10.1.3 Mexico
- 11. Europe COVID-19 Safety and Prevention Products Analysis, Insights and Forecast, 2019-2031
- 11.1. Market Analysis, Insights and Forecast - By Country/Sub-region
- 11.1.1 Germany
- 11.1.2 United Kingdom
- 11.1.3 France
- 11.1.4 Spain
- 11.1.5 Italy
- 11.1.6 Spain
- 11.1.7 Belgium
- 11.1.8 Netherland
- 11.1.9 Nordics
- 11.1.10 Rest of Europe
- 12. Asia Pacific COVID-19 Safety and Prevention Products Analysis, Insights and Forecast, 2019-2031
- 12.1. Market Analysis, Insights and Forecast - By Country/Sub-region
- 12.1.1 China
- 12.1.2 Japan
- 12.1.3 India
- 12.1.4 South Korea
- 12.1.5 Southeast Asia
- 12.1.6 Australia
- 12.1.7 Indonesia
- 12.1.8 Phillipes
- 12.1.9 Singapore
- 12.1.10 Thailandc
- 12.1.11 Rest of Asia Pacific
- 13. South America COVID-19 Safety and Prevention Products Analysis, Insights and Forecast, 2019-2031
- 13.1. Market Analysis, Insights and Forecast - By Country/Sub-region
- 13.1.1 Brazil
- 13.1.2 Argentina
- 13.1.3 Peru
- 13.1.4 Chile
- 13.1.5 Colombia
- 13.1.6 Ecuador
- 13.1.7 Venezuela
- 13.1.8 Rest of South America
- 14. North America COVID-19 Safety and Prevention Products Analysis, Insights and Forecast, 2019-2031
- 14.1. Market Analysis, Insights and Forecast - By Country/Sub-region
- 14.1.1 United States
- 14.1.2 Canada
- 14.1.3 Mexico
- 15. MEA COVID-19 Safety and Prevention Products Analysis, Insights and Forecast, 2019-2031
- 15.1. Market Analysis, Insights and Forecast - By Country/Sub-region
- 15.1.1 United Arab Emirates
- 15.1.2 Saudi Arabia
- 15.1.3 South Africa
- 15.1.4 Rest of Middle East and Africa
- 16. Competitive Analysis
- 16.1. Global Market Share Analysis 2024
- 16.2. Company Profiles
- 16.2.1 Sterisets International BV
- 16.2.1.1. Overview
- 16.2.1.2. Products
- 16.2.1.3. SWOT Analysis
- 16.2.1.4. Recent Developments
- 16.2.1.5. Financials (Based on Availability)
- 16.2.2 Reckitt Benckiser Group PLC
- 16.2.2.1. Overview
- 16.2.2.2. Products
- 16.2.2.3. SWOT Analysis
- 16.2.2.4. Recent Developments
- 16.2.2.5. Financials (Based on Availability)
- 16.2.3 Ansell Ltd
- 16.2.3.1. Overview
- 16.2.3.2. Products
- 16.2.3.3. SWOT Analysis
- 16.2.3.4. Recent Developments
- 16.2.3.5. Financials (Based on Availability)
- 16.2.4 Medica Europe BV
- 16.2.4.1. Overview
- 16.2.4.2. Products
- 16.2.4.3. SWOT Analysis
- 16.2.4.4. Recent Developments
- 16.2.4.5. Financials (Based on Availability)
- 16.2.5 HEYER Medical AG
- 16.2.5.1. Overview
- 16.2.5.2. Products
- 16.2.5.3. SWOT Analysis
- 16.2.5.4. Recent Developments
- 16.2.5.5. Financials (Based on Availability)
- 16.2.6 Guangzhou Pidegree Medical Technology Co Ltd
- 16.2.6.1. Overview
- 16.2.6.2. Products
- 16.2.6.3. SWOT Analysis
- 16.2.6.4. Recent Developments
- 16.2.6.5. Financials (Based on Availability)
- 16.2.7 Dynarex Corporation
- 16.2.7.1. Overview
- 16.2.7.2. Products
- 16.2.7.3. SWOT Analysis
- 16.2.7.4. Recent Developments
- 16.2.7.5. Financials (Based on Availability)
- 16.2.8 Koninklijke Philips N V
- 16.2.8.1. Overview
- 16.2.8.2. Products
- 16.2.8.3. SWOT Analysis
- 16.2.8.4. Recent Developments
- 16.2.8.5. Financials (Based on Availability)
- 16.2.9 Cardinal Health Inc
- 16.2.9.1. Overview
- 16.2.9.2. Products
- 16.2.9.3. SWOT Analysis
- 16.2.9.4. Recent Developments
- 16.2.9.5. Financials (Based on Availability)
- 16.2.10 DUPONT de Nemours Inc
- 16.2.10.1. Overview
- 16.2.10.2. Products
- 16.2.10.3. SWOT Analysis
- 16.2.10.4. Recent Developments
- 16.2.10.5. Financials (Based on Availability)
- 16.2.11 3M Company
- 16.2.11.1. Overview
- 16.2.11.2. Products
- 16.2.11.3. SWOT Analysis
- 16.2.11.4. Recent Developments
- 16.2.11.5. Financials (Based on Availability)
- 16.2.12 Medtronic PLC
- 16.2.12.1. Overview
- 16.2.12.2. Products
- 16.2.12.3. SWOT Analysis
- 16.2.12.4. Recent Developments
- 16.2.12.5. Financials (Based on Availability)
- 16.2.13 A&D Company Limited*List Not Exhaustive
- 16.2.13.1. Overview
- 16.2.13.2. Products
- 16.2.13.3. SWOT Analysis
- 16.2.13.4. Recent Developments
- 16.2.13.5. Financials (Based on Availability)
- 16.2.14 Shandong Yuyuan Latex Gloves Co Ltd
- 16.2.14.1. Overview
- 16.2.14.2. Products
- 16.2.14.3. SWOT Analysis
- 16.2.14.4. Recent Developments
- 16.2.14.5. Financials (Based on Availability)
- 16.2.15 Shield Scientific
- 16.2.15.1. Overview
- 16.2.15.2. Products
- 16.2.15.3. SWOT Analysis
- 16.2.15.4. Recent Developments
- 16.2.15.5. Financials (Based on Availability)
- 16.2.16 Microgen Hygiene Pvt Ltd
- 16.2.16.1. Overview
- 16.2.16.2. Products
- 16.2.16.3. SWOT Analysis
- 16.2.16.4. Recent Developments
- 16.2.16.5. Financials (Based on Availability)
- 16.2.17 Procter & Gamble (P&G) Company
- 16.2.17.1. Overview
- 16.2.17.2. Products
- 16.2.17.3. SWOT Analysis
- 16.2.17.4. Recent Developments
- 16.2.17.5. Financials (Based on Availability)
- 16.2.18 ResMed Inc
- 16.2.18.1. Overview
- 16.2.18.2. Products
- 16.2.18.3. SWOT Analysis
- 16.2.18.4. Recent Developments
- 16.2.18.5. Financials (Based on Availability)
- 16.2.19 Smiths Medical Inc
- 16.2.19.1. Overview
- 16.2.19.2. Products
- 16.2.19.3. SWOT Analysis
- 16.2.19.4. Recent Developments
- 16.2.19.5. Financials (Based on Availability)
- 16.2.20 Kimberly Clark Corporation
- 16.2.20.1. Overview
- 16.2.20.2. Products
- 16.2.20.3. SWOT Analysis
- 16.2.20.4. Recent Developments
- 16.2.20.5. Financials (Based on Availability)
- 16.2.1 Sterisets International BV
List of Figures
- Figure 1: Global COVID-19 Safety and Prevention Products Revenue Breakdown (Million, %) by Region 2024 & 2032
- Figure 2: North America COVID-19 Safety and Prevention Products Revenue (Million), by Country 2024 & 2032
- Figure 3: North America COVID-19 Safety and Prevention Products Revenue Share (%), by Country 2024 & 2032
- Figure 4: Europe COVID-19 Safety and Prevention Products Revenue (Million), by Country 2024 & 2032
- Figure 5: Europe COVID-19 Safety and Prevention Products Revenue Share (%), by Country 2024 & 2032
- Figure 6: Asia Pacific COVID-19 Safety and Prevention Products Revenue (Million), by Country 2024 & 2032
- Figure 7: Asia Pacific COVID-19 Safety and Prevention Products Revenue Share (%), by Country 2024 & 2032
- Figure 8: South America COVID-19 Safety and Prevention Products Revenue (Million), by Country 2024 & 2032
- Figure 9: South America COVID-19 Safety and Prevention Products Revenue Share (%), by Country 2024 & 2032
- Figure 10: North America COVID-19 Safety and Prevention Products Revenue (Million), by Country 2024 & 2032
- Figure 11: North America COVID-19 Safety and Prevention Products Revenue Share (%), by Country 2024 & 2032
- Figure 12: MEA COVID-19 Safety and Prevention Products Revenue (Million), by Country 2024 & 2032
- Figure 13: MEA COVID-19 Safety and Prevention Products Revenue Share (%), by Country 2024 & 2032
- Figure 14: North America COVID-19 Safety and Prevention Products Revenue (Million), by Product/Equipment Type 2024 & 2032
- Figure 15: North America COVID-19 Safety and Prevention Products Revenue Share (%), by Product/Equipment Type 2024 & 2032
- Figure 16: North America COVID-19 Safety and Prevention Products Revenue (Million), by Country 2024 & 2032
- Figure 17: North America COVID-19 Safety and Prevention Products Revenue Share (%), by Country 2024 & 2032
- Figure 18: Europe COVID-19 Safety and Prevention Products Revenue (Million), by Product/Equipment Type 2024 & 2032
- Figure 19: Europe COVID-19 Safety and Prevention Products Revenue Share (%), by Product/Equipment Type 2024 & 2032
- Figure 20: Europe COVID-19 Safety and Prevention Products Revenue (Million), by Country 2024 & 2032
- Figure 21: Europe COVID-19 Safety and Prevention Products Revenue Share (%), by Country 2024 & 2032
- Figure 22: Asia Pacific COVID-19 Safety and Prevention Products Revenue (Million), by Product/Equipment Type 2024 & 2032
- Figure 23: Asia Pacific COVID-19 Safety and Prevention Products Revenue Share (%), by Product/Equipment Type 2024 & 2032
- Figure 24: Asia Pacific COVID-19 Safety and Prevention Products Revenue (Million), by Country 2024 & 2032
- Figure 25: Asia Pacific COVID-19 Safety and Prevention Products Revenue Share (%), by Country 2024 & 2032
- Figure 26: Rest of the World COVID-19 Safety and Prevention Products Revenue (Million), by Product/Equipment Type 2024 & 2032
- Figure 27: Rest of the World COVID-19 Safety and Prevention Products Revenue Share (%), by Product/Equipment Type 2024 & 2032
- Figure 28: Rest of the World COVID-19 Safety and Prevention Products Revenue (Million), by Country 2024 & 2032
- Figure 29: Rest of the World COVID-19 Safety and Prevention Products Revenue Share (%), by Country 2024 & 2032
List of Tables
- Table 1: Global COVID-19 Safety and Prevention Products Revenue Million Forecast, by Region 2019 & 2032
- Table 2: Global COVID-19 Safety and Prevention Products Revenue Million Forecast, by Product/Equipment Type 2019 & 2032
- Table 3: Global COVID-19 Safety and Prevention Products Revenue Million Forecast, by Region 2019 & 2032
- Table 4: Global COVID-19 Safety and Prevention Products Revenue Million Forecast, by Country 2019 & 2032
- Table 5: United States COVID-19 Safety and Prevention Products Revenue (Million) Forecast, by Application 2019 & 2032
- Table 6: Canada COVID-19 Safety and Prevention Products Revenue (Million) Forecast, by Application 2019 & 2032
- Table 7: Mexico COVID-19 Safety and Prevention Products Revenue (Million) Forecast, by Application 2019 & 2032
- Table 8: Global COVID-19 Safety and Prevention Products Revenue Million Forecast, by Country 2019 & 2032
- Table 9: Germany COVID-19 Safety and Prevention Products Revenue (Million) Forecast, by Application 2019 & 2032
- Table 10: United Kingdom COVID-19 Safety and Prevention Products Revenue (Million) Forecast, by Application 2019 & 2032
- Table 11: France COVID-19 Safety and Prevention Products Revenue (Million) Forecast, by Application 2019 & 2032
- Table 12: Spain COVID-19 Safety and Prevention Products Revenue (Million) Forecast, by Application 2019 & 2032
- Table 13: Italy COVID-19 Safety and Prevention Products Revenue (Million) Forecast, by Application 2019 & 2032
- Table 14: Spain COVID-19 Safety and Prevention Products Revenue (Million) Forecast, by Application 2019 & 2032
- Table 15: Belgium COVID-19 Safety and Prevention Products Revenue (Million) Forecast, by Application 2019 & 2032
- Table 16: Netherland COVID-19 Safety and Prevention Products Revenue (Million) Forecast, by Application 2019 & 2032
- Table 17: Nordics COVID-19 Safety and Prevention Products Revenue (Million) Forecast, by Application 2019 & 2032
- Table 18: Rest of Europe COVID-19 Safety and Prevention Products Revenue (Million) Forecast, by Application 2019 & 2032
- Table 19: Global COVID-19 Safety and Prevention Products Revenue Million Forecast, by Country 2019 & 2032
- Table 20: China COVID-19 Safety and Prevention Products Revenue (Million) Forecast, by Application 2019 & 2032
- Table 21: Japan COVID-19 Safety and Prevention Products Revenue (Million) Forecast, by Application 2019 & 2032
- Table 22: India COVID-19 Safety and Prevention Products Revenue (Million) Forecast, by Application 2019 & 2032
- Table 23: South Korea COVID-19 Safety and Prevention Products Revenue (Million) Forecast, by Application 2019 & 2032
- Table 24: Southeast Asia COVID-19 Safety and Prevention Products Revenue (Million) Forecast, by Application 2019 & 2032
- Table 25: Australia COVID-19 Safety and Prevention Products Revenue (Million) Forecast, by Application 2019 & 2032
- Table 26: Indonesia COVID-19 Safety and Prevention Products Revenue (Million) Forecast, by Application 2019 & 2032
- Table 27: Phillipes COVID-19 Safety and Prevention Products Revenue (Million) Forecast, by Application 2019 & 2032
- Table 28: Singapore COVID-19 Safety and Prevention Products Revenue (Million) Forecast, by Application 2019 & 2032
- Table 29: Thailandc COVID-19 Safety and Prevention Products Revenue (Million) Forecast, by Application 2019 & 2032
- Table 30: Rest of Asia Pacific COVID-19 Safety and Prevention Products Revenue (Million) Forecast, by Application 2019 & 2032
- Table 31: Global COVID-19 Safety and Prevention Products Revenue Million Forecast, by Country 2019 & 2032
- Table 32: Brazil COVID-19 Safety and Prevention Products Revenue (Million) Forecast, by Application 2019 & 2032
- Table 33: Argentina COVID-19 Safety and Prevention Products Revenue (Million) Forecast, by Application 2019 & 2032
- Table 34: Peru COVID-19 Safety and Prevention Products Revenue (Million) Forecast, by Application 2019 & 2032
- Table 35: Chile COVID-19 Safety and Prevention Products Revenue (Million) Forecast, by Application 2019 & 2032
- Table 36: Colombia COVID-19 Safety and Prevention Products Revenue (Million) Forecast, by Application 2019 & 2032
- Table 37: Ecuador COVID-19 Safety and Prevention Products Revenue (Million) Forecast, by Application 2019 & 2032
- Table 38: Venezuela COVID-19 Safety and Prevention Products Revenue (Million) Forecast, by Application 2019 & 2032
- Table 39: Rest of South America COVID-19 Safety and Prevention Products Revenue (Million) Forecast, by Application 2019 & 2032
- Table 40: Global COVID-19 Safety and Prevention Products Revenue Million Forecast, by Country 2019 & 2032
- Table 41: United States COVID-19 Safety and Prevention Products Revenue (Million) Forecast, by Application 2019 & 2032
- Table 42: Canada COVID-19 Safety and Prevention Products Revenue (Million) Forecast, by Application 2019 & 2032
- Table 43: Mexico COVID-19 Safety and Prevention Products Revenue (Million) Forecast, by Application 2019 & 2032
- Table 44: Global COVID-19 Safety and Prevention Products Revenue Million Forecast, by Country 2019 & 2032
- Table 45: United Arab Emirates COVID-19 Safety and Prevention Products Revenue (Million) Forecast, by Application 2019 & 2032
- Table 46: Saudi Arabia COVID-19 Safety and Prevention Products Revenue (Million) Forecast, by Application 2019 & 2032
- Table 47: South Africa COVID-19 Safety and Prevention Products Revenue (Million) Forecast, by Application 2019 & 2032
- Table 48: Rest of Middle East and Africa COVID-19 Safety and Prevention Products Revenue (Million) Forecast, by Application 2019 & 2032
- Table 49: Global COVID-19 Safety and Prevention Products Revenue Million Forecast, by Product/Equipment Type 2019 & 2032
- Table 50: Global COVID-19 Safety and Prevention Products Revenue Million Forecast, by Country 2019 & 2032
- Table 51: Global COVID-19 Safety and Prevention Products Revenue Million Forecast, by Product/Equipment Type 2019 & 2032
- Table 52: Global COVID-19 Safety and Prevention Products Revenue Million Forecast, by Country 2019 & 2032
- Table 53: Global COVID-19 Safety and Prevention Products Revenue Million Forecast, by Product/Equipment Type 2019 & 2032
- Table 54: Global COVID-19 Safety and Prevention Products Revenue Million Forecast, by Country 2019 & 2032
- Table 55: Global COVID-19 Safety and Prevention Products Revenue Million Forecast, by Product/Equipment Type 2019 & 2032
- Table 56: Global COVID-19 Safety and Prevention Products Revenue Million Forecast, by Country 2019 & 2032
Frequently Asked Questions
1. What is the projected Compound Annual Growth Rate (CAGR) of the COVID-19 Safety and Prevention Products?
The projected CAGR is approximately 7.20%.
2. Which companies are prominent players in the COVID-19 Safety and Prevention Products?
Key companies in the market include Sterisets International BV, Reckitt Benckiser Group PLC, Ansell Ltd, Medica Europe BV, HEYER Medical AG, Guangzhou Pidegree Medical Technology Co Ltd, Dynarex Corporation, Koninklijke Philips N V, Cardinal Health Inc, DUPONT de Nemours Inc, 3M Company, Medtronic PLC, A&D Company Limited*List Not Exhaustive, Shandong Yuyuan Latex Gloves Co Ltd, Shield Scientific, Microgen Hygiene Pvt Ltd, Procter & Gamble (P&G) Company, ResMed Inc, Smiths Medical Inc, Kimberly Clark Corporation.
3. What are the main segments of the COVID-19 Safety and Prevention Products?
The market segments include Product/Equipment Type.
4. Can you provide details about the market size?
The market size is estimated to be USD XX Million as of 2022.
5. What are some drivers contributing to market growth?
; Rising EXIM of Medical Grade Supplies; Reduced Tariff on Protective Equipment.
6. What are the notable trends driving market growth?
Ventilators to Record a Major Share of the Market Studied.
7. Are there any restraints impacting market growth?
; Inadequate Supply of Safety Products Creating a Price Pressure.
8. Can you provide examples of recent developments in the market?
N/A
9. What pricing options are available for accessing the report?
Pricing options include single-user, multi-user, and enterprise licenses priced at USD 4750, USD 5250, and USD 8750 respectively.
10. Is the market size provided in terms of value or volume?
The market size is provided in terms of value, measured in Million.
11. Are there any specific market keywords associated with the report?
Yes, the market keyword associated with the report is "COVID-19 Safety and Prevention Products," which aids in identifying and referencing the specific market segment covered.
12. How do I determine which pricing option suits my needs best?
The pricing options vary based on user requirements and access needs. Individual users may opt for single-user licenses, while businesses requiring broader access may choose multi-user or enterprise licenses for cost-effective access to the report.
13. Are there any additional resources or data provided in the COVID-19 Safety and Prevention Products report?
While the report offers comprehensive insights, it's advisable to review the specific contents or supplementary materials provided to ascertain if additional resources or data are available.
14. How can I stay updated on further developments or reports in the COVID-19 Safety and Prevention Products?
To stay informed about further developments, trends, and reports in the COVID-19 Safety and Prevention Products, consider subscribing to industry newsletters, following relevant companies and organizations, or regularly checking reputable industry news sources and publications.
Methodology
Step 1 - Identification of Relevant Samples Size from Population Database


Step 2 - Approaches for Defining Global Market Size (Value, Volume* & Price*)

Note*: In applicable scenarios
Step 3 - Data Sources
Primary Research
- Web Analytics
- Survey Reports
- Research Institute
- Latest Research Reports
- Opinion Leaders
Secondary Research
- Annual Reports
- White Paper
- Latest Press Release
- Industry Association
- Paid Database
- Investor Presentations

Step 4 - Data Triangulation
Involves using different sources of information in order to increase the validity of a study
These sources are likely to be stakeholders in a program - participants, other researchers, program staff, other community members, and so on.
Then we put all data in single framework & apply various statistical tools to find out the dynamic on the market.
During the analysis stage, feedback from the stakeholder groups would be compared to determine areas of agreement as well as areas of divergence
