

Key Insights
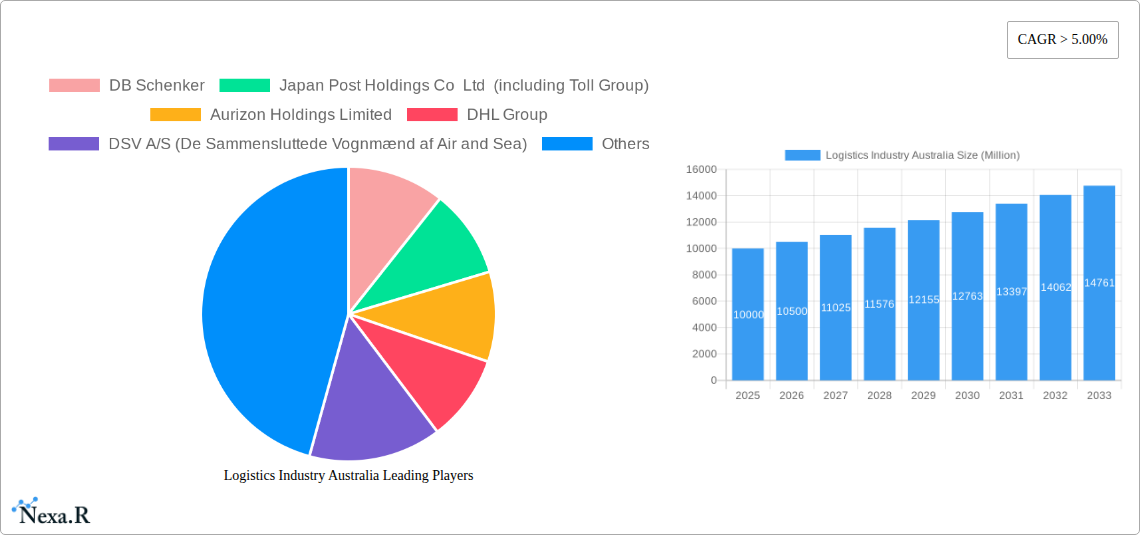
The Australian logistics industry is experiencing robust growth, projected to maintain a Compound Annual Growth Rate (CAGR) exceeding 5% from 2025 to 2033. This expansion is driven by several key factors. Firstly, Australia's burgeoning e-commerce sector fuels demand for efficient last-mile delivery and robust supply chain management. Secondly, the nation's significant resources sector, encompassing mining, oil and gas, and agriculture, necessitates extensive logistics solutions for transporting raw materials and finished products. Finally, government initiatives focused on infrastructure development and streamlining logistics processes contribute positively to market growth. Key segments within the market include temperature-controlled logistics, crucial for transporting perishable goods, and courier, express, and parcel (CEP) services, experiencing high demand due to e-commerce growth. Major players like DHL, FedEx, and Toll Group dominate the market, though smaller, specialized companies are also carving out successful niches. While challenges remain, such as fluctuations in fuel prices and potential workforce shortages, the overall outlook for the Australian logistics industry remains positive, with significant opportunities for growth across various segments and regions within the country.
The competitive landscape is characterized by a mix of international giants and domestic players. The presence of large multinational corporations indicates a mature and attractive market. However, the presence of several smaller and specialized businesses highlights opportunities for niche players to capitalize on specific market segments like sustainable logistics or specialized handling of certain goods. Geographic variations in market growth are anticipated, with regions experiencing stronger economic activity and population growth likely to show faster expansion. Further research into regional infrastructure investment and government policies will provide a more detailed understanding of these geographic nuances. The forecast for the next decade points to a continued need for technological advancements in areas like automation, data analytics, and sustainable practices to maintain efficiency and profitability in an increasingly competitive market.
Logistics Industry Australia: Market Report 2019-2033
This comprehensive report delivers an in-depth analysis of the Australian logistics industry, encompassing market dynamics, growth trends, key players, and future opportunities. With a focus on the period 2019-2033 (Base Year: 2025), this report provides crucial insights for businesses operating within or seeking to enter this dynamic sector. The report segments the market by end-user industry (Agriculture, Fishing & Forestry; Construction; Manufacturing; Oil & Gas; Mining & Quarrying; Wholesale & Retail Trade; Others) and logistics function (Courier, Express & Parcel (CEP); Temperature Controlled; Other Services), offering a granular view of market performance and growth potential. Expected market size values are presented in million units.
Logistics Industry Australia Market Dynamics & Structure
The Australian logistics market is characterized by a moderate level of concentration, with several large multinational players and a number of smaller, specialized operators. Technological innovation, driven by automation, data analytics, and the rise of e-commerce, is reshaping the industry landscape. Stringent regulatory frameworks, including safety and environmental regulations, influence operational costs and strategies. Competitive pressures from substitute services and emerging technologies are significant. The market also exhibits considerable end-user diversity, with varying demands across different sectors. M&A activity has been relatively high in recent years, driven by consolidation efforts and expansion strategies.
- Market Concentration: Moderate, with top 5 players holding an estimated xx% market share in 2025.
- Technological Innovation: Strong drivers include automation (robotics, AI), data analytics (predictive maintenance, route optimization), and the Internet of Things (IoT). Barriers include high initial investment costs and integration challenges.
- Regulatory Framework: Stringent safety and environmental regulations are in place, impacting operational costs and requiring compliance investments.
- Competitive Substitutes: Increased competition from digital freight platforms and specialized niche players.
- End-User Demographics: Diverse, with varying needs and demands across different sectors (e.g., temperature-controlled logistics for food and pharmaceuticals, bulk handling for mining).
- M&A Trends: Significant activity in recent years, driven by consolidation and expansion; approximately xx deals completed between 2019 and 2024, with a total value of xx million.
Logistics Industry Australia Growth Trends & Insights
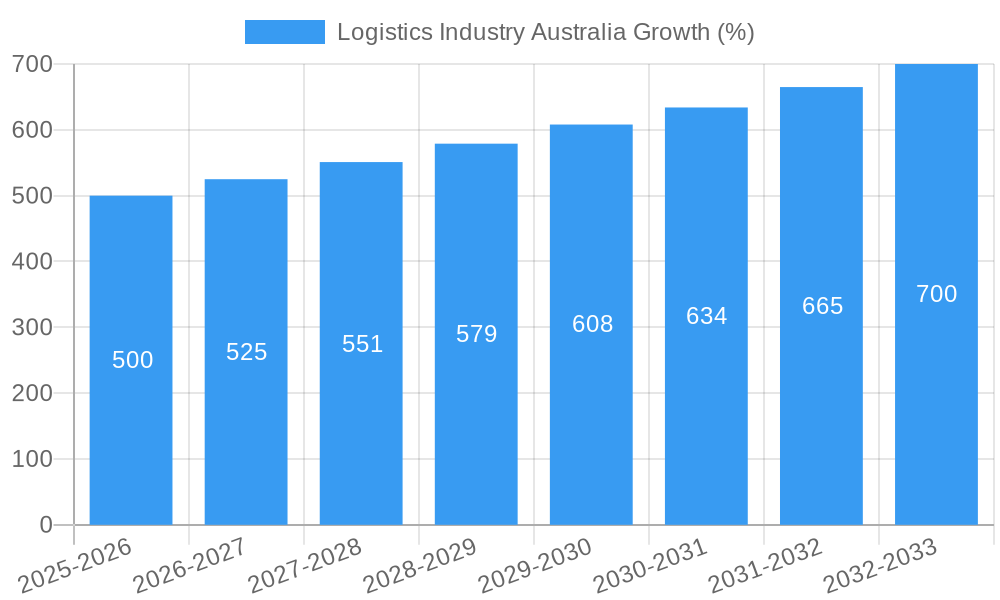
The Australian logistics market is projected to experience robust growth over the forecast period (2025-2033). Driven by factors such as increasing e-commerce penetration, rising consumer demand, and infrastructural development, the market is expected to achieve a CAGR of xx% during this period. Technological disruptions, particularly the adoption of automation and digitalization, are accelerating efficiency gains and transforming operational models. Shifts in consumer behavior, towards greater convenience and faster delivery, are placing additional pressure on logistics providers to adapt and innovate. Market size is expected to reach xx million by 2033 from xx million in 2025.
(Note: This section requires data (XXX) to populate the specific metrics and detailed analysis.)
Dominant Regions, Countries, or Segments in Logistics Industry Australia
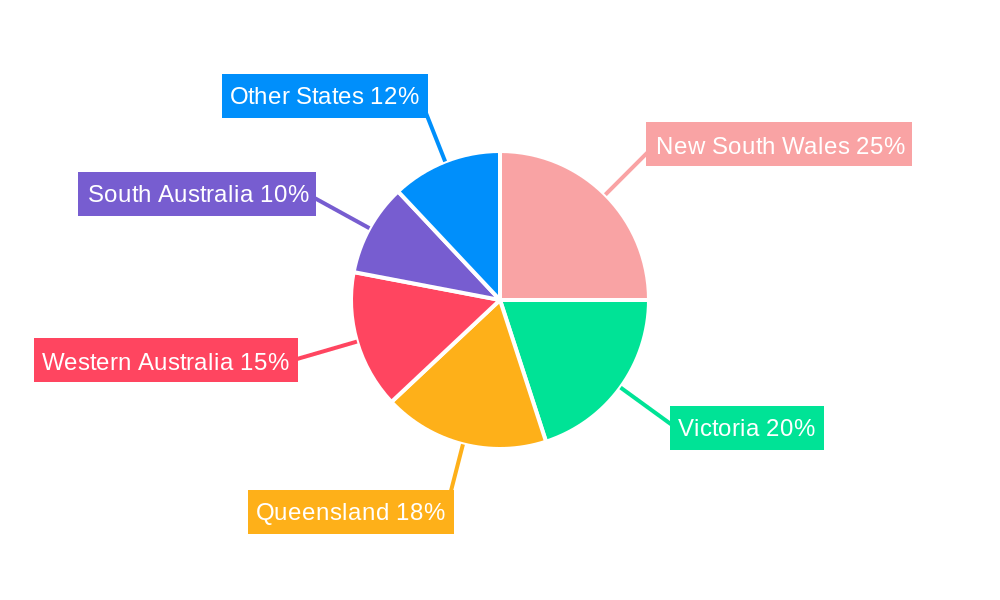
The major metropolitan areas (Sydney, Melbourne, Brisbane) dominate the Australian logistics market, due to their higher population density, economic activity, and infrastructure development. Within the end-user industry segment, Wholesale and Retail Trade is the largest, fueled by e-commerce growth, while Mining & Quarrying and Oil & Gas exhibit high growth potential driven by resource exports. In terms of logistics functions, Courier, Express, and Parcel (CEP) represents the largest segment, followed by Temperature Controlled.
Key Drivers:
- Economic Growth: Strong economic activity in major cities fuels demand for logistics services.
- E-commerce Boom: Rapid growth in online retail drives demand for last-mile delivery and efficient warehousing solutions.
- Infrastructure Investments: Government investments in transportation networks (roads, ports, rail) enhance logistics efficiency.
- Resource Exports: Significant reliance on resource exports boosts demand for specialized transportation and logistics.
Dominance Factors:
- Market Share: Wholesale and Retail Trade accounts for an estimated xx% of the total market in 2025.
- Growth Potential: Mining & Quarrying and Oil & Gas sectors are projected to experience the highest growth rates over the forecast period.
Logistics Industry Australia Product Landscape
The Australian logistics market is witnessing significant product innovation, driven by technological advancements. This includes the adoption of advanced tracking and monitoring systems, automated warehousing solutions, and route optimization software. Many providers are incorporating sustainability measures, such as electric vehicles and optimized delivery routes, into their offerings. Key performance indicators (KPIs) are focusing on speed, efficiency, traceability, and environmental impact. The unique selling propositions are revolving around speed, reliability, technology integration, and sustainability.
Key Drivers, Barriers & Challenges in Logistics Industry Australia
Key Drivers: Technological advancements (automation, AI, IoT), rising e-commerce, government infrastructure investment, and increasing demand from resource sectors.
Key Challenges: Driver shortages, rising fuel costs (impact on profitability estimated at xx million annually in 2025), supply chain disruptions (estimated xx% increase in lead times in 2024), and increasing regulatory compliance costs (estimated at xx million in additional compliance expenditure in 2025).
Emerging Opportunities in Logistics Industry Australia
Emerging opportunities include the growth of last-mile delivery solutions catering to the rise of e-commerce, increasing demand for specialized logistics for temperature-sensitive goods (pharmaceuticals, food), and the adoption of sustainable practices, such as electric vehicles and carbon-neutral initiatives.
Growth Accelerators in the Logistics Industry Australia Industry
Technological innovation, strategic partnerships between logistics providers and technology companies, and expansion into niche markets (e.g., cold chain logistics, hazardous materials handling) are key growth catalysts. The focus on building stronger digital supply chains and enhancing sustainability efforts are expected to accelerate industry growth in the long term.
Key Players Shaping the Logistics Industry Australia Market
- DB Schenker
- Japan Post Holdings Co Ltd (including Toll Group)
- Aurizon Holdings Limited
- DHL Group
- DSV A/S (De Sammensluttede Vognmænd af Air and Sea)
- FedEx
- Qube Holdings Ltd
- LINX Cargo Care Group
- Kuehne + Nagel
- Linfox Pty Ltd
- K&S Corporation Limited
- Toll Grou
- Centurion Transport
Notable Milestones in Logistics Industry Australia Sector
- January 2024: DHL Express boosts Asia-Pacific to Americas connectivity with new Boeing 777 freighters.
- January 2024: Kuehne + Nagel launches Book & Claim insetting solution for electric vehicles, enhancing decarbonization efforts.
- February 2024: DHL Supply Chain expands its Australian electric vehicle fleet, supporting domestic EV manufacturing.
In-Depth Logistics Industry Australia Market Outlook
The Australian logistics market is poised for continued expansion, driven by technological advancements, robust economic growth, and increasing e-commerce penetration. Strategic opportunities exist for companies focusing on sustainable practices, technological innovation, and specialization in niche market segments. The market’s future potential is significant, offering attractive returns for businesses that can adapt and innovate in response to the evolving demands of the industry.
Logistics Industry Australia Segmentation
-
1. End User Industry
- 1.1. Agriculture, Fishing, and Forestry
- 1.2. Construction
- 1.3. Manufacturing
- 1.4. Oil and Gas, Mining and Quarrying
- 1.5. Wholesale and Retail Trade
- 1.6. Others
-
2. Logistics Function
-
2.1. Courier, Express, and Parcel (CEP)
-
2.1.1. By Destination Type
- 2.1.1.1. Domestic
- 2.1.1.2. International
-
2.1.1. By Destination Type
-
2.2. Freight Forwarding
-
2.2.1. By Mode Of Transport
- 2.2.1.1. Air
- 2.2.1.2. Sea and Inland Waterways
- 2.2.1.3. Others
-
2.2.1. By Mode Of Transport
-
2.3. Freight Transport
- 2.3.1. Pipelines
- 2.3.2. Rail
- 2.3.3. Road
-
2.4. Warehousing and Storage
-
2.4.1. By Temperature Control
- 2.4.1.1. Non-Temperature Controlled
-
2.4.1. By Temperature Control
- 2.5. Other Services
-
2.1. Courier, Express, and Parcel (CEP)
Logistics Industry Australia Segmentation By Geography
-
1. North America
- 1.1. United States
- 1.2. Canada
- 1.3. Mexico
-
2. South America
- 2.1. Brazil
- 2.2. Argentina
- 2.3. Rest of South America
-
3. Europe
- 3.1. United Kingdom
- 3.2. Germany
- 3.3. France
- 3.4. Italy
- 3.5. Spain
- 3.6. Russia
- 3.7. Benelux
- 3.8. Nordics
- 3.9. Rest of Europe
-
4. Middle East & Africa
- 4.1. Turkey
- 4.2. Israel
- 4.3. GCC
- 4.4. North Africa
- 4.5. South Africa
- 4.6. Rest of Middle East & Africa
-
5. Asia Pacific
- 5.1. China
- 5.2. India
- 5.3. Japan
- 5.4. South Korea
- 5.5. ASEAN
- 5.6. Oceania
- 5.7. Rest of Asia Pacific
Logistics Industry Australia REPORT HIGHLIGHTS
| Aspects | Details |
|---|---|
| Study Period | 2019-2033 |
| Base Year | 2024 |
| Estimated Year | 2025 |
| Forecast Period | 2025-2033 |
| Historical Period | 2019-2024 |
| Growth Rate | CAGR of > 5.00% from 2019-2033 |
| Segmentation |
|
Table of Contents
- 1. Introduction
- 1.1. Research Scope
- 1.2. Market Segmentation
- 1.3. Research Methodology
- 1.4. Definitions and Assumptions
- 2. Executive Summary
- 2.1. Introduction
- 3. Market Dynamics
- 3.1. Introduction
- 3.2. Market Drivers
- 3.2.1. 4.; Increase demand of Petrochemical is driving the market4.; Increase in Investments is driving the market
- 3.3. Market Restrains
- 3.3.1. 4.; High Cost of Operations
- 3.4. Market Trends
- 3.4.1. OTHER KEY INDUSTRY TRENDS COVERED IN THE REPORT
- 4. Market Factor Analysis
- 4.1. Porters Five Forces
- 4.2. Supply/Value Chain
- 4.3. PESTEL analysis
- 4.4. Market Entropy
- 4.5. Patent/Trademark Analysis
- 5. Global Logistics Industry Australia Analysis, Insights and Forecast, 2019-2031
- 5.1. Market Analysis, Insights and Forecast - by End User Industry
- 5.1.1. Agriculture, Fishing, and Forestry
- 5.1.2. Construction
- 5.1.3. Manufacturing
- 5.1.4. Oil and Gas, Mining and Quarrying
- 5.1.5. Wholesale and Retail Trade
- 5.1.6. Others
- 5.2. Market Analysis, Insights and Forecast - by Logistics Function
- 5.2.1. Courier, Express, and Parcel (CEP)
- 5.2.1.1. By Destination Type
- 5.2.1.1.1. Domestic
- 5.2.1.1.2. International
- 5.2.1.1. By Destination Type
- 5.2.2. Freight Forwarding
- 5.2.2.1. By Mode Of Transport
- 5.2.2.1.1. Air
- 5.2.2.1.2. Sea and Inland Waterways
- 5.2.2.1.3. Others
- 5.2.2.1. By Mode Of Transport
- 5.2.3. Freight Transport
- 5.2.3.1. Pipelines
- 5.2.3.2. Rail
- 5.2.3.3. Road
- 5.2.4. Warehousing and Storage
- 5.2.4.1. By Temperature Control
- 5.2.4.1.1. Non-Temperature Controlled
- 5.2.4.1. By Temperature Control
- 5.2.5. Other Services
- 5.2.1. Courier, Express, and Parcel (CEP)
- 5.3. Market Analysis, Insights and Forecast - by Region
- 5.3.1. North America
- 5.3.2. South America
- 5.3.3. Europe
- 5.3.4. Middle East & Africa
- 5.3.5. Asia Pacific
- 5.1. Market Analysis, Insights and Forecast - by End User Industry
- 6. North America Logistics Industry Australia Analysis, Insights and Forecast, 2019-2031
- 6.1. Market Analysis, Insights and Forecast - by End User Industry
- 6.1.1. Agriculture, Fishing, and Forestry
- 6.1.2. Construction
- 6.1.3. Manufacturing
- 6.1.4. Oil and Gas, Mining and Quarrying
- 6.1.5. Wholesale and Retail Trade
- 6.1.6. Others
- 6.2. Market Analysis, Insights and Forecast - by Logistics Function
- 6.2.1. Courier, Express, and Parcel (CEP)
- 6.2.1.1. By Destination Type
- 6.2.1.1.1. Domestic
- 6.2.1.1.2. International
- 6.2.1.1. By Destination Type
- 6.2.2. Freight Forwarding
- 6.2.2.1. By Mode Of Transport
- 6.2.2.1.1. Air
- 6.2.2.1.2. Sea and Inland Waterways
- 6.2.2.1.3. Others
- 6.2.2.1. By Mode Of Transport
- 6.2.3. Freight Transport
- 6.2.3.1. Pipelines
- 6.2.3.2. Rail
- 6.2.3.3. Road
- 6.2.4. Warehousing and Storage
- 6.2.4.1. By Temperature Control
- 6.2.4.1.1. Non-Temperature Controlled
- 6.2.4.1. By Temperature Control
- 6.2.5. Other Services
- 6.2.1. Courier, Express, and Parcel (CEP)
- 6.1. Market Analysis, Insights and Forecast - by End User Industry
- 7. South America Logistics Industry Australia Analysis, Insights and Forecast, 2019-2031
- 7.1. Market Analysis, Insights and Forecast - by End User Industry
- 7.1.1. Agriculture, Fishing, and Forestry
- 7.1.2. Construction
- 7.1.3. Manufacturing
- 7.1.4. Oil and Gas, Mining and Quarrying
- 7.1.5. Wholesale and Retail Trade
- 7.1.6. Others
- 7.2. Market Analysis, Insights and Forecast - by Logistics Function
- 7.2.1. Courier, Express, and Parcel (CEP)
- 7.2.1.1. By Destination Type
- 7.2.1.1.1. Domestic
- 7.2.1.1.2. International
- 7.2.1.1. By Destination Type
- 7.2.2. Freight Forwarding
- 7.2.2.1. By Mode Of Transport
- 7.2.2.1.1. Air
- 7.2.2.1.2. Sea and Inland Waterways
- 7.2.2.1.3. Others
- 7.2.2.1. By Mode Of Transport
- 7.2.3. Freight Transport
- 7.2.3.1. Pipelines
- 7.2.3.2. Rail
- 7.2.3.3. Road
- 7.2.4. Warehousing and Storage
- 7.2.4.1. By Temperature Control
- 7.2.4.1.1. Non-Temperature Controlled
- 7.2.4.1. By Temperature Control
- 7.2.5. Other Services
- 7.2.1. Courier, Express, and Parcel (CEP)
- 7.1. Market Analysis, Insights and Forecast - by End User Industry
- 8. Europe Logistics Industry Australia Analysis, Insights and Forecast, 2019-2031
- 8.1. Market Analysis, Insights and Forecast - by End User Industry
- 8.1.1. Agriculture, Fishing, and Forestry
- 8.1.2. Construction
- 8.1.3. Manufacturing
- 8.1.4. Oil and Gas, Mining and Quarrying
- 8.1.5. Wholesale and Retail Trade
- 8.1.6. Others
- 8.2. Market Analysis, Insights and Forecast - by Logistics Function
- 8.2.1. Courier, Express, and Parcel (CEP)
- 8.2.1.1. By Destination Type
- 8.2.1.1.1. Domestic
- 8.2.1.1.2. International
- 8.2.1.1. By Destination Type
- 8.2.2. Freight Forwarding
- 8.2.2.1. By Mode Of Transport
- 8.2.2.1.1. Air
- 8.2.2.1.2. Sea and Inland Waterways
- 8.2.2.1.3. Others
- 8.2.2.1. By Mode Of Transport
- 8.2.3. Freight Transport
- 8.2.3.1. Pipelines
- 8.2.3.2. Rail
- 8.2.3.3. Road
- 8.2.4. Warehousing and Storage
- 8.2.4.1. By Temperature Control
- 8.2.4.1.1. Non-Temperature Controlled
- 8.2.4.1. By Temperature Control
- 8.2.5. Other Services
- 8.2.1. Courier, Express, and Parcel (CEP)
- 8.1. Market Analysis, Insights and Forecast - by End User Industry
- 9. Middle East & Africa Logistics Industry Australia Analysis, Insights and Forecast, 2019-2031
- 9.1. Market Analysis, Insights and Forecast - by End User Industry
- 9.1.1. Agriculture, Fishing, and Forestry
- 9.1.2. Construction
- 9.1.3. Manufacturing
- 9.1.4. Oil and Gas, Mining and Quarrying
- 9.1.5. Wholesale and Retail Trade
- 9.1.6. Others
- 9.2. Market Analysis, Insights and Forecast - by Logistics Function
- 9.2.1. Courier, Express, and Parcel (CEP)
- 9.2.1.1. By Destination Type
- 9.2.1.1.1. Domestic
- 9.2.1.1.2. International
- 9.2.1.1. By Destination Type
- 9.2.2. Freight Forwarding
- 9.2.2.1. By Mode Of Transport
- 9.2.2.1.1. Air
- 9.2.2.1.2. Sea and Inland Waterways
- 9.2.2.1.3. Others
- 9.2.2.1. By Mode Of Transport
- 9.2.3. Freight Transport
- 9.2.3.1. Pipelines
- 9.2.3.2. Rail
- 9.2.3.3. Road
- 9.2.4. Warehousing and Storage
- 9.2.4.1. By Temperature Control
- 9.2.4.1.1. Non-Temperature Controlled
- 9.2.4.1. By Temperature Control
- 9.2.5. Other Services
- 9.2.1. Courier, Express, and Parcel (CEP)
- 9.1. Market Analysis, Insights and Forecast - by End User Industry
- 10. Asia Pacific Logistics Industry Australia Analysis, Insights and Forecast, 2019-2031
- 10.1. Market Analysis, Insights and Forecast - by End User Industry
- 10.1.1. Agriculture, Fishing, and Forestry
- 10.1.2. Construction
- 10.1.3. Manufacturing
- 10.1.4. Oil and Gas, Mining and Quarrying
- 10.1.5. Wholesale and Retail Trade
- 10.1.6. Others
- 10.2. Market Analysis, Insights and Forecast - by Logistics Function
- 10.2.1. Courier, Express, and Parcel (CEP)
- 10.2.1.1. By Destination Type
- 10.2.1.1.1. Domestic
- 10.2.1.1.2. International
- 10.2.1.1. By Destination Type
- 10.2.2. Freight Forwarding
- 10.2.2.1. By Mode Of Transport
- 10.2.2.1.1. Air
- 10.2.2.1.2. Sea and Inland Waterways
- 10.2.2.1.3. Others
- 10.2.2.1. By Mode Of Transport
- 10.2.3. Freight Transport
- 10.2.3.1. Pipelines
- 10.2.3.2. Rail
- 10.2.3.3. Road
- 10.2.4. Warehousing and Storage
- 10.2.4.1. By Temperature Control
- 10.2.4.1.1. Non-Temperature Controlled
- 10.2.4.1. By Temperature Control
- 10.2.5. Other Services
- 10.2.1. Courier, Express, and Parcel (CEP)
- 10.1. Market Analysis, Insights and Forecast - by End User Industry
- 11. Competitive Analysis
- 11.1. Global Market Share Analysis 2024
- 11.2. Company Profiles
- 11.2.1 DB Schenker
- 11.2.1.1. Overview
- 11.2.1.2. Products
- 11.2.1.3. SWOT Analysis
- 11.2.1.4. Recent Developments
- 11.2.1.5. Financials (Based on Availability)
- 11.2.2 Japan Post Holdings Co Ltd (including Toll Group)
- 11.2.2.1. Overview
- 11.2.2.2. Products
- 11.2.2.3. SWOT Analysis
- 11.2.2.4. Recent Developments
- 11.2.2.5. Financials (Based on Availability)
- 11.2.3 Aurizon Holdings Limited
- 11.2.3.1. Overview
- 11.2.3.2. Products
- 11.2.3.3. SWOT Analysis
- 11.2.3.4. Recent Developments
- 11.2.3.5. Financials (Based on Availability)
- 11.2.4 DHL Group
- 11.2.4.1. Overview
- 11.2.4.2. Products
- 11.2.4.3. SWOT Analysis
- 11.2.4.4. Recent Developments
- 11.2.4.5. Financials (Based on Availability)
- 11.2.5 DSV A/S (De Sammensluttede Vognmænd af Air and Sea)
- 11.2.5.1. Overview
- 11.2.5.2. Products
- 11.2.5.3. SWOT Analysis
- 11.2.5.4. Recent Developments
- 11.2.5.5. Financials (Based on Availability)
- 11.2.6 FedEx
- 11.2.6.1. Overview
- 11.2.6.2. Products
- 11.2.6.3. SWOT Analysis
- 11.2.6.4. Recent Developments
- 11.2.6.5. Financials (Based on Availability)
- 11.2.7 Qube Holdings Ltd
- 11.2.7.1. Overview
- 11.2.7.2. Products
- 11.2.7.3. SWOT Analysis
- 11.2.7.4. Recent Developments
- 11.2.7.5. Financials (Based on Availability)
- 11.2.8 LINX Cargo Care Group
- 11.2.8.1. Overview
- 11.2.8.2. Products
- 11.2.8.3. SWOT Analysis
- 11.2.8.4. Recent Developments
- 11.2.8.5. Financials (Based on Availability)
- 11.2.9 Kuehne + Nagel
- 11.2.9.1. Overview
- 11.2.9.2. Products
- 11.2.9.3. SWOT Analysis
- 11.2.9.4. Recent Developments
- 11.2.9.5. Financials (Based on Availability)
- 11.2.10 Linfox Pty Ltd
- 11.2.10.1. Overview
- 11.2.10.2. Products
- 11.2.10.3. SWOT Analysis
- 11.2.10.4. Recent Developments
- 11.2.10.5. Financials (Based on Availability)
- 11.2.11 K&S Corporation Limited
- 11.2.11.1. Overview
- 11.2.11.2. Products
- 11.2.11.3. SWOT Analysis
- 11.2.11.4. Recent Developments
- 11.2.11.5. Financials (Based on Availability)
- 11.2.12 Toll Grou
- 11.2.12.1. Overview
- 11.2.12.2. Products
- 11.2.12.3. SWOT Analysis
- 11.2.12.4. Recent Developments
- 11.2.12.5. Financials (Based on Availability)
- 11.2.13 Centurion Transport
- 11.2.13.1. Overview
- 11.2.13.2. Products
- 11.2.13.3. SWOT Analysis
- 11.2.13.4. Recent Developments
- 11.2.13.5. Financials (Based on Availability)
- 11.2.1 DB Schenker
List of Figures
- Figure 1: Global Logistics Industry Australia Revenue Breakdown (Million, %) by Region 2024 & 2032
- Figure 2: Australia Logistics Industry Australia Revenue (Million), by Country 2024 & 2032
- Figure 3: Australia Logistics Industry Australia Revenue Share (%), by Country 2024 & 2032
- Figure 4: North America Logistics Industry Australia Revenue (Million), by End User Industry 2024 & 2032
- Figure 5: North America Logistics Industry Australia Revenue Share (%), by End User Industry 2024 & 2032
- Figure 6: North America Logistics Industry Australia Revenue (Million), by Logistics Function 2024 & 2032
- Figure 7: North America Logistics Industry Australia Revenue Share (%), by Logistics Function 2024 & 2032
- Figure 8: North America Logistics Industry Australia Revenue (Million), by Country 2024 & 2032
- Figure 9: North America Logistics Industry Australia Revenue Share (%), by Country 2024 & 2032
- Figure 10: South America Logistics Industry Australia Revenue (Million), by End User Industry 2024 & 2032
- Figure 11: South America Logistics Industry Australia Revenue Share (%), by End User Industry 2024 & 2032
- Figure 12: South America Logistics Industry Australia Revenue (Million), by Logistics Function 2024 & 2032
- Figure 13: South America Logistics Industry Australia Revenue Share (%), by Logistics Function 2024 & 2032
- Figure 14: South America Logistics Industry Australia Revenue (Million), by Country 2024 & 2032
- Figure 15: South America Logistics Industry Australia Revenue Share (%), by Country 2024 & 2032
- Figure 16: Europe Logistics Industry Australia Revenue (Million), by End User Industry 2024 & 2032
- Figure 17: Europe Logistics Industry Australia Revenue Share (%), by End User Industry 2024 & 2032
- Figure 18: Europe Logistics Industry Australia Revenue (Million), by Logistics Function 2024 & 2032
- Figure 19: Europe Logistics Industry Australia Revenue Share (%), by Logistics Function 2024 & 2032
- Figure 20: Europe Logistics Industry Australia Revenue (Million), by Country 2024 & 2032
- Figure 21: Europe Logistics Industry Australia Revenue Share (%), by Country 2024 & 2032
- Figure 22: Middle East & Africa Logistics Industry Australia Revenue (Million), by End User Industry 2024 & 2032
- Figure 23: Middle East & Africa Logistics Industry Australia Revenue Share (%), by End User Industry 2024 & 2032
- Figure 24: Middle East & Africa Logistics Industry Australia Revenue (Million), by Logistics Function 2024 & 2032
- Figure 25: Middle East & Africa Logistics Industry Australia Revenue Share (%), by Logistics Function 2024 & 2032
- Figure 26: Middle East & Africa Logistics Industry Australia Revenue (Million), by Country 2024 & 2032
- Figure 27: Middle East & Africa Logistics Industry Australia Revenue Share (%), by Country 2024 & 2032
- Figure 28: Asia Pacific Logistics Industry Australia Revenue (Million), by End User Industry 2024 & 2032
- Figure 29: Asia Pacific Logistics Industry Australia Revenue Share (%), by End User Industry 2024 & 2032
- Figure 30: Asia Pacific Logistics Industry Australia Revenue (Million), by Logistics Function 2024 & 2032
- Figure 31: Asia Pacific Logistics Industry Australia Revenue Share (%), by Logistics Function 2024 & 2032
- Figure 32: Asia Pacific Logistics Industry Australia Revenue (Million), by Country 2024 & 2032
- Figure 33: Asia Pacific Logistics Industry Australia Revenue Share (%), by Country 2024 & 2032
List of Tables
- Table 1: Global Logistics Industry Australia Revenue Million Forecast, by Region 2019 & 2032
- Table 2: Global Logistics Industry Australia Revenue Million Forecast, by End User Industry 2019 & 2032
- Table 3: Global Logistics Industry Australia Revenue Million Forecast, by Logistics Function 2019 & 2032
- Table 4: Global Logistics Industry Australia Revenue Million Forecast, by Region 2019 & 2032
- Table 5: Global Logistics Industry Australia Revenue Million Forecast, by Country 2019 & 2032
- Table 6: Global Logistics Industry Australia Revenue Million Forecast, by End User Industry 2019 & 2032
- Table 7: Global Logistics Industry Australia Revenue Million Forecast, by Logistics Function 2019 & 2032
- Table 8: Global Logistics Industry Australia Revenue Million Forecast, by Country 2019 & 2032
- Table 9: United States Logistics Industry Australia Revenue (Million) Forecast, by Application 2019 & 2032
- Table 10: Canada Logistics Industry Australia Revenue (Million) Forecast, by Application 2019 & 2032
- Table 11: Mexico Logistics Industry Australia Revenue (Million) Forecast, by Application 2019 & 2032
- Table 12: Global Logistics Industry Australia Revenue Million Forecast, by End User Industry 2019 & 2032
- Table 13: Global Logistics Industry Australia Revenue Million Forecast, by Logistics Function 2019 & 2032
- Table 14: Global Logistics Industry Australia Revenue Million Forecast, by Country 2019 & 2032
- Table 15: Brazil Logistics Industry Australia Revenue (Million) Forecast, by Application 2019 & 2032
- Table 16: Argentina Logistics Industry Australia Revenue (Million) Forecast, by Application 2019 & 2032
- Table 17: Rest of South America Logistics Industry Australia Revenue (Million) Forecast, by Application 2019 & 2032
- Table 18: Global Logistics Industry Australia Revenue Million Forecast, by End User Industry 2019 & 2032
- Table 19: Global Logistics Industry Australia Revenue Million Forecast, by Logistics Function 2019 & 2032
- Table 20: Global Logistics Industry Australia Revenue Million Forecast, by Country 2019 & 2032
- Table 21: United Kingdom Logistics Industry Australia Revenue (Million) Forecast, by Application 2019 & 2032
- Table 22: Germany Logistics Industry Australia Revenue (Million) Forecast, by Application 2019 & 2032
- Table 23: France Logistics Industry Australia Revenue (Million) Forecast, by Application 2019 & 2032
- Table 24: Italy Logistics Industry Australia Revenue (Million) Forecast, by Application 2019 & 2032
- Table 25: Spain Logistics Industry Australia Revenue (Million) Forecast, by Application 2019 & 2032
- Table 26: Russia Logistics Industry Australia Revenue (Million) Forecast, by Application 2019 & 2032
- Table 27: Benelux Logistics Industry Australia Revenue (Million) Forecast, by Application 2019 & 2032
- Table 28: Nordics Logistics Industry Australia Revenue (Million) Forecast, by Application 2019 & 2032
- Table 29: Rest of Europe Logistics Industry Australia Revenue (Million) Forecast, by Application 2019 & 2032
- Table 30: Global Logistics Industry Australia Revenue Million Forecast, by End User Industry 2019 & 2032
- Table 31: Global Logistics Industry Australia Revenue Million Forecast, by Logistics Function 2019 & 2032
- Table 32: Global Logistics Industry Australia Revenue Million Forecast, by Country 2019 & 2032
- Table 33: Turkey Logistics Industry Australia Revenue (Million) Forecast, by Application 2019 & 2032
- Table 34: Israel Logistics Industry Australia Revenue (Million) Forecast, by Application 2019 & 2032
- Table 35: GCC Logistics Industry Australia Revenue (Million) Forecast, by Application 2019 & 2032
- Table 36: North Africa Logistics Industry Australia Revenue (Million) Forecast, by Application 2019 & 2032
- Table 37: South Africa Logistics Industry Australia Revenue (Million) Forecast, by Application 2019 & 2032
- Table 38: Rest of Middle East & Africa Logistics Industry Australia Revenue (Million) Forecast, by Application 2019 & 2032
- Table 39: Global Logistics Industry Australia Revenue Million Forecast, by End User Industry 2019 & 2032
- Table 40: Global Logistics Industry Australia Revenue Million Forecast, by Logistics Function 2019 & 2032
- Table 41: Global Logistics Industry Australia Revenue Million Forecast, by Country 2019 & 2032
- Table 42: China Logistics Industry Australia Revenue (Million) Forecast, by Application 2019 & 2032
- Table 43: India Logistics Industry Australia Revenue (Million) Forecast, by Application 2019 & 2032
- Table 44: Japan Logistics Industry Australia Revenue (Million) Forecast, by Application 2019 & 2032
- Table 45: South Korea Logistics Industry Australia Revenue (Million) Forecast, by Application 2019 & 2032
- Table 46: ASEAN Logistics Industry Australia Revenue (Million) Forecast, by Application 2019 & 2032
- Table 47: Oceania Logistics Industry Australia Revenue (Million) Forecast, by Application 2019 & 2032
- Table 48: Rest of Asia Pacific Logistics Industry Australia Revenue (Million) Forecast, by Application 2019 & 2032
Frequently Asked Questions
1. What is the projected Compound Annual Growth Rate (CAGR) of the Logistics Industry Australia?
The projected CAGR is approximately > 5.00%.
2. Which companies are prominent players in the Logistics Industry Australia?
Key companies in the market include DB Schenker, Japan Post Holdings Co Ltd (including Toll Group), Aurizon Holdings Limited, DHL Group, DSV A/S (De Sammensluttede Vognmænd af Air and Sea), FedEx, Qube Holdings Ltd, LINX Cargo Care Group, Kuehne + Nagel, Linfox Pty Ltd, K&S Corporation Limited, Toll Grou, Centurion Transport.
3. What are the main segments of the Logistics Industry Australia?
The market segments include End User Industry, Logistics Function.
4. Can you provide details about the market size?
The market size is estimated to be USD XX Million as of 2022.
5. What are some drivers contributing to market growth?
4.; Increase demand of Petrochemical is driving the market4.; Increase in Investments is driving the market.
6. What are the notable trends driving market growth?
OTHER KEY INDUSTRY TRENDS COVERED IN THE REPORT.
7. Are there any restraints impacting market growth?
4.; High Cost of Operations.
8. Can you provide examples of recent developments in the market?
February 2024: DHL Supply Chain (DHL) is continuing the decarbonization of its Australian transport fleet by introducing additional new electric vehicles. The company has added two Terberg YT200EV electric yard tractors to its truck fleet and is supporting Australian electric vehicle manufacturing with the introduction of its first SEA Electric light duty truck to its last-mile fleet.January 2024: DHL Express has commenced services for the final Boeing 777 freighter deployed at the South Asia Hub in Singapore. With a payload capability of 102 tons, the aircraft joins the four other Boeing 777 freighters already deployed in Singapore to boost inter-continental connectivity between the Asia Pacific and the Americas. Sporting a dual DHL-Singapore Airlines (SIA) livery, these five freighters provide a total of 1,224 tons of payload capacity to meet growing customer demand for international express shipping services.January 2024: Kuehne + Nagel has announced its Book & Claim insetting solution for electric vehicles, to improve its decarbonization solutions. Developing Book & Claim insetting solutions for road freight was a strategic priority for Kuehne + Nagel. Customers who use Kuehne + Nagel's road transport services can now claim the carbon reductions of electric trucks when it is not possible to physically move their goods on these vehicles.
9. What pricing options are available for accessing the report?
Pricing options include single-user, multi-user, and enterprise licenses priced at USD 3800, USD 4500, and USD 5800 respectively.
10. Is the market size provided in terms of value or volume?
The market size is provided in terms of value, measured in Million.
11. Are there any specific market keywords associated with the report?
Yes, the market keyword associated with the report is "Logistics Industry Australia," which aids in identifying and referencing the specific market segment covered.
12. How do I determine which pricing option suits my needs best?
The pricing options vary based on user requirements and access needs. Individual users may opt for single-user licenses, while businesses requiring broader access may choose multi-user or enterprise licenses for cost-effective access to the report.
13. Are there any additional resources or data provided in the Logistics Industry Australia report?
While the report offers comprehensive insights, it's advisable to review the specific contents or supplementary materials provided to ascertain if additional resources or data are available.
14. How can I stay updated on further developments or reports in the Logistics Industry Australia?
To stay informed about further developments, trends, and reports in the Logistics Industry Australia, consider subscribing to industry newsletters, following relevant companies and organizations, or regularly checking reputable industry news sources and publications.
Methodology
Step 1 - Identification of Relevant Samples Size from Population Database


Step 2 - Approaches for Defining Global Market Size (Value, Volume* & Price*)

Note*: In applicable scenarios
Step 3 - Data Sources
Primary Research
- Web Analytics
- Survey Reports
- Research Institute
- Latest Research Reports
- Opinion Leaders
Secondary Research
- Annual Reports
- White Paper
- Latest Press Release
- Industry Association
- Paid Database
- Investor Presentations

Step 4 - Data Triangulation
Involves using different sources of information in order to increase the validity of a study
These sources are likely to be stakeholders in a program - participants, other researchers, program staff, other community members, and so on.
Then we put all data in single framework & apply various statistical tools to find out the dynamic on the market.
During the analysis stage, feedback from the stakeholder groups would be compared to determine areas of agreement as well as areas of divergence
