

Key Insights
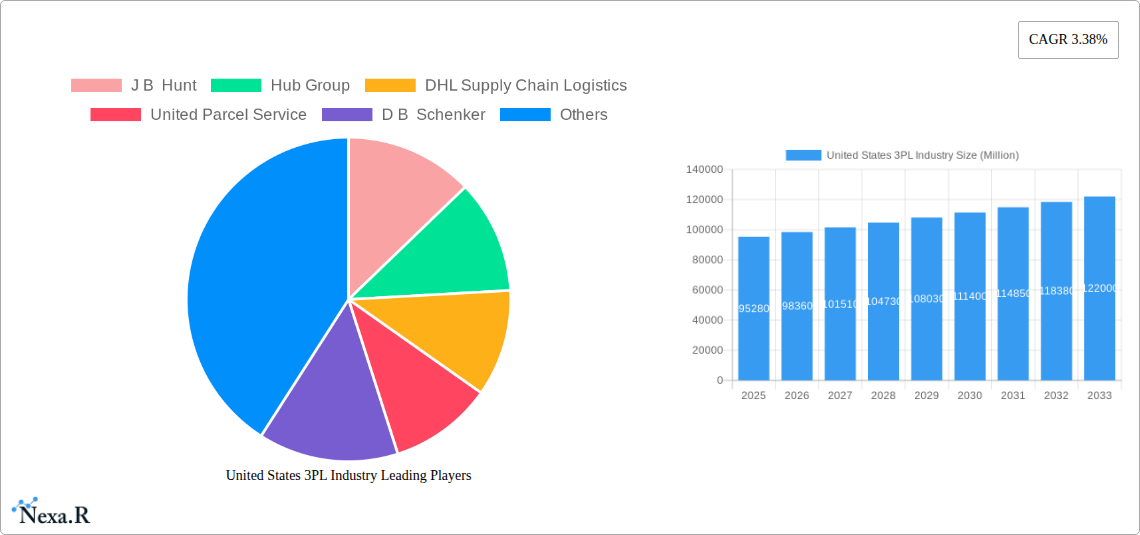
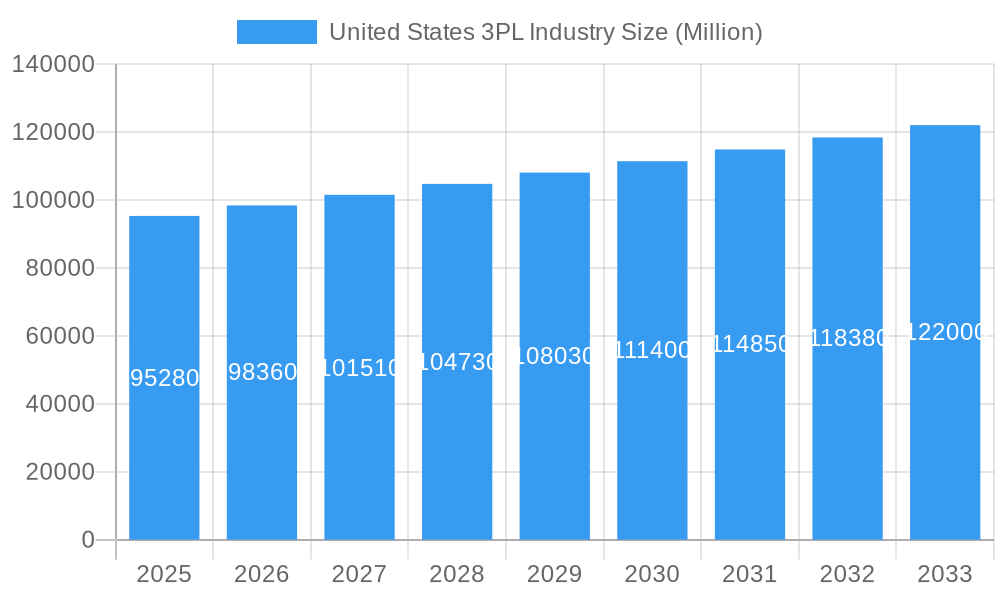
The United States 3PL (Third-Party Logistics) industry is a significant player in the global market, experiencing robust growth driven by the increasing complexities of supply chains and the rising demand for efficient logistics solutions across diverse sectors. With a global market size of $238.20 billion in 2025 and a CAGR of 3.38%, the US market constitutes a substantial portion of this total. Considering the US economy's size and its dominance in various sectors like manufacturing, technology, and consumer goods, a reasonable estimation places the US 3PL market size at approximately 40% of the global market in 2025, translating to roughly $95.28 billion. Key drivers include the expanding e-commerce sector requiring faster and more reliable deliveries, the increasing adoption of advanced technologies like AI and automation for supply chain optimization, and a growing focus on outsourcing logistics to reduce operational costs and enhance efficiency. The trend towards greater supply chain visibility and transparency further fuels the demand for comprehensive 3PL services. While potential restraints exist, such as labor shortages and fluctuating fuel costs, these are being mitigated by technological advancements and strategic partnerships within the industry. Strong growth is expected in segments like value-added warehousing and distribution, fueled by increasing demand for customized logistics solutions. The major players in the US market – J.B. Hunt, Hub Group, DHL, UPS, and FedEx – are constantly investing in technological advancements and expanding their service offerings to maintain their competitive edge.
United States 3PL Industry Market Size (In Billion)
The forecast period from 2025 to 2033 predicts continued expansion for the US 3PL industry, albeit at a potentially slightly moderated pace compared to the global CAGR, reflecting the mature nature of the US market. Nevertheless, the steady growth will be driven by ongoing technological innovation, the rise of omnichannel retail strategies, and the increasing need for resilient and agile supply chains. Specific end-user sectors like aerospace, automotive, and healthcare will continue to be significant contributors, alongside the booming e-commerce sector. The competitive landscape is likely to see further consolidation as larger 3PL providers acquire smaller companies to gain market share and expand their service portfolio. The demand for specialized services, including last-mile delivery solutions and sustainable logistics practices, will also shape the future trajectory of the US 3PL market, with companies strategically investing in these areas to attract and retain clients.
United States 3PL Industry Company Market Share
United States 3PL Industry Market Report: 2019-2033
This comprehensive report provides an in-depth analysis of the United States 3PL (Third-Party Logistics) industry, offering invaluable insights for industry professionals, investors, and strategic planners. Covering the period from 2019 to 2033, with a focus on 2025, this report dissects market dynamics, growth trends, key players, and future opportunities within this dynamic sector. The report analyzes parent markets (Logistics and Transportation) and child markets (Domestic and International Transportation Management, Warehousing and Distribution) to provide a comprehensive view.
United States 3PL Industry Market Dynamics & Structure
The US 3PL market is characterized by moderate concentration, with several large players holding significant market share. Technological innovation, driven by automation, AI, and data analytics, is a key driver. Stringent regulatory frameworks, including safety and environmental regulations, influence operational costs and strategies. Competitive substitutes include in-house logistics management, but 3PLs offer economies of scale and specialized expertise. End-user demographics are diverse, reflecting the broad range of industries served. M&A activity is significant, reflecting consolidation and expansion strategies.
- Market Concentration: Top 5 players hold approximately xx% of the market share in 2025.
- Technological Innovation: Investment in automation (robotics, AI) is expected to reach xx million in 2025.
- M&A Activity: An estimated xx M&A deals occurred between 2019-2024, with a total value of xx million.
- Regulatory Landscape: Compliance with FMCSA regulations represents a major cost factor for 3PL providers.
- Innovation Barriers: High initial investment costs for advanced technologies and lack of skilled labor pose challenges.
United States 3PL Industry Growth Trends & Insights
The US 3PL market experienced robust growth during the historical period (2019-2024), driven by e-commerce expansion and supply chain complexity. The market size expanded from xx million in 2019 to xx million in 2024, exhibiting a CAGR of xx%. Technological disruptions, such as the adoption of blockchain and IoT, are transforming operational efficiency and transparency. Consumer behavior shifts, including increased demand for faster delivery and personalized services, are reshaping the 3PL landscape. Market penetration is expected to reach xx% by 2033, driven by increased outsourcing by businesses of all sizes. The forecast period (2025-2033) anticipates continued growth, albeit at a slightly moderated pace.
Dominant Regions, Countries, or Segments in United States 3PL Industry
The Northeast and West Coast regions dominate the US 3PL market, driven by high population density, major ports, and strong manufacturing activity. Within segments, Domestic Transportation Management holds the largest market share, followed by Value-added Warehousing and Distribution. The Consumer and Retail, Manufacturing, and Healthcare end-user sectors are significant growth drivers.
- Key Drivers:
- Strong e-commerce growth: driving demand for last-mile delivery and warehousing solutions.
- Robust manufacturing sector: requiring efficient supply chain management.
- Government initiatives promoting infrastructure development: improving logistics efficiency.
- Dominant Segments:
- Domestic Transportation Management: Projected to reach xx million by 2033.
- Consumer & Retail: Largest end-user segment, contributing xx% to total market revenue in 2025.
- Value-added Warehousing and Distribution: Rapid expansion driven by increasing demand for specialized services.
United States 3PL Industry Product Landscape
The 3PL product landscape is characterized by a range of integrated services, encompassing transportation management (domestic and international), warehousing, inventory management, and value-added services (e.g., labeling, packaging). Technological advancements, such as TMS (Transportation Management Systems) and WMS (Warehouse Management Systems), enhance efficiency and visibility throughout the supply chain. Unique selling propositions include specialized expertise in specific industries, advanced technology platforms, and customizable solutions.
Key Drivers, Barriers & Challenges in United States 3PL Industry
Key Drivers: Increased e-commerce activity, globalization of supply chains, rising demand for efficient logistics solutions, and technological advancements are driving market growth.
Challenges: Driver shortages, rising fuel costs, port congestion, and regulatory compliance create significant headwinds. Competition from smaller, niche 3PLs adds pressure on pricing and margins. Supply chain disruptions, like those experienced in recent years, significantly impact profitability and service reliability.
Emerging Opportunities in United States 3PL Industry
Untapped markets in specialized sectors (e.g., cold chain logistics, pharmaceuticals) offer significant potential. The adoption of sustainable logistics practices and the integration of emerging technologies (e.g., blockchain, AI) create new opportunities for innovation and differentiation. Evolving consumer preferences for faster and more reliable deliveries push the demand for advanced logistics solutions.
Growth Accelerators in the United States 3PL Industry Industry
Technological breakthroughs, such as automation and AI, enhance operational efficiency and reduce costs. Strategic partnerships between 3PL providers and technology companies unlock new capabilities and expand service offerings. Market expansion strategies, targeting underserved regions and industries, offer significant growth potential.
Key Players Shaping the United States 3PL Industry Market
- J B Hunt
- Hub Group
- DHL Supply Chain Logistics
- United Parcel Service
- D B Schenker
- Ryder Supply Chain Solutions
- XPO Logistics
- Kuehne + Nagel
- C H Robinson
- Fedex
Notable Milestones in United States 3PL Industry Sector
- January 2022: J.B. Hunt acquires Zenith Freight Lines assets for USD 87 million, enhancing furniture delivery capabilities.
- January 2022: XPO Logistics opens two LTL terminals, increasing customer service capacity.
- October 2021: XPO Logistics launches a 264-door terminal in Chicago Heights, Illinois.
- December 2021: DHL Supply Chain partners with TuSimple to implement autonomous trucking operations, reserving 100 autonomous trucks.
In-Depth United States 3PL Industry Market Outlook
The US 3PL market is poised for continued growth, driven by technological advancements, increasing e-commerce penetration, and the ongoing need for efficient and reliable supply chain management. Strategic opportunities exist for companies that can leverage technology, develop specialized services, and adapt to evolving consumer demands. The market's future trajectory will be shaped by factors such as infrastructure investment, regulatory changes, and geopolitical events. Companies with a strong focus on innovation, sustainability, and customer service will be best positioned for success.
United States 3PL Industry Segmentation
-
1. Services
- 1.1. Domestic Transportation Management
- 1.2. International Transportation Management
- 1.3. Value-added Warehousing and Distribution
-
2. End User
- 2.1. Aerospace
- 2.2. Automotive
- 2.3. Consumer and Retail
- 2.4. Energy
- 2.5. Healthcare
- 2.6. Manufacturing
- 2.7. Technology
- 2.8. Other End Users
United States 3PL Industry Segmentation By Geography
- 1. United States
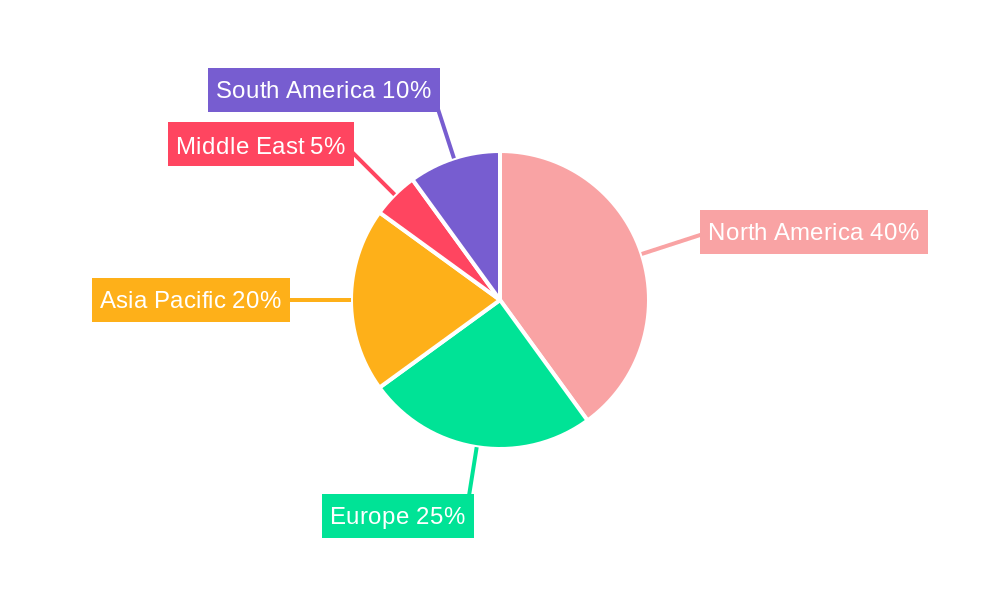
United States 3PL Industry Regional Market Share
Geographic Coverage of United States 3PL Industry
United States 3PL Industry REPORT HIGHLIGHTS
| Aspects | Details |
|---|---|
| Study Period | 2020-2034 |
| Base Year | 2025 |
| Estimated Year | 2026 |
| Forecast Period | 2026-2034 |
| Historical Period | 2020-2025 |
| Growth Rate | CAGR of 3.38% from 2020-2034 |
| Segmentation |
|
Table of Contents
- 1. Introduction
- 1.1. Research Scope
- 1.2. Market Segmentation
- 1.3. Research Objective
- 1.4. Definitions and Assumptions
- 2. Executive Summary
- 2.1. Market Snapshot
- 3. Market Dynamics
- 3.1. Market Drivers
- 3.2. Market Restrains
- 3.3. Market Trends
- 3.4. Market Opportunities
- 4. Market Factor Analysis
- 4.1. Porters Five Forces
- 4.1.1. Bargaining Power of Suppliers
- 4.1.2. Bargaining Power of Buyers
- 4.1.3. Threat of New Entrants
- 4.1.4. Threat of Substitutes
- 4.1.5. Competitive Rivalry
- 4.2. PESTEL analysis
- 4.3. BCG Analysis
- 4.3.1. Stars (High Growth, High Market Share)
- 4.3.2. Cash Cows (Low Growth, High Market Share)
- 4.3.3. Question Mark (High Growth, Low Market Share)
- 4.3.4. Dogs (Low Growth, Low Market Share)
- 4.4. Ansoff Matrix Analysis
- 4.5. Supply Chain Analysis
- 4.6. Regulatory Landscape
- 4.7. Current Market Potential and Opportunity Assessment (TAM–SAM–SOM Framework)
- 4.8. NRP Analyst Note
- 4.1. Porters Five Forces
- 5. Market Analysis, Insights and Forecast 2021-2033
- 5.1. Market Analysis, Insights and Forecast - by Services
- 5.1.1. Domestic Transportation Management
- 5.1.2. International Transportation Management
- 5.1.3. Value-added Warehousing and Distribution
- 5.2. Market Analysis, Insights and Forecast - by End User
- 5.2.1. Aerospace
- 5.2.2. Automotive
- 5.2.3. Consumer and Retail
- 5.2.4. Energy
- 5.2.5. Healthcare
- 5.2.6. Manufacturing
- 5.2.7. Technology
- 5.2.8. Other End Users
- 5.3. Market Analysis, Insights and Forecast - by Region
- 5.3.1. United States
- 5.1. Market Analysis, Insights and Forecast - by Services
- 6. United States 3PL Industry Analysis, Insights and Forecast, 2021-2033
- 6.1. Market Analysis, Insights and Forecast - by Services
- 6.1.1. Domestic Transportation Management
- 6.1.2. International Transportation Management
- 6.1.3. Value-added Warehousing and Distribution
- 6.2. Market Analysis, Insights and Forecast - by End User
- 6.2.1. Aerospace
- 6.2.2. Automotive
- 6.2.3. Consumer and Retail
- 6.2.4. Energy
- 6.2.5. Healthcare
- 6.2.6. Manufacturing
- 6.2.7. Technology
- 6.2.8. Other End Users
- 6.1. Market Analysis, Insights and Forecast - by Services
- 7. Competitive Analysis
- 7.1. Company Profiles
- 7.1.1 J B Hunt
- 7.1.1.1. Company Overview
- 7.1.1.2. Products
- 7.1.1.3. Company Financials
- 7.1.1.4. SWOT Analysis
- 7.1.2 Hub Group
- 7.1.2.1. Company Overview
- 7.1.2.2. Products
- 7.1.2.3. Company Financials
- 7.1.2.4. SWOT Analysis
- 7.1.3 DHL Supply Chain Logistics
- 7.1.3.1. Company Overview
- 7.1.3.2. Products
- 7.1.3.3. Company Financials
- 7.1.3.4. SWOT Analysis
- 7.1.4 United Parcel Service
- 7.1.4.1. Company Overview
- 7.1.4.2. Products
- 7.1.4.3. Company Financials
- 7.1.4.4. SWOT Analysis
- 7.1.5 D B Schenker
- 7.1.5.1. Company Overview
- 7.1.5.2. Products
- 7.1.5.3. Company Financials
- 7.1.5.4. SWOT Analysis
- 7.1.6 Ryder Supply Chain Solutions*List Not Exhaustive
- 7.1.6.1. Company Overview
- 7.1.6.2. Products
- 7.1.6.3. Company Financials
- 7.1.6.4. SWOT Analysis
- 7.1.7 XPO Logistics
- 7.1.7.1. Company Overview
- 7.1.7.2. Products
- 7.1.7.3. Company Financials
- 7.1.7.4. SWOT Analysis
- 7.1.8 Kuehne + Nagel
- 7.1.8.1. Company Overview
- 7.1.8.2. Products
- 7.1.8.3. Company Financials
- 7.1.8.4. SWOT Analysis
- 7.1.9 C H Robinson
- 7.1.9.1. Company Overview
- 7.1.9.2. Products
- 7.1.9.3. Company Financials
- 7.1.9.4. SWOT Analysis
- 7.1.10 Fedex
- 7.1.10.1. Company Overview
- 7.1.10.2. Products
- 7.1.10.3. Company Financials
- 7.1.10.4. SWOT Analysis
- 7.1.1 J B Hunt
- 7.2. Market Entropy
- 7.2.1 Company's Key Areas Served
- 7.2.2 Recent Developments
- 7.3. Company Market Share Analysis 2025
- 7.3.1 Top 5 Companies Market Share Analysis
- 7.3.2 Top 3 Companies Market Share Analysis
- 7.4. List of Potential Customers
- 8. Research Methodology
List of Figures
- Figure 1: United States 3PL Industry Revenue Breakdown (Million, %) by Product 2025 & 2033
- Figure 2: United States 3PL Industry Share (%) by Company 2025
List of Tables
- Table 1: United States 3PL Industry Revenue Million Forecast, by Services 2020 & 2033
- Table 2: United States 3PL Industry Revenue Million Forecast, by End User 2020 & 2033
- Table 3: United States 3PL Industry Revenue Million Forecast, by Region 2020 & 2033
- Table 4: United States 3PL Industry Revenue Million Forecast, by Services 2020 & 2033
- Table 5: United States 3PL Industry Revenue Million Forecast, by End User 2020 & 2033
- Table 6: United States 3PL Industry Revenue Million Forecast, by Country 2020 & 2033
Frequently Asked Questions
1. What is the projected Compound Annual Growth Rate (CAGR) of the United States 3PL Industry?
The projected CAGR is approximately 3.38%.
2. Which companies are prominent players in the United States 3PL Industry?
Key companies in the market include J B Hunt, Hub Group, DHL Supply Chain Logistics, United Parcel Service, D B Schenker, Ryder Supply Chain Solutions*List Not Exhaustive, XPO Logistics, Kuehne + Nagel, C H Robinson, Fedex.
3. What are the main segments of the United States 3PL Industry?
The market segments include Services, End User.
4. Can you provide details about the market size?
The market size is estimated to be USD 238.20 Million as of 2022.
5. What are some drivers contributing to market growth?
4.; Increasing production of chemical and allied products driving the market4.; Rising demand for green warehouses.
6. What are the notable trends driving market growth?
E-commerce Driving the 3PL Market.
7. Are there any restraints impacting market growth?
4.; Stringent Rules and Regulations4.; Higher Costs.
8. Can you provide examples of recent developments in the market?
In January 2022, J.B. Hunt announced that it was acquiring the assets of Zenith Freight Lines from Bassett Furniture Industries, a leading manufacturer of quality furniture. The acquisition is worth USD 87 million. From now on, J.B. Hunt will continue to provide the services for Bassett. This investment helps J.B. Hunt to enhance its furniture delivery capabilities by expanding nationwide.
9. What pricing options are available for accessing the report?
Pricing options include single-user, multi-user, and enterprise licenses priced at USD 3800, USD 4500, and USD 5800 respectively.
10. Is the market size provided in terms of value or volume?
The market size is provided in terms of value, measured in Million.
11. Are there any specific market keywords associated with the report?
Yes, the market keyword associated with the report is "United States 3PL Industry," which aids in identifying and referencing the specific market segment covered.
12. How do I determine which pricing option suits my needs best?
The pricing options vary based on user requirements and access needs. Individual users may opt for single-user licenses, while businesses requiring broader access may choose multi-user or enterprise licenses for cost-effective access to the report.
13. Are there any additional resources or data provided in the United States 3PL Industry report?
While the report offers comprehensive insights, it's advisable to review the specific contents or supplementary materials provided to ascertain if additional resources or data are available.
14. How can I stay updated on further developments or reports in the United States 3PL Industry?
To stay informed about further developments, trends, and reports in the United States 3PL Industry, consider subscribing to industry newsletters, following relevant companies and organizations, or regularly checking reputable industry news sources and publications.
Methodology
Step 1 - Identification of Relevant Samples Size from Population Database


Step 2 - Approaches for Defining Global Market Size (Value, Volume* & Price*)

Note*: In applicable scenarios
Step 3 - Data Sources
Primary Research
- Web Analytics
- Survey Reports
- Research Institute
- Latest Research Reports
- Opinion Leaders
Secondary Research
- Annual Reports
- White Paper
- Latest Press Release
- Industry Association
- Paid Database
- Investor Presentations

Step 4 - Data Triangulation
Involves using different sources of information in order to increase the validity of a study
These sources are likely to be stakeholders in a program - participants, other researchers, program staff, other community members, and so on.
Then we put all data in single framework & apply various statistical tools to find out the dynamic on the market.
During the analysis stage, feedback from the stakeholder groups would be compared to determine areas of agreement as well as areas of divergence