

Key Insights
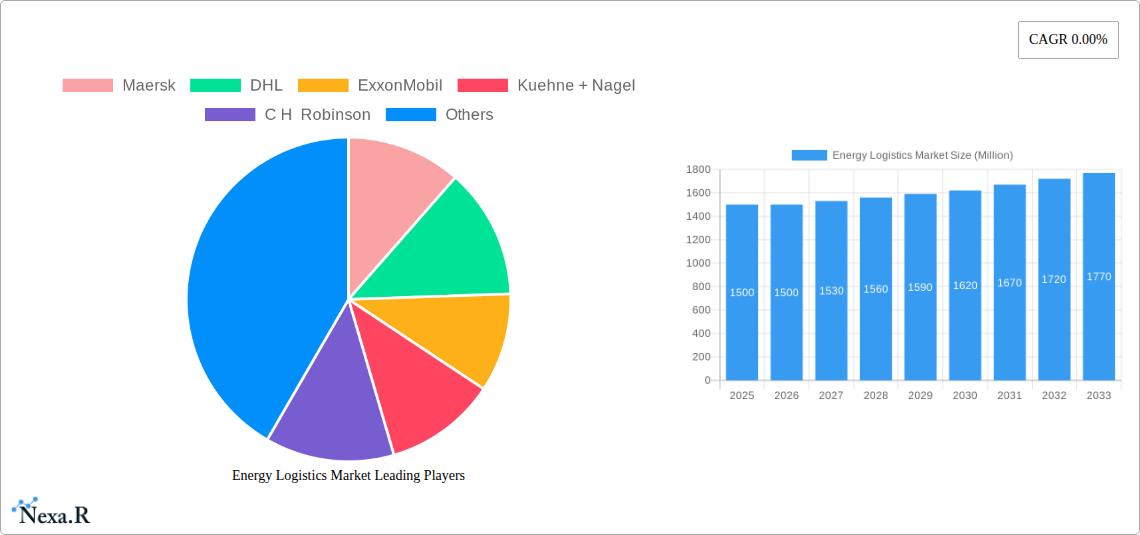
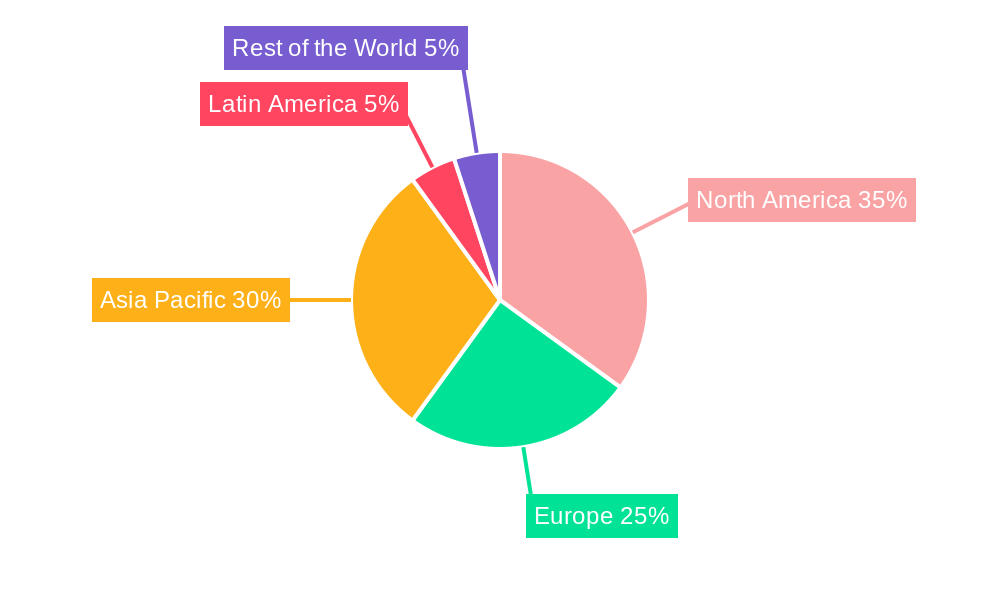
The global energy logistics market is projected for substantial growth, driven by the energy transition and rising global energy demand. Key segments indicate significant expansion potential. The renewable energy sector, encompassing wind and solar power, is a primary catalyst for increased logistics requirements for specialized equipment and materials. While the oil and gas segment remains significant, it faces evolving dynamics due to price volatility and the increasing adoption of cleaner energy solutions. The private sector, fueled by energy companies' expansion and infrastructure development, constitutes a larger portion of end-users than the government sector. Diverse transportation modes are critical; rail ensures efficient bulk energy transport, air services expedite high-value component delivery, road networks manage shorter distances, and waterways offer cost-effective long-haul solutions. Leading companies such as Maersk, DHL, and ExxonMobil are strategically investing in sustainable and efficient logistics to capitalize on market shifts. Geographically, North America and Asia Pacific hold substantial market shares, reflecting established energy hubs. The projected CAGR is 17.9%, with an estimated market size of 477.2 billion by 2025.
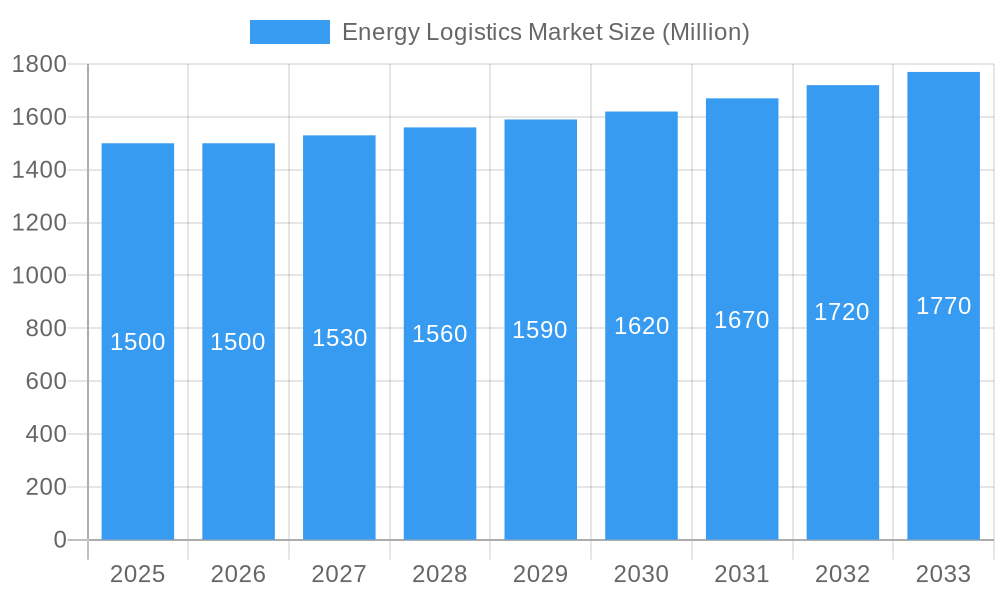
Energy Logistics Market Market Size (In Billion)
While current growth metrics may appear moderate, underlying market dynamics indicate robust expansion ahead. The renewable energy and power generation segments are anticipated to outpace overall market growth, propelled by investments in renewable energy infrastructure and the escalating need for efficient logistics for associated materials. Companies are expected to prioritize supply chain optimization through technological advancements like digitalization, data analytics, and automation to combat rising transportation costs and improve operational efficiency. Intensified competition will see established logistics providers broadening their service offerings to align with the evolving energy landscape. Regional variations in energy infrastructure will also impact growth rates, with areas demonstrating strong renewable energy adoption likely to experience faster development. Consequently, the long-term outlook for the energy logistics market is optimistic, presenting considerable growth opportunities driven by the ongoing energy transition.
Energy Logistics Market Company Market Share
Energy Logistics Market: A Comprehensive Report (2019-2033)
This in-depth report provides a comprehensive analysis of the Energy Logistics Market, encompassing market dynamics, growth trends, regional analysis, competitive landscape, and future outlook. With a study period spanning 2019-2033, a base year of 2025, and a forecast period of 2025-2033, this report offers invaluable insights for industry professionals, investors, and strategic decision-makers. The market is segmented by application (Oil & Gas, Renewable Energy, Power Generation, Energy Mining), end-user (Government Sector, Private Sector), and mode of transport (Railways, Airways, Roadways, Waterways). The report's value is estimated at XX million units in 2025 and is projected to reach XX million units by 2033.
Energy Logistics Market Market Dynamics & Structure
The energy logistics market is characterized by a moderately concentrated structure, with key players like Maersk, DHL, ExxonMobil, Kuehne + Nagel, C.H. Robinson, COSCO Shipping Lines, Chevron, Mediterranean Shipping Company (MSC), BP, and TransCanada holding significant market share. However, the market also features a substantial number of smaller, specialized players. Technological innovation, particularly in areas like digitalization, automation, and sustainable transportation solutions, is a major driver of market growth. Stringent regulatory frameworks concerning safety, emissions, and security significantly influence operational practices. The market faces competition from alternative transportation modes and energy sources. M&A activity has been relatively frequent, with larger players seeking to expand their geographical reach and service offerings.
- Market Concentration: The top 10 players account for approximately xx% of the market share in 2025.
- Technological Innovation: Focus on automation, real-time tracking, and sustainable fuel options.
- Regulatory Framework: Emphasis on safety, emission standards, and security protocols.
- Competitive Substitutes: Pipeline transport, alternative energy sources pose a competitive challenge.
- End-User Demographics: Government and private sector demand varies based on energy policies and infrastructure development.
- M&A Trends: xx major M&A deals were recorded between 2019 and 2024, with a predicted xx deals for 2025-2033.
Energy Logistics Market Growth Trends & Insights
The energy logistics market is experiencing robust growth, driven by increasing global energy demand, expansion of renewable energy sources, and ongoing infrastructure development. The market size exhibited a CAGR of xx% during the historical period (2019-2024) and is projected to maintain a CAGR of xx% during the forecast period (2025-2033). This growth is fueled by increasing adoption of sophisticated logistics solutions, technological advancements, and evolving consumer behavior towards sustainable energy practices. The market penetration rate for advanced logistics technologies is expected to reach xx% by 2033. Disruptions in the supply chain, particularly those caused by geopolitical events, present challenges to the market's stability. However, innovation in areas like predictive analytics and blockchain technology helps mitigate such challenges.
Dominant Regions, Countries, or Segments in Energy Logistics Market
The North American region currently holds the largest market share, driven by significant oil & gas production and a well-established logistics infrastructure. However, the Asia-Pacific region is projected to exhibit the highest growth rate during the forecast period, fueled by rapid industrialization and increasing investment in renewable energy projects.
By Application: The Oil & Gas segment dominates the market, followed by the Renewable Energy segment exhibiting the fastest growth.
By End-User: The Private sector holds a larger market share due to extensive operations in energy production and distribution.
By Mode of Transport: Roadways currently dominate, although there is significant growth potential for railways, particularly for long-haul transportation of energy resources.
- Key Drivers: Economic growth, energy transition policies, infrastructure development, government incentives for renewable energy.
- Dominance Factors: Established logistics networks, energy production hubs, favorable regulatory environments.
Energy Logistics Market Product Landscape
The energy logistics market encompasses a range of services, including transportation, warehousing, storage, and specialized handling of energy products. Technological advancements are driving innovation, with increased adoption of IoT-enabled tracking devices, automated handling systems, and data analytics tools enhancing efficiency, security, and sustainability. The unique selling propositions of key players often lie in their specialized equipment, global network reach, and integrated logistics solutions.
Key Drivers, Barriers & Challenges in Energy Logistics Market
Key Drivers: Increasing global energy demand, growing renewable energy sector, technological advancements, and supportive government policies. The shift toward cleaner energy sources is a major growth driver.
Challenges and Restraints: Fluctuating energy prices, geopolitical instability, regulatory complexities, and supply chain disruptions impact market growth. Stringent safety regulations and environmental concerns add to operational costs.
Emerging Opportunities in Energy Logistics Market
Emerging opportunities include the growth of renewable energy logistics, especially in offshore wind energy transport and the development of sustainable transportation solutions, such as electric and hydrogen-powered vehicles for last-mile delivery. Untapped markets in developing economies, and specialized services for handling sensitive energy products present further opportunities.
Growth Accelerators in the Energy Logistics Market Industry
Strategic partnerships between energy companies and logistics providers are key to market growth, along with the deployment of advanced technologies for optimized route planning, real-time tracking, and predictive maintenance of transportation assets. Expansion into new geographic markets with growing energy demands represents another accelerator.
Key Players Shaping the Energy Logistics Market Market
Notable Milestones in Energy Logistics Market Sector
- 2020: Increased focus on digitalization within logistics operations.
- 2021: Significant investments in renewable energy infrastructure.
- 2022: Growing adoption of sustainable transport solutions.
- 2023: Several key mergers and acquisitions in the sector.
- 2024: Implementation of stricter emission regulations.
In-Depth Energy Logistics Market Market Outlook
The future of the energy logistics market is promising, with continued growth driven by the global energy transition, technological innovation, and increasing demand for efficient and sustainable energy transportation. Strategic partnerships and investments in advanced technologies will be crucial for companies to maintain a competitive edge. The market is poised for substantial expansion, presenting significant opportunities for players who can adapt to the changing landscape and capitalize on emerging trends.
Energy Logistics Market Segmentation
-
1. Application
- 1.1. Oil & Gas
- 1.2. Renewable Energy
- 1.3. Power Generation
- 1.4. Energy Mining
-
2. End-User
- 2.1. Government Sector
- 2.2. Private Sector
-
3. Mode of Transport
- 3.1. Railways
- 3.2. Airways
- 3.3. Roadways
- 3.4. Waterways
Energy Logistics Market Segmentation By Geography
-
1. North America
- 1.1. United States
- 1.2. Canada
- 1.3. Mexico
-
2. South America
- 2.1. Brazil
- 2.2. Argentina
- 2.3. Rest of South America
-
3. Europe
- 3.1. United Kingdom
- 3.2. Germany
- 3.3. France
- 3.4. Italy
- 3.5. Spain
- 3.6. Russia
- 3.7. Benelux
- 3.8. Nordics
- 3.9. Rest of Europe
-
4. Middle East & Africa
- 4.1. Turkey
- 4.2. Israel
- 4.3. GCC
- 4.4. North Africa
- 4.5. South Africa
- 4.6. Rest of Middle East & Africa
-
5. Asia Pacific
- 5.1. China
- 5.2. India
- 5.3. Japan
- 5.4. South Korea
- 5.5. ASEAN
- 5.6. Oceania
- 5.7. Rest of Asia Pacific
Energy Logistics Market Regional Market Share
Geographic Coverage of Energy Logistics Market
Energy Logistics Market REPORT HIGHLIGHTS
| Aspects | Details |
|---|---|
| Study Period | 2020-2034 |
| Base Year | 2025 |
| Estimated Year | 2026 |
| Forecast Period | 2026-2034 |
| Historical Period | 2020-2025 |
| Growth Rate | CAGR of 17.9% from 2020-2034 |
| Segmentation |
|
Table of Contents
- 1. Introduction
- 1.1. Research Scope
- 1.2. Market Segmentation
- 1.3. Research Objective
- 1.4. Definitions and Assumptions
- 2. Executive Summary
- 2.1. Market Snapshot
- 3. Market Dynamics
- 3.1. Market Drivers
- 3.2. Market Restrains
- 3.3. Market Trends
- 3.4. Market Opportunities
- 4. Market Factor Analysis
- 4.1. Porters Five Forces
- 4.1.1. Bargaining Power of Suppliers
- 4.1.2. Bargaining Power of Buyers
- 4.1.3. Threat of New Entrants
- 4.1.4. Threat of Substitutes
- 4.1.5. Competitive Rivalry
- 4.2. PESTEL analysis
- 4.3. BCG Analysis
- 4.3.1. Stars (High Growth, High Market Share)
- 4.3.2. Cash Cows (Low Growth, High Market Share)
- 4.3.3. Question Mark (High Growth, Low Market Share)
- 4.3.4. Dogs (Low Growth, Low Market Share)
- 4.4. Ansoff Matrix Analysis
- 4.5. Supply Chain Analysis
- 4.6. Regulatory Landscape
- 4.7. Current Market Potential and Opportunity Assessment (TAM–SAM–SOM Framework)
- 4.8. NRP Analyst Note
- 4.1. Porters Five Forces
- 5. Market Analysis, Insights and Forecast 2021-2033
- 5.1. Market Analysis, Insights and Forecast - by Application
- 5.1.1. Oil & Gas
- 5.1.2. Renewable Energy
- 5.1.3. Power Generation
- 5.1.4. Energy Mining
- 5.2. Market Analysis, Insights and Forecast - by End-User
- 5.2.1. Government Sector
- 5.2.2. Private Sector
- 5.3. Market Analysis, Insights and Forecast - by Mode of Transport
- 5.3.1. Railways
- 5.3.2. Airways
- 5.3.3. Roadways
- 5.3.4. Waterways
- 5.4. Market Analysis, Insights and Forecast - by Region
- 5.4.1. North America
- 5.4.2. South America
- 5.4.3. Europe
- 5.4.4. Middle East & Africa
- 5.4.5. Asia Pacific
- 5.1. Market Analysis, Insights and Forecast - by Application
- 6. Global Energy Logistics Market Analysis, Insights and Forecast, 2021-2033
- 6.1. Market Analysis, Insights and Forecast - by Application
- 6.1.1. Oil & Gas
- 6.1.2. Renewable Energy
- 6.1.3. Power Generation
- 6.1.4. Energy Mining
- 6.2. Market Analysis, Insights and Forecast - by End-User
- 6.2.1. Government Sector
- 6.2.2. Private Sector
- 6.3. Market Analysis, Insights and Forecast - by Mode of Transport
- 6.3.1. Railways
- 6.3.2. Airways
- 6.3.3. Roadways
- 6.3.4. Waterways
- 6.1. Market Analysis, Insights and Forecast - by Application
- 7. North America Energy Logistics Market Analysis, Insights and Forecast, 2020-2032
- 7.1. Market Analysis, Insights and Forecast - by Application
- 7.1.1. Oil & Gas
- 7.1.2. Renewable Energy
- 7.1.3. Power Generation
- 7.1.4. Energy Mining
- 7.2. Market Analysis, Insights and Forecast - by End-User
- 7.2.1. Government Sector
- 7.2.2. Private Sector
- 7.3. Market Analysis, Insights and Forecast - by Mode of Transport
- 7.3.1. Railways
- 7.3.2. Airways
- 7.3.3. Roadways
- 7.3.4. Waterways
- 7.1. Market Analysis, Insights and Forecast - by Application
- 8. South America Energy Logistics Market Analysis, Insights and Forecast, 2020-2032
- 8.1. Market Analysis, Insights and Forecast - by Application
- 8.1.1. Oil & Gas
- 8.1.2. Renewable Energy
- 8.1.3. Power Generation
- 8.1.4. Energy Mining
- 8.2. Market Analysis, Insights and Forecast - by End-User
- 8.2.1. Government Sector
- 8.2.2. Private Sector
- 8.3. Market Analysis, Insights and Forecast - by Mode of Transport
- 8.3.1. Railways
- 8.3.2. Airways
- 8.3.3. Roadways
- 8.3.4. Waterways
- 8.1. Market Analysis, Insights and Forecast - by Application
- 9. Europe Energy Logistics Market Analysis, Insights and Forecast, 2020-2032
- 9.1. Market Analysis, Insights and Forecast - by Application
- 9.1.1. Oil & Gas
- 9.1.2. Renewable Energy
- 9.1.3. Power Generation
- 9.1.4. Energy Mining
- 9.2. Market Analysis, Insights and Forecast - by End-User
- 9.2.1. Government Sector
- 9.2.2. Private Sector
- 9.3. Market Analysis, Insights and Forecast - by Mode of Transport
- 9.3.1. Railways
- 9.3.2. Airways
- 9.3.3. Roadways
- 9.3.4. Waterways
- 9.1. Market Analysis, Insights and Forecast - by Application
- 10. Middle East & Africa Energy Logistics Market Analysis, Insights and Forecast, 2020-2032
- 10.1. Market Analysis, Insights and Forecast - by Application
- 10.1.1. Oil & Gas
- 10.1.2. Renewable Energy
- 10.1.3. Power Generation
- 10.1.4. Energy Mining
- 10.2. Market Analysis, Insights and Forecast - by End-User
- 10.2.1. Government Sector
- 10.2.2. Private Sector
- 10.3. Market Analysis, Insights and Forecast - by Mode of Transport
- 10.3.1. Railways
- 10.3.2. Airways
- 10.3.3. Roadways
- 10.3.4. Waterways
- 10.1. Market Analysis, Insights and Forecast - by Application
- 11. Asia Pacific Energy Logistics Market Analysis, Insights and Forecast, 2020-2032
- 11.1. Market Analysis, Insights and Forecast - by Application
- 11.1.1. Oil & Gas
- 11.1.2. Renewable Energy
- 11.1.3. Power Generation
- 11.1.4. Energy Mining
- 11.2. Market Analysis, Insights and Forecast - by End-User
- 11.2.1. Government Sector
- 11.2.2. Private Sector
- 11.3. Market Analysis, Insights and Forecast - by Mode of Transport
- 11.3.1. Railways
- 11.3.2. Airways
- 11.3.3. Roadways
- 11.3.4. Waterways
- 11.1. Market Analysis, Insights and Forecast - by Application
- 12. Competitive Analysis
- 12.1. Company Profiles
- 12.1.1 Maersk
- 12.1.1.1. Company Overview
- 12.1.1.2. Products
- 12.1.1.3. Company Financials
- 12.1.1.4. SWOT Analysis
- 12.1.2 DHL
- 12.1.2.1. Company Overview
- 12.1.2.2. Products
- 12.1.2.3. Company Financials
- 12.1.2.4. SWOT Analysis
- 12.1.3 ExxonMobil
- 12.1.3.1. Company Overview
- 12.1.3.2. Products
- 12.1.3.3. Company Financials
- 12.1.3.4. SWOT Analysis
- 12.1.4 Kuehne + Nagel
- 12.1.4.1. Company Overview
- 12.1.4.2. Products
- 12.1.4.3. Company Financials
- 12.1.4.4. SWOT Analysis
- 12.1.5 C H Robinson
- 12.1.5.1. Company Overview
- 12.1.5.2. Products
- 12.1.5.3. Company Financials
- 12.1.5.4. SWOT Analysis
- 12.1.6 COSCO Shipping Lines
- 12.1.6.1. Company Overview
- 12.1.6.2. Products
- 12.1.6.3. Company Financials
- 12.1.6.4. SWOT Analysis
- 12.1.7 Chevron
- 12.1.7.1. Company Overview
- 12.1.7.2. Products
- 12.1.7.3. Company Financials
- 12.1.7.4. SWOT Analysis
- 12.1.8 Mediterranean Shipping Company (MSC)
- 12.1.8.1. Company Overview
- 12.1.8.2. Products
- 12.1.8.3. Company Financials
- 12.1.8.4. SWOT Analysis
- 12.1.9 BP
- 12.1.9.1. Company Overview
- 12.1.9.2. Products
- 12.1.9.3. Company Financials
- 12.1.9.4. SWOT Analysis
- 12.1.10 TransCanada**List Not Exhaustive 7 3 Other Companie
- 12.1.10.1. Company Overview
- 12.1.10.2. Products
- 12.1.10.3. Company Financials
- 12.1.10.4. SWOT Analysis
- 12.1.1 Maersk
- 12.2. Market Entropy
- 12.2.1 Company's Key Areas Served
- 12.2.2 Recent Developments
- 12.3. Company Market Share Analysis 2025
- 12.3.1 Top 5 Companies Market Share Analysis
- 12.3.2 Top 3 Companies Market Share Analysis
- 12.4. List of Potential Customers
- 13. Research Methodology
List of Figures
- Figure 1: Global Energy Logistics Market Revenue Breakdown (billion, %) by Region 2025 & 2033
- Figure 2: North America Energy Logistics Market Revenue (billion), by Application 2025 & 2033
- Figure 3: North America Energy Logistics Market Revenue Share (%), by Application 2025 & 2033
- Figure 4: North America Energy Logistics Market Revenue (billion), by End-User 2025 & 2033
- Figure 5: North America Energy Logistics Market Revenue Share (%), by End-User 2025 & 2033
- Figure 6: North America Energy Logistics Market Revenue (billion), by Mode of Transport 2025 & 2033
- Figure 7: North America Energy Logistics Market Revenue Share (%), by Mode of Transport 2025 & 2033
- Figure 8: North America Energy Logistics Market Revenue (billion), by Country 2025 & 2033
- Figure 9: North America Energy Logistics Market Revenue Share (%), by Country 2025 & 2033
- Figure 10: South America Energy Logistics Market Revenue (billion), by Application 2025 & 2033
- Figure 11: South America Energy Logistics Market Revenue Share (%), by Application 2025 & 2033
- Figure 12: South America Energy Logistics Market Revenue (billion), by End-User 2025 & 2033
- Figure 13: South America Energy Logistics Market Revenue Share (%), by End-User 2025 & 2033
- Figure 14: South America Energy Logistics Market Revenue (billion), by Mode of Transport 2025 & 2033
- Figure 15: South America Energy Logistics Market Revenue Share (%), by Mode of Transport 2025 & 2033
- Figure 16: South America Energy Logistics Market Revenue (billion), by Country 2025 & 2033
- Figure 17: South America Energy Logistics Market Revenue Share (%), by Country 2025 & 2033
- Figure 18: Europe Energy Logistics Market Revenue (billion), by Application 2025 & 2033
- Figure 19: Europe Energy Logistics Market Revenue Share (%), by Application 2025 & 2033
- Figure 20: Europe Energy Logistics Market Revenue (billion), by End-User 2025 & 2033
- Figure 21: Europe Energy Logistics Market Revenue Share (%), by End-User 2025 & 2033
- Figure 22: Europe Energy Logistics Market Revenue (billion), by Mode of Transport 2025 & 2033
- Figure 23: Europe Energy Logistics Market Revenue Share (%), by Mode of Transport 2025 & 2033
- Figure 24: Europe Energy Logistics Market Revenue (billion), by Country 2025 & 2033
- Figure 25: Europe Energy Logistics Market Revenue Share (%), by Country 2025 & 2033
- Figure 26: Middle East & Africa Energy Logistics Market Revenue (billion), by Application 2025 & 2033
- Figure 27: Middle East & Africa Energy Logistics Market Revenue Share (%), by Application 2025 & 2033
- Figure 28: Middle East & Africa Energy Logistics Market Revenue (billion), by End-User 2025 & 2033
- Figure 29: Middle East & Africa Energy Logistics Market Revenue Share (%), by End-User 2025 & 2033
- Figure 30: Middle East & Africa Energy Logistics Market Revenue (billion), by Mode of Transport 2025 & 2033
- Figure 31: Middle East & Africa Energy Logistics Market Revenue Share (%), by Mode of Transport 2025 & 2033
- Figure 32: Middle East & Africa Energy Logistics Market Revenue (billion), by Country 2025 & 2033
- Figure 33: Middle East & Africa Energy Logistics Market Revenue Share (%), by Country 2025 & 2033
- Figure 34: Asia Pacific Energy Logistics Market Revenue (billion), by Application 2025 & 2033
- Figure 35: Asia Pacific Energy Logistics Market Revenue Share (%), by Application 2025 & 2033
- Figure 36: Asia Pacific Energy Logistics Market Revenue (billion), by End-User 2025 & 2033
- Figure 37: Asia Pacific Energy Logistics Market Revenue Share (%), by End-User 2025 & 2033
- Figure 38: Asia Pacific Energy Logistics Market Revenue (billion), by Mode of Transport 2025 & 2033
- Figure 39: Asia Pacific Energy Logistics Market Revenue Share (%), by Mode of Transport 2025 & 2033
- Figure 40: Asia Pacific Energy Logistics Market Revenue (billion), by Country 2025 & 2033
- Figure 41: Asia Pacific Energy Logistics Market Revenue Share (%), by Country 2025 & 2033
List of Tables
- Table 1: Global Energy Logistics Market Revenue billion Forecast, by Application 2020 & 2033
- Table 2: Global Energy Logistics Market Revenue billion Forecast, by End-User 2020 & 2033
- Table 3: Global Energy Logistics Market Revenue billion Forecast, by Mode of Transport 2020 & 2033
- Table 4: Global Energy Logistics Market Revenue billion Forecast, by Region 2020 & 2033
- Table 5: Global Energy Logistics Market Revenue billion Forecast, by Application 2020 & 2033
- Table 6: Global Energy Logistics Market Revenue billion Forecast, by End-User 2020 & 2033
- Table 7: Global Energy Logistics Market Revenue billion Forecast, by Mode of Transport 2020 & 2033
- Table 8: Global Energy Logistics Market Revenue billion Forecast, by Country 2020 & 2033
- Table 9: United States Energy Logistics Market Revenue (billion) Forecast, by Application 2020 & 2033
- Table 10: Canada Energy Logistics Market Revenue (billion) Forecast, by Application 2020 & 2033
- Table 11: Mexico Energy Logistics Market Revenue (billion) Forecast, by Application 2020 & 2033
- Table 12: Global Energy Logistics Market Revenue billion Forecast, by Application 2020 & 2033
- Table 13: Global Energy Logistics Market Revenue billion Forecast, by End-User 2020 & 2033
- Table 14: Global Energy Logistics Market Revenue billion Forecast, by Mode of Transport 2020 & 2033
- Table 15: Global Energy Logistics Market Revenue billion Forecast, by Country 2020 & 2033
- Table 16: Brazil Energy Logistics Market Revenue (billion) Forecast, by Application 2020 & 2033
- Table 17: Argentina Energy Logistics Market Revenue (billion) Forecast, by Application 2020 & 2033
- Table 18: Rest of South America Energy Logistics Market Revenue (billion) Forecast, by Application 2020 & 2033
- Table 19: Global Energy Logistics Market Revenue billion Forecast, by Application 2020 & 2033
- Table 20: Global Energy Logistics Market Revenue billion Forecast, by End-User 2020 & 2033
- Table 21: Global Energy Logistics Market Revenue billion Forecast, by Mode of Transport 2020 & 2033
- Table 22: Global Energy Logistics Market Revenue billion Forecast, by Country 2020 & 2033
- Table 23: United Kingdom Energy Logistics Market Revenue (billion) Forecast, by Application 2020 & 2033
- Table 24: Germany Energy Logistics Market Revenue (billion) Forecast, by Application 2020 & 2033
- Table 25: France Energy Logistics Market Revenue (billion) Forecast, by Application 2020 & 2033
- Table 26: Italy Energy Logistics Market Revenue (billion) Forecast, by Application 2020 & 2033
- Table 27: Spain Energy Logistics Market Revenue (billion) Forecast, by Application 2020 & 2033
- Table 28: Russia Energy Logistics Market Revenue (billion) Forecast, by Application 2020 & 2033
- Table 29: Benelux Energy Logistics Market Revenue (billion) Forecast, by Application 2020 & 2033
- Table 30: Nordics Energy Logistics Market Revenue (billion) Forecast, by Application 2020 & 2033
- Table 31: Rest of Europe Energy Logistics Market Revenue (billion) Forecast, by Application 2020 & 2033
- Table 32: Global Energy Logistics Market Revenue billion Forecast, by Application 2020 & 2033
- Table 33: Global Energy Logistics Market Revenue billion Forecast, by End-User 2020 & 2033
- Table 34: Global Energy Logistics Market Revenue billion Forecast, by Mode of Transport 2020 & 2033
- Table 35: Global Energy Logistics Market Revenue billion Forecast, by Country 2020 & 2033
- Table 36: Turkey Energy Logistics Market Revenue (billion) Forecast, by Application 2020 & 2033
- Table 37: Israel Energy Logistics Market Revenue (billion) Forecast, by Application 2020 & 2033
- Table 38: GCC Energy Logistics Market Revenue (billion) Forecast, by Application 2020 & 2033
- Table 39: North Africa Energy Logistics Market Revenue (billion) Forecast, by Application 2020 & 2033
- Table 40: South Africa Energy Logistics Market Revenue (billion) Forecast, by Application 2020 & 2033
- Table 41: Rest of Middle East & Africa Energy Logistics Market Revenue (billion) Forecast, by Application 2020 & 2033
- Table 42: Global Energy Logistics Market Revenue billion Forecast, by Application 2020 & 2033
- Table 43: Global Energy Logistics Market Revenue billion Forecast, by End-User 2020 & 2033
- Table 44: Global Energy Logistics Market Revenue billion Forecast, by Mode of Transport 2020 & 2033
- Table 45: Global Energy Logistics Market Revenue billion Forecast, by Country 2020 & 2033
- Table 46: China Energy Logistics Market Revenue (billion) Forecast, by Application 2020 & 2033
- Table 47: India Energy Logistics Market Revenue (billion) Forecast, by Application 2020 & 2033
- Table 48: Japan Energy Logistics Market Revenue (billion) Forecast, by Application 2020 & 2033
- Table 49: South Korea Energy Logistics Market Revenue (billion) Forecast, by Application 2020 & 2033
- Table 50: ASEAN Energy Logistics Market Revenue (billion) Forecast, by Application 2020 & 2033
- Table 51: Oceania Energy Logistics Market Revenue (billion) Forecast, by Application 2020 & 2033
- Table 52: Rest of Asia Pacific Energy Logistics Market Revenue (billion) Forecast, by Application 2020 & 2033
Frequently Asked Questions
1. What is the projected Compound Annual Growth Rate (CAGR) of the Energy Logistics Market?
The projected CAGR is approximately 17.9%.
2. Which companies are prominent players in the Energy Logistics Market?
Key companies in the market include Maersk, DHL, ExxonMobil, Kuehne + Nagel, C H Robinson, COSCO Shipping Lines, Chevron, Mediterranean Shipping Company (MSC), BP, TransCanada**List Not Exhaustive 7 3 Other Companie.
3. What are the main segments of the Energy Logistics Market?
The market segments include Application, End-User, Mode of Transport.
4. Can you provide details about the market size?
The market size is estimated to be USD 477.2 billion as of 2022.
5. What are some drivers contributing to market growth?
Industrial Growth Supporting the Market; Global Trade Driving the Market.
6. What are the notable trends driving market growth?
The Oil & Gas Segment is booming.
7. Are there any restraints impacting market growth?
Compliance Challenges Affecting the Market; Limited Infrastructure Inhibiting the Market.
8. Can you provide examples of recent developments in the market?
N/A
9. What pricing options are available for accessing the report?
Pricing options include single-user, multi-user, and enterprise licenses priced at USD 3800, USD 4500, and USD 5800 respectively.
10. Is the market size provided in terms of value or volume?
The market size is provided in terms of value, measured in billion.
11. Are there any specific market keywords associated with the report?
Yes, the market keyword associated with the report is "Energy Logistics Market," which aids in identifying and referencing the specific market segment covered.
12. How do I determine which pricing option suits my needs best?
The pricing options vary based on user requirements and access needs. Individual users may opt for single-user licenses, while businesses requiring broader access may choose multi-user or enterprise licenses for cost-effective access to the report.
13. Are there any additional resources or data provided in the Energy Logistics Market report?
While the report offers comprehensive insights, it's advisable to review the specific contents or supplementary materials provided to ascertain if additional resources or data are available.
14. How can I stay updated on further developments or reports in the Energy Logistics Market?
To stay informed about further developments, trends, and reports in the Energy Logistics Market, consider subscribing to industry newsletters, following relevant companies and organizations, or regularly checking reputable industry news sources and publications.
Methodology
Step 1 - Identification of Relevant Samples Size from Population Database


Step 2 - Approaches for Defining Global Market Size (Value, Volume* & Price*)

Note*: In applicable scenarios
Step 3 - Data Sources
Primary Research
- Web Analytics
- Survey Reports
- Research Institute
- Latest Research Reports
- Opinion Leaders
Secondary Research
- Annual Reports
- White Paper
- Latest Press Release
- Industry Association
- Paid Database
- Investor Presentations

Step 4 - Data Triangulation
Involves using different sources of information in order to increase the validity of a study
These sources are likely to be stakeholders in a program - participants, other researchers, program staff, other community members, and so on.
Then we put all data in single framework & apply various statistical tools to find out the dynamic on the market.
During the analysis stage, feedback from the stakeholder groups would be compared to determine areas of agreement as well as areas of divergence