

Key Insights
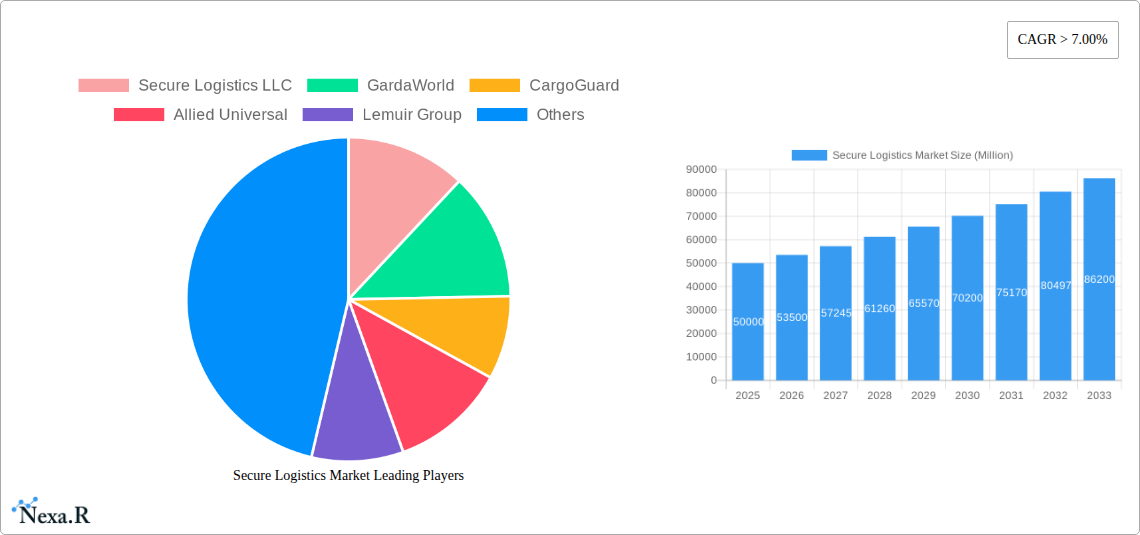
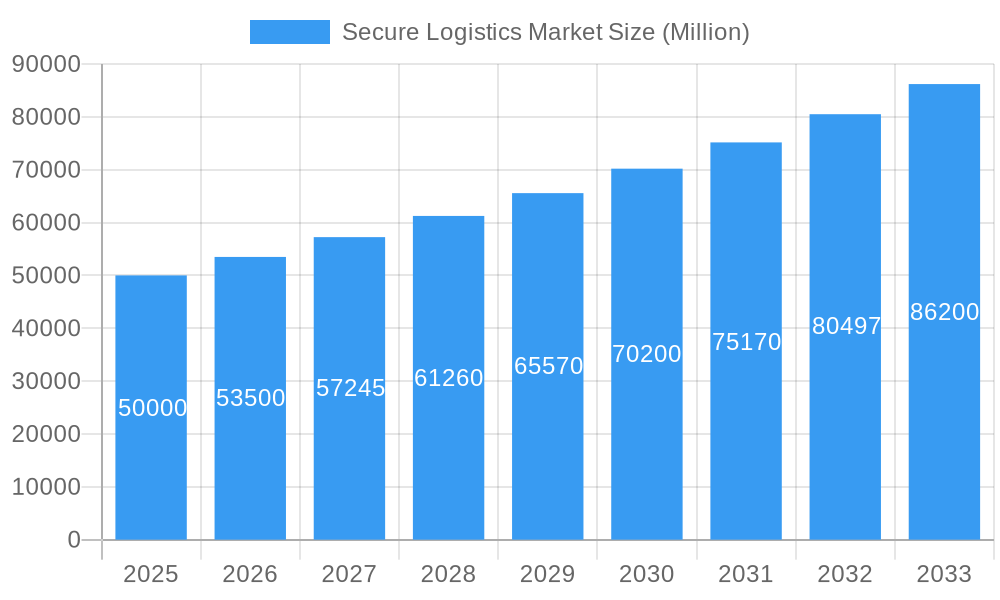
The global secure logistics market is experiencing robust growth, fueled by a compound annual growth rate (CAGR) exceeding 7% and a substantial market size (estimated at $XX billion in 2025). This expansion is driven by several key factors. The increasing e-commerce penetration and the resulting need for secure and efficient delivery of goods are major contributors. Furthermore, heightened security concerns across various sectors, including cash management, diamonds and precious metals, and manufacturing, are driving demand for specialized secure logistics solutions. Technological advancements, such as the implementation of real-time tracking systems and advanced security measures within mobile and static secure logistics options, are further enhancing market growth. The market is segmented by application (cash management showing significant growth due to increasing financial transactions, diamonds, jewelry, and precious metals benefiting from high-value cargo security, manufacturing requiring secure transport of sensitive materials, and others representing diverse sectors), by type (static and mobile solutions catering to varying needs), and by mode of transport (roadways, railways, airways, and others reflecting diverse logistical routes). The presence of established players like Secure Logistics LLC, GardaWorld, Brink's, and Prosegur, alongside emerging companies, indicates a competitive yet dynamic market landscape. Regional variations exist, with North America and Europe holding significant market share, but the Asia-Pacific region is projected to witness substantial growth due to rapid economic expansion and increasing e-commerce activity.
Secure Logistics Market Market Size (In Billion)
The market faces certain restraints, including fluctuating fuel prices impacting transportation costs and the need for continuous investments in advanced security technologies to combat evolving threats. However, the overall market outlook remains positive. Strategic partnerships and mergers & acquisitions are anticipated to reshape the market landscape, leading to increased efficiency and improved service offerings. Growth will likely be driven by continuous innovation in technology, improved infrastructure, and the rising demand for secure transportation of high-value goods across diverse industries globally. The forecast period (2025-2033) promises continued expansion, with specific segments like mobile secure logistics and those focused on high-value commodities showing particularly promising growth trajectories. The projected CAGR suggests a substantial increase in market value by 2033, highlighting significant investment opportunities within the secure logistics sector.
Secure Logistics Market Company Market Share
Secure Logistics Market: A Comprehensive Report (2019-2033)
This in-depth report provides a comprehensive analysis of the Secure Logistics Market, encompassing its dynamics, growth trends, key players, and future outlook. With a detailed examination of parent and child markets, this report offers invaluable insights for industry professionals, investors, and strategic decision-makers. The study period covers 2019-2033, with 2025 serving as the base and estimated year. The forecast period is 2025-2033 and the historical period is 2019-2024. The market is segmented by application (Cash Management, Diamonds, Jewelry and Precious Metals, Manufacturing, Others), type (Static, Mobile), and mode of transport (Roadways, Railways, Airways, Others). The total market size in 2025 is estimated at xx Million.
Secure Logistics Market Dynamics & Structure
The secure logistics market is characterized by moderate concentration, with key players like Secure Logistics LLC, GardaWorld, CargoGuard, Allied Universal, Lemuir Group, Prosegur, Brink's incorporated, PlanITROI Inc, CMS Info Systems, and Securitas AB holding significant market share. However, a considerable number of smaller players (73 other companies) also contribute to the market’s overall vibrancy. Technological innovation, particularly in areas like AI-powered surveillance and automated vehicle tracking, is a major growth driver. Stringent regulatory frameworks governing the transportation of high-value goods and sensitive data influence market practices. The market also faces competition from alternative solutions, such as digital asset management systems. Mergers and acquisitions (M&A) activity is relatively frequent, reflecting the consolidation trend within the industry. In 2024, xx Million worth of M&A deals were recorded in the sector.
- Market Concentration: Moderately concentrated, with top 10 players holding approximately xx% market share in 2024.
- Technological Innovation: AI, IoT, and blockchain technologies are driving automation and enhanced security measures.
- Regulatory Landscape: Stringent regulations for handling sensitive goods and data create both opportunities and challenges.
- Competitive Substitutes: Digital asset management systems pose a growing competitive threat.
- M&A Activity: Significant M&A activity observed, indicating industry consolidation and expansion.
- Innovation Barriers: High initial investment costs and integration complexities can hinder innovation adoption.
Secure Logistics Market Growth Trends & Insights
The secure logistics market experienced a CAGR of xx% during the historical period (2019-2024), reaching xx Million in 2024. This growth is attributed to several factors, including the increasing demand for secure transportation of high-value goods across various industries. The adoption rate of advanced security technologies is rising steadily, further fueling market expansion. Technological disruptions, such as the integration of AI and IoT in logistics operations, are transforming the industry landscape, improving efficiency and security. Consumer behavior shifts towards increased reliance on secure and reliable delivery services are contributing to market growth. The market is projected to continue its expansion, with a forecast CAGR of xx% during 2025-2033, reaching xx Million by 2033. Market penetration in key sectors like cash management and precious metals transportation is expected to increase significantly.
Dominant Regions, Countries, or Segments in Secure Logistics Market
North America currently holds the largest market share in the secure logistics sector, driven by robust economic growth and a high concentration of key players. Within this region, the United States displays the strongest growth potential due to its extensive logistics network and significant demand for secure transportation across various industries. The cash management segment dominates the applications market, while roadways are the most preferred mode of transport. The mobile segment is experiencing faster growth than the static segment due to increased demand for flexibility and on-demand security solutions.
- Key Regional Drivers: Strong economic growth in North America and Europe fuels high demand.
- Country-Specific Factors: The US market is characterized by high competition and technological adoption.
- Segmental Dominance: Cash management and roadways segments currently hold the largest market share.
- Growth Potential: Emerging markets in Asia-Pacific present significant growth opportunities.
- Infrastructure Development: Investments in advanced transportation infrastructure support market expansion.
Secure Logistics Market Product Landscape
The secure logistics market offers a diverse range of products, from basic armored vehicles and static security systems to sophisticated GPS tracking devices and AI-powered surveillance solutions. Product innovation focuses on enhancing security features, improving efficiency through automation, and providing real-time visibility and control over shipments. The unique selling propositions of products often revolve around cutting-edge technology integration, enhanced security protocols, and customer-specific solutions tailored to specific transportation needs. Technological advancements include the use of AI-powered predictive analytics to detect potential threats and improve route optimization.
Key Drivers, Barriers & Challenges in Secure Logistics Market
Key Drivers:
- Growing demand for secure transportation of high-value goods across diverse industries.
- Increasing adoption of advanced security technologies, driven by technological advancements.
- Stringent regulatory frameworks promoting secure logistics practices.
- Rising e-commerce activity, increasing the demand for secure last-mile delivery.
Challenges & Restraints:
- High initial investment costs for advanced security systems can act as a barrier to entry for smaller companies.
- Stringent regulatory compliance requirements can increase operational costs and complexity.
- Intense competition among established players can put pressure on profit margins. The competitive landscape is expected to remain intense over the forecast period. This competition may limit pricing power and drive innovation.
- Supply chain disruptions caused by global events can lead to delays and increase transportation costs.
Emerging Opportunities in Secure Logistics Market
- Growing demand for specialized secure logistics solutions for specific industries like pharmaceuticals and healthcare.
- Expanding use of blockchain technology to enhance transparency and security in supply chains.
- Increasing adoption of drone technology for secure and efficient delivery of goods.
- The rise of IoT-enabled smart containers for real-time monitoring of shipments.
Growth Accelerators in the Secure Logistics Market Industry
Technological advancements continue to be a major growth accelerator. Strategic partnerships between logistics providers and technology companies are facilitating innovation and market expansion. Government initiatives and investments in transportation infrastructure further contribute to market growth. The expansion into emerging markets with rising demand for secure logistics services presents significant growth opportunities.
Key Players Shaping the Secure Logistics Market Market
- Secure Logistics LLC
- GardaWorld
- CargoGuard
- Allied Universal
- Lemuir Group
- Prosegur
- Brink's incorporated
- PlanITROI Inc
- 73 Other Companies
- CMS Info Systems
- Securitas AB
Notable Milestones in Secure Logistics Market Sector
- July 2023: Artificial Intelligence Technology Solutions Inc. and Robotic Assistance Devices Inc. (RAD) partnered to deliver RAD products to GardaWorld Security Systems customers in Canada, showcasing the growing integration of AI in security solutions.
- June 2023: Prosegur Cash and Linfox Armaguard planned a merger, signifying consolidation within the Australian CIT market and highlighting the strategic importance of cash management services.
In-Depth Secure Logistics Market Market Outlook
The secure logistics market is poised for robust growth, driven by technological innovation, increasing demand for secure transportation, and strategic partnerships. The market's future potential lies in the adoption of advanced technologies such as AI, IoT, and blockchain, which will enhance security, efficiency, and transparency. Strategic acquisitions and partnerships will further consolidate market leadership and drive innovation. Companies focusing on developing specialized solutions and expanding into emerging markets will enjoy a competitive advantage.
Secure Logistics Market Segmentation
-
1. Application
- 1.1. Cash Management
- 1.2. Diamonds
- 1.3. Jewelry and Precious Metal
- 1.4. Manufacturing
- 1.5. Others
-
2. Type
- 2.1. Static
- 2.2. Mobile
-
3. Mode of Transport
- 3.1. Roadways
- 3.2. Railways
- 3.3. Airways
- 3.4. Others
Secure Logistics Market Segmentation By Geography
-
1. North America
- 1.1. United States
- 1.2. Canada
- 1.3. Mexico
-
2. Europe
- 2.1. Germany
- 2.2. France
- 2.3. France
- 2.4. Spain
- 2.5. Italy
- 2.6. Rest of Europe
-
3. Asia Pacific
- 3.1. China
- 3.2. India
- 3.3. Japan
- 3.4. Australia
- 3.5. Singapore
- 3.6. Malaysia
- 3.7. Thailand
- 3.8. Rest of Asia Pacific
-
4. Middle East and Africa
- 4.1. Saudi Arabia
- 4.2. Qatar
- 4.3. United Arab Emirates
- 4.4. Egypt
- 4.5. Rest of Middle East and Africa
-
5. Latin Maerica
- 5.1. Brazil
- 5.2. Argentina
- 5.3. Rest of Latin America
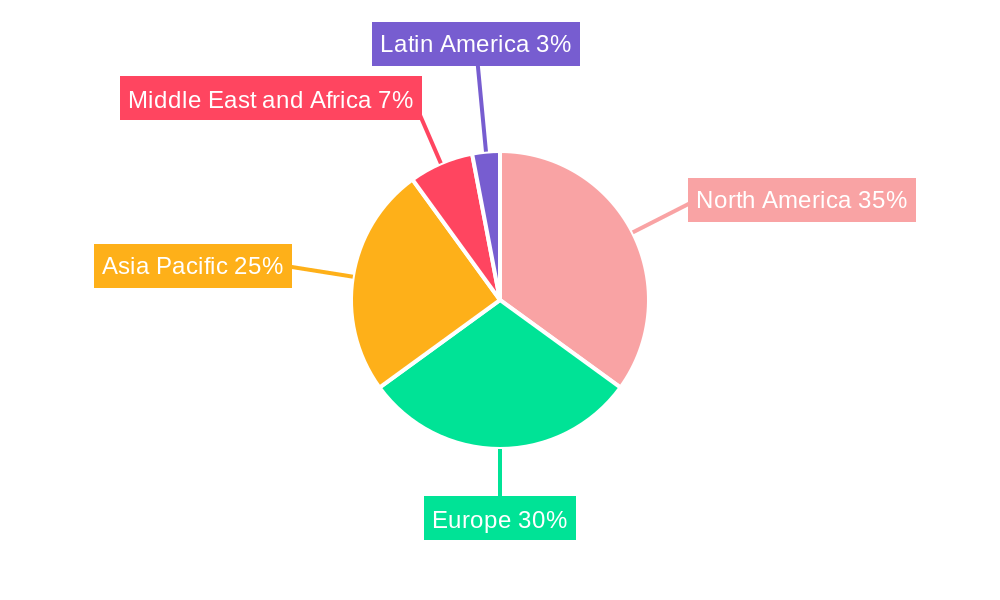
Secure Logistics Market Regional Market Share
Geographic Coverage of Secure Logistics Market
Secure Logistics Market REPORT HIGHLIGHTS
| Aspects | Details |
|---|---|
| Study Period | 2020-2034 |
| Base Year | 2025 |
| Estimated Year | 2026 |
| Forecast Period | 2026-2034 |
| Historical Period | 2020-2025 |
| Growth Rate | CAGR of 7.1% from 2020-2034 |
| Segmentation |
|
Table of Contents
- 1. Introduction
- 1.1. Research Scope
- 1.2. Market Segmentation
- 1.3. Research Objective
- 1.4. Definitions and Assumptions
- 2. Executive Summary
- 2.1. Market Snapshot
- 3. Market Dynamics
- 3.1. Market Drivers
- 3.2. Market Restrains
- 3.3. Market Trends
- 3.4. Market Opportunities
- 4. Market Factor Analysis
- 4.1. Porters Five Forces
- 4.1.1. Bargaining Power of Suppliers
- 4.1.2. Bargaining Power of Buyers
- 4.1.3. Threat of New Entrants
- 4.1.4. Threat of Substitutes
- 4.1.5. Competitive Rivalry
- 4.2. PESTEL analysis
- 4.3. BCG Analysis
- 4.3.1. Stars (High Growth, High Market Share)
- 4.3.2. Cash Cows (Low Growth, High Market Share)
- 4.3.3. Question Mark (High Growth, Low Market Share)
- 4.3.4. Dogs (Low Growth, Low Market Share)
- 4.4. Ansoff Matrix Analysis
- 4.5. Supply Chain Analysis
- 4.6. Regulatory Landscape
- 4.7. Current Market Potential and Opportunity Assessment (TAM–SAM–SOM Framework)
- 4.8. NRP Analyst Note
- 4.1. Porters Five Forces
- 5. Market Analysis, Insights and Forecast 2021-2033
- 5.1. Market Analysis, Insights and Forecast - by Application
- 5.1.1. Cash Management
- 5.1.2. Diamonds
- 5.1.3. Jewelry and Precious Metal
- 5.1.4. Manufacturing
- 5.1.5. Others
- 5.2. Market Analysis, Insights and Forecast - by Type
- 5.2.1. Static
- 5.2.2. Mobile
- 5.3. Market Analysis, Insights and Forecast - by Mode of Transport
- 5.3.1. Roadways
- 5.3.2. Railways
- 5.3.3. Airways
- 5.3.4. Others
- 5.4. Market Analysis, Insights and Forecast - by Region
- 5.4.1. North America
- 5.4.2. Europe
- 5.4.3. Asia Pacific
- 5.4.4. Middle East and Africa
- 5.4.5. Latin Maerica
- 5.1. Market Analysis, Insights and Forecast - by Application
- 6. Global Secure Logistics Market Analysis, Insights and Forecast, 2021-2033
- 6.1. Market Analysis, Insights and Forecast - by Application
- 6.1.1. Cash Management
- 6.1.2. Diamonds
- 6.1.3. Jewelry and Precious Metal
- 6.1.4. Manufacturing
- 6.1.5. Others
- 6.2. Market Analysis, Insights and Forecast - by Type
- 6.2.1. Static
- 6.2.2. Mobile
- 6.3. Market Analysis, Insights and Forecast - by Mode of Transport
- 6.3.1. Roadways
- 6.3.2. Railways
- 6.3.3. Airways
- 6.3.4. Others
- 6.1. Market Analysis, Insights and Forecast - by Application
- 7. North America Secure Logistics Market Analysis, Insights and Forecast, 2020-2032
- 7.1. Market Analysis, Insights and Forecast - by Application
- 7.1.1. Cash Management
- 7.1.2. Diamonds
- 7.1.3. Jewelry and Precious Metal
- 7.1.4. Manufacturing
- 7.1.5. Others
- 7.2. Market Analysis, Insights and Forecast - by Type
- 7.2.1. Static
- 7.2.2. Mobile
- 7.3. Market Analysis, Insights and Forecast - by Mode of Transport
- 7.3.1. Roadways
- 7.3.2. Railways
- 7.3.3. Airways
- 7.3.4. Others
- 7.1. Market Analysis, Insights and Forecast - by Application
- 8. Europe Secure Logistics Market Analysis, Insights and Forecast, 2020-2032
- 8.1. Market Analysis, Insights and Forecast - by Application
- 8.1.1. Cash Management
- 8.1.2. Diamonds
- 8.1.3. Jewelry and Precious Metal
- 8.1.4. Manufacturing
- 8.1.5. Others
- 8.2. Market Analysis, Insights and Forecast - by Type
- 8.2.1. Static
- 8.2.2. Mobile
- 8.3. Market Analysis, Insights and Forecast - by Mode of Transport
- 8.3.1. Roadways
- 8.3.2. Railways
- 8.3.3. Airways
- 8.3.4. Others
- 8.1. Market Analysis, Insights and Forecast - by Application
- 9. Asia Pacific Secure Logistics Market Analysis, Insights and Forecast, 2020-2032
- 9.1. Market Analysis, Insights and Forecast - by Application
- 9.1.1. Cash Management
- 9.1.2. Diamonds
- 9.1.3. Jewelry and Precious Metal
- 9.1.4. Manufacturing
- 9.1.5. Others
- 9.2. Market Analysis, Insights and Forecast - by Type
- 9.2.1. Static
- 9.2.2. Mobile
- 9.3. Market Analysis, Insights and Forecast - by Mode of Transport
- 9.3.1. Roadways
- 9.3.2. Railways
- 9.3.3. Airways
- 9.3.4. Others
- 9.1. Market Analysis, Insights and Forecast - by Application
- 10. Middle East and Africa Secure Logistics Market Analysis, Insights and Forecast, 2020-2032
- 10.1. Market Analysis, Insights and Forecast - by Application
- 10.1.1. Cash Management
- 10.1.2. Diamonds
- 10.1.3. Jewelry and Precious Metal
- 10.1.4. Manufacturing
- 10.1.5. Others
- 10.2. Market Analysis, Insights and Forecast - by Type
- 10.2.1. Static
- 10.2.2. Mobile
- 10.3. Market Analysis, Insights and Forecast - by Mode of Transport
- 10.3.1. Roadways
- 10.3.2. Railways
- 10.3.3. Airways
- 10.3.4. Others
- 10.1. Market Analysis, Insights and Forecast - by Application
- 11. Latin Maerica Secure Logistics Market Analysis, Insights and Forecast, 2020-2032
- 11.1. Market Analysis, Insights and Forecast - by Application
- 11.1.1. Cash Management
- 11.1.2. Diamonds
- 11.1.3. Jewelry and Precious Metal
- 11.1.4. Manufacturing
- 11.1.5. Others
- 11.2. Market Analysis, Insights and Forecast - by Type
- 11.2.1. Static
- 11.2.2. Mobile
- 11.3. Market Analysis, Insights and Forecast - by Mode of Transport
- 11.3.1. Roadways
- 11.3.2. Railways
- 11.3.3. Airways
- 11.3.4. Others
- 11.1. Market Analysis, Insights and Forecast - by Application
- 12. Competitive Analysis
- 12.1. Company Profiles
- 12.1.1 Secure Logistics LLC
- 12.1.1.1. Company Overview
- 12.1.1.2. Products
- 12.1.1.3. Company Financials
- 12.1.1.4. SWOT Analysis
- 12.1.2 GardaWorld
- 12.1.2.1. Company Overview
- 12.1.2.2. Products
- 12.1.2.3. Company Financials
- 12.1.2.4. SWOT Analysis
- 12.1.3 CargoGuard
- 12.1.3.1. Company Overview
- 12.1.3.2. Products
- 12.1.3.3. Company Financials
- 12.1.3.4. SWOT Analysis
- 12.1.4 Allied Universal
- 12.1.4.1. Company Overview
- 12.1.4.2. Products
- 12.1.4.3. Company Financials
- 12.1.4.4. SWOT Analysis
- 12.1.5 Lemuir Group
- 12.1.5.1. Company Overview
- 12.1.5.2. Products
- 12.1.5.3. Company Financials
- 12.1.5.4. SWOT Analysis
- 12.1.6 Prosegur
- 12.1.6.1. Company Overview
- 12.1.6.2. Products
- 12.1.6.3. Company Financials
- 12.1.6.4. SWOT Analysis
- 12.1.7 Brink's incorporated
- 12.1.7.1. Company Overview
- 12.1.7.2. Products
- 12.1.7.3. Company Financials
- 12.1.7.4. SWOT Analysis
- 12.1.8 PlanITROI Inc **List Not Exhaustive 7 3 Other Companie
- 12.1.8.1. Company Overview
- 12.1.8.2. Products
- 12.1.8.3. Company Financials
- 12.1.8.4. SWOT Analysis
- 12.1.9 CMS Info Systems
- 12.1.9.1. Company Overview
- 12.1.9.2. Products
- 12.1.9.3. Company Financials
- 12.1.9.4. SWOT Analysis
- 12.1.10 Securitas AB
- 12.1.10.1. Company Overview
- 12.1.10.2. Products
- 12.1.10.3. Company Financials
- 12.1.10.4. SWOT Analysis
- 12.1.1 Secure Logistics LLC
- 12.2. Market Entropy
- 12.2.1 Company's Key Areas Served
- 12.2.2 Recent Developments
- 12.3. Company Market Share Analysis 2025
- 12.3.1 Top 5 Companies Market Share Analysis
- 12.3.2 Top 3 Companies Market Share Analysis
- 12.4. List of Potential Customers
- 13. Research Methodology
List of Figures
- Figure 1: Global Secure Logistics Market Revenue Breakdown (billion, %) by Region 2025 & 2033
- Figure 2: North America Secure Logistics Market Revenue (billion), by Application 2025 & 2033
- Figure 3: North America Secure Logistics Market Revenue Share (%), by Application 2025 & 2033
- Figure 4: North America Secure Logistics Market Revenue (billion), by Type 2025 & 2033
- Figure 5: North America Secure Logistics Market Revenue Share (%), by Type 2025 & 2033
- Figure 6: North America Secure Logistics Market Revenue (billion), by Mode of Transport 2025 & 2033
- Figure 7: North America Secure Logistics Market Revenue Share (%), by Mode of Transport 2025 & 2033
- Figure 8: North America Secure Logistics Market Revenue (billion), by Country 2025 & 2033
- Figure 9: North America Secure Logistics Market Revenue Share (%), by Country 2025 & 2033
- Figure 10: Europe Secure Logistics Market Revenue (billion), by Application 2025 & 2033
- Figure 11: Europe Secure Logistics Market Revenue Share (%), by Application 2025 & 2033
- Figure 12: Europe Secure Logistics Market Revenue (billion), by Type 2025 & 2033
- Figure 13: Europe Secure Logistics Market Revenue Share (%), by Type 2025 & 2033
- Figure 14: Europe Secure Logistics Market Revenue (billion), by Mode of Transport 2025 & 2033
- Figure 15: Europe Secure Logistics Market Revenue Share (%), by Mode of Transport 2025 & 2033
- Figure 16: Europe Secure Logistics Market Revenue (billion), by Country 2025 & 2033
- Figure 17: Europe Secure Logistics Market Revenue Share (%), by Country 2025 & 2033
- Figure 18: Asia Pacific Secure Logistics Market Revenue (billion), by Application 2025 & 2033
- Figure 19: Asia Pacific Secure Logistics Market Revenue Share (%), by Application 2025 & 2033
- Figure 20: Asia Pacific Secure Logistics Market Revenue (billion), by Type 2025 & 2033
- Figure 21: Asia Pacific Secure Logistics Market Revenue Share (%), by Type 2025 & 2033
- Figure 22: Asia Pacific Secure Logistics Market Revenue (billion), by Mode of Transport 2025 & 2033
- Figure 23: Asia Pacific Secure Logistics Market Revenue Share (%), by Mode of Transport 2025 & 2033
- Figure 24: Asia Pacific Secure Logistics Market Revenue (billion), by Country 2025 & 2033
- Figure 25: Asia Pacific Secure Logistics Market Revenue Share (%), by Country 2025 & 2033
- Figure 26: Middle East and Africa Secure Logistics Market Revenue (billion), by Application 2025 & 2033
- Figure 27: Middle East and Africa Secure Logistics Market Revenue Share (%), by Application 2025 & 2033
- Figure 28: Middle East and Africa Secure Logistics Market Revenue (billion), by Type 2025 & 2033
- Figure 29: Middle East and Africa Secure Logistics Market Revenue Share (%), by Type 2025 & 2033
- Figure 30: Middle East and Africa Secure Logistics Market Revenue (billion), by Mode of Transport 2025 & 2033
- Figure 31: Middle East and Africa Secure Logistics Market Revenue Share (%), by Mode of Transport 2025 & 2033
- Figure 32: Middle East and Africa Secure Logistics Market Revenue (billion), by Country 2025 & 2033
- Figure 33: Middle East and Africa Secure Logistics Market Revenue Share (%), by Country 2025 & 2033
- Figure 34: Latin Maerica Secure Logistics Market Revenue (billion), by Application 2025 & 2033
- Figure 35: Latin Maerica Secure Logistics Market Revenue Share (%), by Application 2025 & 2033
- Figure 36: Latin Maerica Secure Logistics Market Revenue (billion), by Type 2025 & 2033
- Figure 37: Latin Maerica Secure Logistics Market Revenue Share (%), by Type 2025 & 2033
- Figure 38: Latin Maerica Secure Logistics Market Revenue (billion), by Mode of Transport 2025 & 2033
- Figure 39: Latin Maerica Secure Logistics Market Revenue Share (%), by Mode of Transport 2025 & 2033
- Figure 40: Latin Maerica Secure Logistics Market Revenue (billion), by Country 2025 & 2033
- Figure 41: Latin Maerica Secure Logistics Market Revenue Share (%), by Country 2025 & 2033
List of Tables
- Table 1: Global Secure Logistics Market Revenue billion Forecast, by Application 2020 & 2033
- Table 2: Global Secure Logistics Market Revenue billion Forecast, by Type 2020 & 2033
- Table 3: Global Secure Logistics Market Revenue billion Forecast, by Mode of Transport 2020 & 2033
- Table 4: Global Secure Logistics Market Revenue billion Forecast, by Region 2020 & 2033
- Table 5: Global Secure Logistics Market Revenue billion Forecast, by Application 2020 & 2033
- Table 6: Global Secure Logistics Market Revenue billion Forecast, by Type 2020 & 2033
- Table 7: Global Secure Logistics Market Revenue billion Forecast, by Mode of Transport 2020 & 2033
- Table 8: Global Secure Logistics Market Revenue billion Forecast, by Country 2020 & 2033
- Table 9: United States Secure Logistics Market Revenue (billion) Forecast, by Application 2020 & 2033
- Table 10: Canada Secure Logistics Market Revenue (billion) Forecast, by Application 2020 & 2033
- Table 11: Mexico Secure Logistics Market Revenue (billion) Forecast, by Application 2020 & 2033
- Table 12: Global Secure Logistics Market Revenue billion Forecast, by Application 2020 & 2033
- Table 13: Global Secure Logistics Market Revenue billion Forecast, by Type 2020 & 2033
- Table 14: Global Secure Logistics Market Revenue billion Forecast, by Mode of Transport 2020 & 2033
- Table 15: Global Secure Logistics Market Revenue billion Forecast, by Country 2020 & 2033
- Table 16: Germany Secure Logistics Market Revenue (billion) Forecast, by Application 2020 & 2033
- Table 17: France Secure Logistics Market Revenue (billion) Forecast, by Application 2020 & 2033
- Table 18: France Secure Logistics Market Revenue (billion) Forecast, by Application 2020 & 2033
- Table 19: Spain Secure Logistics Market Revenue (billion) Forecast, by Application 2020 & 2033
- Table 20: Italy Secure Logistics Market Revenue (billion) Forecast, by Application 2020 & 2033
- Table 21: Rest of Europe Secure Logistics Market Revenue (billion) Forecast, by Application 2020 & 2033
- Table 22: Global Secure Logistics Market Revenue billion Forecast, by Application 2020 & 2033
- Table 23: Global Secure Logistics Market Revenue billion Forecast, by Type 2020 & 2033
- Table 24: Global Secure Logistics Market Revenue billion Forecast, by Mode of Transport 2020 & 2033
- Table 25: Global Secure Logistics Market Revenue billion Forecast, by Country 2020 & 2033
- Table 26: China Secure Logistics Market Revenue (billion) Forecast, by Application 2020 & 2033
- Table 27: India Secure Logistics Market Revenue (billion) Forecast, by Application 2020 & 2033
- Table 28: Japan Secure Logistics Market Revenue (billion) Forecast, by Application 2020 & 2033
- Table 29: Australia Secure Logistics Market Revenue (billion) Forecast, by Application 2020 & 2033
- Table 30: Singapore Secure Logistics Market Revenue (billion) Forecast, by Application 2020 & 2033
- Table 31: Malaysia Secure Logistics Market Revenue (billion) Forecast, by Application 2020 & 2033
- Table 32: Thailand Secure Logistics Market Revenue (billion) Forecast, by Application 2020 & 2033
- Table 33: Rest of Asia Pacific Secure Logistics Market Revenue (billion) Forecast, by Application 2020 & 2033
- Table 34: Global Secure Logistics Market Revenue billion Forecast, by Application 2020 & 2033
- Table 35: Global Secure Logistics Market Revenue billion Forecast, by Type 2020 & 2033
- Table 36: Global Secure Logistics Market Revenue billion Forecast, by Mode of Transport 2020 & 2033
- Table 37: Global Secure Logistics Market Revenue billion Forecast, by Country 2020 & 2033
- Table 38: Saudi Arabia Secure Logistics Market Revenue (billion) Forecast, by Application 2020 & 2033
- Table 39: Qatar Secure Logistics Market Revenue (billion) Forecast, by Application 2020 & 2033
- Table 40: United Arab Emirates Secure Logistics Market Revenue (billion) Forecast, by Application 2020 & 2033
- Table 41: Egypt Secure Logistics Market Revenue (billion) Forecast, by Application 2020 & 2033
- Table 42: Rest of Middle East and Africa Secure Logistics Market Revenue (billion) Forecast, by Application 2020 & 2033
- Table 43: Global Secure Logistics Market Revenue billion Forecast, by Application 2020 & 2033
- Table 44: Global Secure Logistics Market Revenue billion Forecast, by Type 2020 & 2033
- Table 45: Global Secure Logistics Market Revenue billion Forecast, by Mode of Transport 2020 & 2033
- Table 46: Global Secure Logistics Market Revenue billion Forecast, by Country 2020 & 2033
- Table 47: Brazil Secure Logistics Market Revenue (billion) Forecast, by Application 2020 & 2033
- Table 48: Argentina Secure Logistics Market Revenue (billion) Forecast, by Application 2020 & 2033
- Table 49: Rest of Latin America Secure Logistics Market Revenue (billion) Forecast, by Application 2020 & 2033
Frequently Asked Questions
1. What is the projected Compound Annual Growth Rate (CAGR) of the Secure Logistics Market?
The projected CAGR is approximately 7.1%.
2. Which companies are prominent players in the Secure Logistics Market?
Key companies in the market include Secure Logistics LLC, GardaWorld, CargoGuard, Allied Universal, Lemuir Group, Prosegur, Brink's incorporated, PlanITROI Inc **List Not Exhaustive 7 3 Other Companie, CMS Info Systems, Securitas AB.
3. What are the main segments of the Secure Logistics Market?
The market segments include Application, Type, Mode of Transport.
4. Can you provide details about the market size?
The market size is estimated to be USD 91.53 billion as of 2022.
5. What are some drivers contributing to market growth?
The Growth of Banking and Financial Institutions in Emerging Economies; Mobile Payments are Being Increasingly Used.
6. What are the notable trends driving market growth?
During the Forecast Period. the Asia-Pacific Market is Expected to Grow at the Fastest Pace.
7. Are there any restraints impacting market growth?
Increasing Usage of Payments from Mobile.
8. Can you provide examples of recent developments in the market?
July 2023: Artificial Intelligence Technology Solutions Inc. and its wholly owned subsidiary, Robotic Assistance Devices Inc. (RAD), established a partnership to deliver RAD products to GardaWorld Security Systems customers in Canada. GardaWorld Security Systems' commitment to providing cutting-edge technology is reflected in this new partnership.
9. What pricing options are available for accessing the report?
Pricing options include single-user, multi-user, and enterprise licenses priced at USD 4750, USD 5250, and USD 8750 respectively.
10. Is the market size provided in terms of value or volume?
The market size is provided in terms of value, measured in billion.
11. Are there any specific market keywords associated with the report?
Yes, the market keyword associated with the report is "Secure Logistics Market," which aids in identifying and referencing the specific market segment covered.
12. How do I determine which pricing option suits my needs best?
The pricing options vary based on user requirements and access needs. Individual users may opt for single-user licenses, while businesses requiring broader access may choose multi-user or enterprise licenses for cost-effective access to the report.
13. Are there any additional resources or data provided in the Secure Logistics Market report?
While the report offers comprehensive insights, it's advisable to review the specific contents or supplementary materials provided to ascertain if additional resources or data are available.
14. How can I stay updated on further developments or reports in the Secure Logistics Market?
To stay informed about further developments, trends, and reports in the Secure Logistics Market, consider subscribing to industry newsletters, following relevant companies and organizations, or regularly checking reputable industry news sources and publications.
Methodology
Step 1 - Identification of Relevant Samples Size from Population Database


Step 2 - Approaches for Defining Global Market Size (Value, Volume* & Price*)

Note*: In applicable scenarios
Step 3 - Data Sources
Primary Research
- Web Analytics
- Survey Reports
- Research Institute
- Latest Research Reports
- Opinion Leaders
Secondary Research
- Annual Reports
- White Paper
- Latest Press Release
- Industry Association
- Paid Database
- Investor Presentations

Step 4 - Data Triangulation
Involves using different sources of information in order to increase the validity of a study
These sources are likely to be stakeholders in a program - participants, other researchers, program staff, other community members, and so on.
Then we put all data in single framework & apply various statistical tools to find out the dynamic on the market.
During the analysis stage, feedback from the stakeholder groups would be compared to determine areas of agreement as well as areas of divergence