

Key Insights
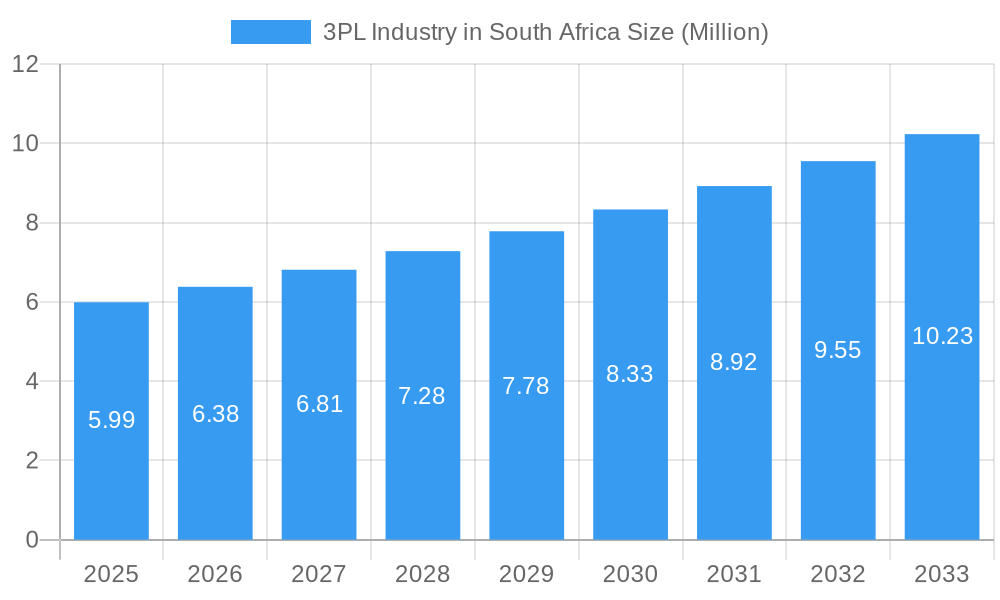
The South African 3PL (Third-Party Logistics) market, valued at $5.99 million in 2025, is poised for significant growth, exhibiting a Compound Annual Growth Rate (CAGR) of 6.64% from 2025 to 2033. This expansion is driven by several key factors. The burgeoning e-commerce sector in South Africa fuels the demand for efficient warehousing and distribution solutions, particularly within the distributive trade (wholesale and retail, including e-commerce) segment. Simultaneously, the growth of manufacturing and automotive industries necessitates robust domestic and international transportation management services. Increased focus on supply chain optimization and cost reduction across various sectors, including oil & gas, chemicals, pharmaceuticals, and construction, further contributes to the market's expansion. While infrastructural limitations and fluctuating fuel prices may pose challenges, the overall positive outlook for economic growth in South Africa supports the continued expansion of the 3PL market. Key players like DHL, DB Schenker, and Kuehne + Nagel are well-positioned to capitalize on these opportunities, while smaller, specialized 3PL providers are also experiencing growth, particularly those focusing on niche sectors like pharmaceuticals or e-commerce fulfillment. The competitive landscape is characterized by both established international players and local South African companies vying for market share, leading to innovation and improved service offerings.
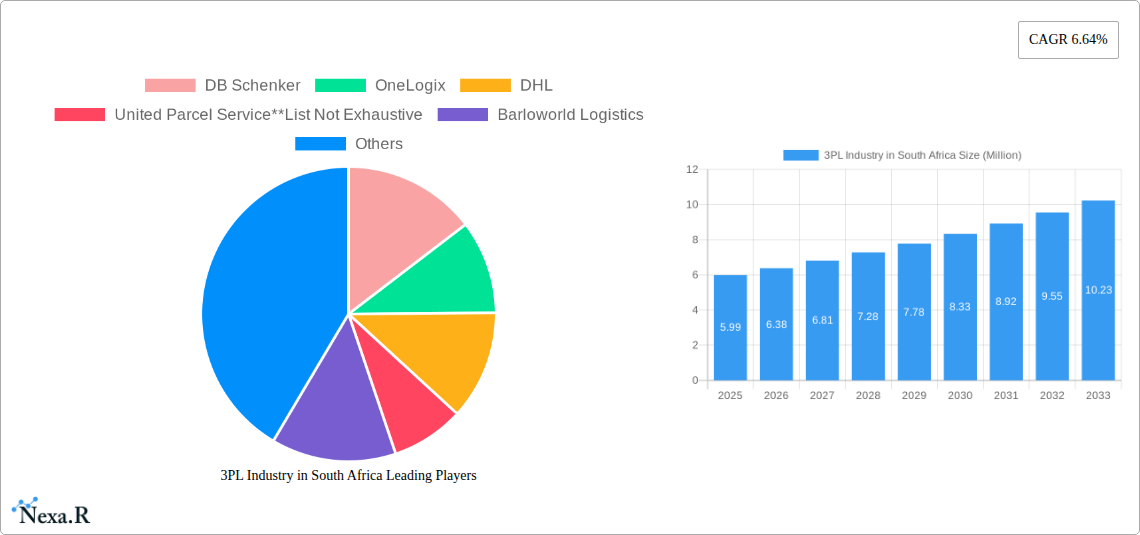
3PL Industry in South Africa Market Size (In Million)
The South African 3PL market segmentation reveals a strong reliance on domestic transportation management, reflecting the localized nature of many businesses. However, the increasing global integration of South African businesses is driving growth in international transportation management. Value-added warehousing and distribution services are gaining traction, as businesses seek more comprehensive supply chain solutions beyond basic transportation. Within the end-user segments, manufacturing and automotive sectors dominate, reflecting the industrial base of the South African economy. However, growth within the distributive trade, driven by e-commerce expansion, is expected to rapidly close the gap, becoming a major contributor to 3PL market revenue in the coming years. The strategic location of South Africa within Africa, and its strong transportation links, positions it to serve as a logistics hub for the wider region, further strengthening the market's growth potential. Careful analysis of regulatory changes, macroeconomic conditions, and technological advancements is crucial for navigating this dynamic market.
3PL Industry in South Africa Company Market Share
3PL Industry in South Africa: A Comprehensive Market Report (2019-2033)
This report provides an in-depth analysis of the South African 3PL (Third-Party Logistics) industry, covering market dynamics, growth trends, key players, and future outlook. The study period spans from 2019 to 2033, with 2025 as the base and estimated year. The report segments the market by service (domestic and international transportation management, value-added warehousing and distribution) and end-user (manufacturing & automotive, oil & gas and chemicals, distributive trade, pharma & healthcare, construction, and others). It offers crucial insights for industry professionals, investors, and businesses seeking to understand and navigate this dynamic market. The market size is projected to reach xx Million by 2033.
3PL Industry in South Africa Market Dynamics & Structure
The South African 3PL market is characterized by a moderately concentrated landscape, with a mix of global giants and local players. Key players like DHL, DB Schenker, and Kuehne + Nagel compete with established local firms such as Barloworld Logistics and Bidvest International Logistics. Technological innovation, particularly in areas like automation and data analytics, is a significant driver, while regulatory frameworks, such as those related to customs and transportation, heavily influence market operations. The increasing adoption of e-commerce fuels demand for value-added warehousing and distribution services, creating a significant growth opportunity. Substitutes include in-house logistics solutions, although these are often less cost-effective for many businesses. Furthermore, mergers and acquisitions (M&A) activity is steadily increasing, reflecting consolidation trends within the sector.
- Market Concentration: Moderately concentrated, with a few large players holding significant market share (estimated at xx% for the top 5 players in 2025).
- Technological Innovation: Significant driver, particularly in automation (robotics in warehouses), data analytics for supply chain optimization, and digital platforms for tracking and management.
- Regulatory Framework: Stringent regulations impacting customs, transportation, and safety standards create both opportunities and challenges.
- M&A Activity: Increasing deal volume (xx deals in 2024, projected to reach xx in 2025) reflects industry consolidation.
- End-User Demographics: Growing e-commerce sector significantly boosts demand for 3PL services, particularly in distributive trade and related sectors.
3PL Industry in South Africa Growth Trends & Insights
The South African 3PL market experienced robust growth during the historical period (2019-2024). Factors like increasing e-commerce adoption, rising manufacturing activity, and the growth of the logistics sector itself are major drivers of this expansion. The market is expected to continue its growth trajectory, albeit at a moderated pace, during the forecast period (2025-2033). Technological disruptions, such as the adoption of Artificial Intelligence (AI) and blockchain technology, are further influencing market evolution. Shifts in consumer behavior, towards faster delivery expectations and increased demand for transparency in supply chains, also play a significant role in shaping industry growth.
- Market Size: Reached xx Million in 2024, projected to reach xx Million in 2025 and xx Million by 2033.
- CAGR: Estimated at xx% for the forecast period (2025-2033).
- Market Penetration: Significant room for growth, particularly in untapped segments like smaller businesses and specialized industries.
- Technological Disruptions: AI, Blockchain, and automation are driving efficiency gains and reshaping service offerings.
- Consumer Behavior Shifts: Demand for faster, more transparent, and reliable logistics solutions is increasing.
Dominant Regions, Countries, or Segments in 3PL Industry in South Africa
The Gauteng province dominates the South African 3PL market due to its central location, strong infrastructure, and concentration of major industries. Within the service segments, value-added warehousing and distribution show the highest growth potential, driven by the rise of e-commerce. In terms of end-users, the manufacturing & automotive sector, followed by distributive trade (wholesale and retail, including e-commerce), represent the largest market segments.
- Gauteng Province: Dominant region due to central location, infrastructure, and industry concentration.
- Value-added Warehousing & Distribution: Fastest-growing service segment due to e-commerce boom.
- Manufacturing & Automotive: Largest end-user segment, due to high production volume and complex supply chains.
- Distributive Trade (E-commerce): Rapid growth driven by online retail expansion.
- Key Drivers: Government infrastructure investment, improved transportation networks, and supportive economic policies facilitate growth.
3PL Industry in South Africa Product Landscape
The South African 3PL market offers a diverse range of services, encompassing domestic and international transportation, warehousing, inventory management, and value-added services like packaging and labeling. Recent innovations include the integration of technology for real-time tracking, advanced warehousing management systems (WMS), and optimized route planning software. These advancements offer increased efficiency, transparency, and cost savings for clients. Unique selling propositions often center on customized solutions, specialized industry expertise, and reliable service delivery.
Key Drivers, Barriers & Challenges in 3PL Industry in South Africa
Key Drivers: The rise of e-commerce, increasing globalization, and the need for efficient supply chains are major growth drivers. Government initiatives focused on infrastructure development also play a significant role. Technological advancements, like automation and data analytics, further contribute to enhanced efficiency and cost optimization.
Challenges & Restraints: High infrastructure costs, inconsistent transportation networks, and skills shortages remain significant hurdles. Regulatory complexities and bureaucratic processes can add operational costs and delays. Intense competition, both from domestic and international players, necessitates continuous innovation and cost management.
Emerging Opportunities in 3PL Industry in South Africa
Untapped opportunities exist within specialized sectors like pharmaceuticals and healthcare, which require stringent temperature-controlled logistics. The growth of e-commerce presents substantial potential for expanding last-mile delivery services and optimizing fulfillment operations. Focus on sustainable logistics practices, like utilizing green transportation options, also presents a strong opportunity for market differentiation.
Growth Accelerators in the 3PL Industry in South Africa Industry
Strategic partnerships between 3PL providers and technology companies are accelerating market growth, driving the adoption of advanced technologies. Investment in infrastructure and training programs aimed at addressing skills gaps also boost industry competitiveness and expansion. Market expansion strategies, such as focusing on underserved regions and offering specialized services, contribute to long-term growth.
Key Players Shaping the 3PL Industry in South Africa Market
- DB Schenker
- OneLogix
- DHL
- United Parcel Service
- Barloworld Logistics
- Vital Distribution
- CEVA Logistics
- Kuehne + Nagel
- Transnova
- Bidvest International Logistics
- Bollore Logistics
- DPD Laser Express Logistics
- Value Logistics
- DSV
- City Logistics
Notable Milestones in 3PL Industry in South Africa Sector
- 2022: Increased investment in automated warehousing solutions by several major players.
- 2023: Launch of several new e-commerce fulfillment centers, catering to the burgeoning online retail sector.
- 2024: Significant M&A activity, with several smaller 3PL firms acquired by larger companies.
In-Depth 3PL Industry in South Africa Market Outlook
The South African 3PL market is poised for continued growth, driven by a combination of technological advancements, expanding e-commerce, and rising demand for efficient supply chain solutions. Strategic investments in infrastructure, technology, and talent development will be key to unlocking the market's full potential. Companies that successfully adapt to evolving consumer expectations and leverage technological innovation will be best positioned to capitalize on future growth opportunities.
3PL Industry in South Africa Segmentation
-
1. Service
- 1.1. Domestic Transportation Management
- 1.2. International Transportation Management
- 1.3. Value-added Warehousing and Distribution
-
2. End-User
- 2.1. Manufacturing & Automotive
- 2.2. Oil & Gas and Chemicals
- 2.3. Distribu
- 2.4. Pharma & Healthcare
- 2.5. Construction
- 2.6. Other End Users
3PL Industry in South Africa Segmentation By Geography
-
1. North America
- 1.1. United States
- 1.2. Canada
- 1.3. Mexico
-
2. South America
- 2.1. Brazil
- 2.2. Argentina
- 2.3. Rest of South America
-
3. Europe
- 3.1. United Kingdom
- 3.2. Germany
- 3.3. France
- 3.4. Italy
- 3.5. Spain
- 3.6. Russia
- 3.7. Benelux
- 3.8. Nordics
- 3.9. Rest of Europe
-
4. Middle East & Africa
- 4.1. Turkey
- 4.2. Israel
- 4.3. GCC
- 4.4. North Africa
- 4.5. South Africa
- 4.6. Rest of Middle East & Africa
-
5. Asia Pacific
- 5.1. China
- 5.2. India
- 5.3. Japan
- 5.4. South Korea
- 5.5. ASEAN
- 5.6. Oceania
- 5.7. Rest of Asia Pacific
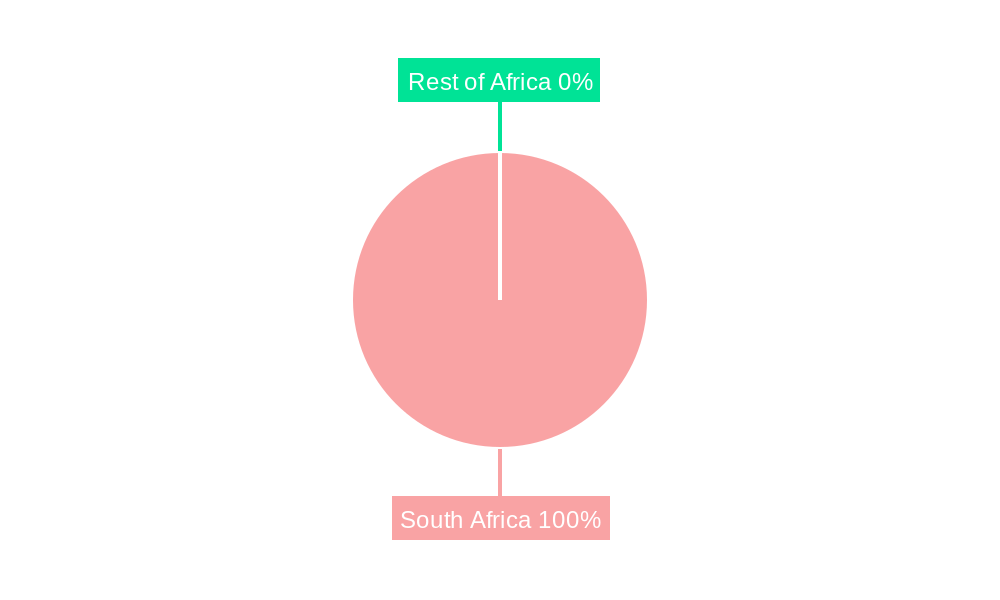
3PL Industry in South Africa Regional Market Share
Geographic Coverage of 3PL Industry in South Africa
3PL Industry in South Africa REPORT HIGHLIGHTS
| Aspects | Details |
|---|---|
| Study Period | 2020-2034 |
| Base Year | 2025 |
| Estimated Year | 2026 |
| Forecast Period | 2026-2034 |
| Historical Period | 2020-2025 |
| Growth Rate | CAGR of 6.64% from 2020-2034 |
| Segmentation |
|
Table of Contents
- 1. Introduction
- 1.1. Research Scope
- 1.2. Market Segmentation
- 1.3. Research Objective
- 1.4. Definitions and Assumptions
- 2. Executive Summary
- 2.1. Market Snapshot
- 3. Market Dynamics
- 3.1. Market Drivers
- 3.2. Market Restrains
- 3.3. Market Trends
- 3.4. Market Opportunities
- 4. Market Factor Analysis
- 4.1. Porters Five Forces
- 4.1.1. Bargaining Power of Suppliers
- 4.1.2. Bargaining Power of Buyers
- 4.1.3. Threat of New Entrants
- 4.1.4. Threat of Substitutes
- 4.1.5. Competitive Rivalry
- 4.2. PESTEL analysis
- 4.3. BCG Analysis
- 4.3.1. Stars (High Growth, High Market Share)
- 4.3.2. Cash Cows (Low Growth, High Market Share)
- 4.3.3. Question Mark (High Growth, Low Market Share)
- 4.3.4. Dogs (Low Growth, Low Market Share)
- 4.4. Ansoff Matrix Analysis
- 4.5. Supply Chain Analysis
- 4.6. Regulatory Landscape
- 4.7. Current Market Potential and Opportunity Assessment (TAM–SAM–SOM Framework)
- 4.8. NRP Analyst Note
- 4.1. Porters Five Forces
- 5. Market Analysis, Insights and Forecast 2021-2033
- 5.1. Market Analysis, Insights and Forecast - by Service
- 5.1.1. Domestic Transportation Management
- 5.1.2. International Transportation Management
- 5.1.3. Value-added Warehousing and Distribution
- 5.2. Market Analysis, Insights and Forecast - by End-User
- 5.2.1. Manufacturing & Automotive
- 5.2.2. Oil & Gas and Chemicals
- 5.2.3. Distribu
- 5.2.4. Pharma & Healthcare
- 5.2.5. Construction
- 5.2.6. Other End Users
- 5.3. Market Analysis, Insights and Forecast - by Region
- 5.3.1. North America
- 5.3.2. South America
- 5.3.3. Europe
- 5.3.4. Middle East & Africa
- 5.3.5. Asia Pacific
- 5.1. Market Analysis, Insights and Forecast - by Service
- 6. Global 3PL Industry in South Africa Analysis, Insights and Forecast, 2021-2033
- 6.1. Market Analysis, Insights and Forecast - by Service
- 6.1.1. Domestic Transportation Management
- 6.1.2. International Transportation Management
- 6.1.3. Value-added Warehousing and Distribution
- 6.2. Market Analysis, Insights and Forecast - by End-User
- 6.2.1. Manufacturing & Automotive
- 6.2.2. Oil & Gas and Chemicals
- 6.2.3. Distribu
- 6.2.4. Pharma & Healthcare
- 6.2.5. Construction
- 6.2.6. Other End Users
- 6.1. Market Analysis, Insights and Forecast - by Service
- 7. North America 3PL Industry in South Africa Analysis, Insights and Forecast, 2020-2032
- 7.1. Market Analysis, Insights and Forecast - by Service
- 7.1.1. Domestic Transportation Management
- 7.1.2. International Transportation Management
- 7.1.3. Value-added Warehousing and Distribution
- 7.2. Market Analysis, Insights and Forecast - by End-User
- 7.2.1. Manufacturing & Automotive
- 7.2.2. Oil & Gas and Chemicals
- 7.2.3. Distribu
- 7.2.4. Pharma & Healthcare
- 7.2.5. Construction
- 7.2.6. Other End Users
- 7.1. Market Analysis, Insights and Forecast - by Service
- 8. South America 3PL Industry in South Africa Analysis, Insights and Forecast, 2020-2032
- 8.1. Market Analysis, Insights and Forecast - by Service
- 8.1.1. Domestic Transportation Management
- 8.1.2. International Transportation Management
- 8.1.3. Value-added Warehousing and Distribution
- 8.2. Market Analysis, Insights and Forecast - by End-User
- 8.2.1. Manufacturing & Automotive
- 8.2.2. Oil & Gas and Chemicals
- 8.2.3. Distribu
- 8.2.4. Pharma & Healthcare
- 8.2.5. Construction
- 8.2.6. Other End Users
- 8.1. Market Analysis, Insights and Forecast - by Service
- 9. Europe 3PL Industry in South Africa Analysis, Insights and Forecast, 2020-2032
- 9.1. Market Analysis, Insights and Forecast - by Service
- 9.1.1. Domestic Transportation Management
- 9.1.2. International Transportation Management
- 9.1.3. Value-added Warehousing and Distribution
- 9.2. Market Analysis, Insights and Forecast - by End-User
- 9.2.1. Manufacturing & Automotive
- 9.2.2. Oil & Gas and Chemicals
- 9.2.3. Distribu
- 9.2.4. Pharma & Healthcare
- 9.2.5. Construction
- 9.2.6. Other End Users
- 9.1. Market Analysis, Insights and Forecast - by Service
- 10. Middle East & Africa 3PL Industry in South Africa Analysis, Insights and Forecast, 2020-2032
- 10.1. Market Analysis, Insights and Forecast - by Service
- 10.1.1. Domestic Transportation Management
- 10.1.2. International Transportation Management
- 10.1.3. Value-added Warehousing and Distribution
- 10.2. Market Analysis, Insights and Forecast - by End-User
- 10.2.1. Manufacturing & Automotive
- 10.2.2. Oil & Gas and Chemicals
- 10.2.3. Distribu
- 10.2.4. Pharma & Healthcare
- 10.2.5. Construction
- 10.2.6. Other End Users
- 10.1. Market Analysis, Insights and Forecast - by Service
- 11. Asia Pacific 3PL Industry in South Africa Analysis, Insights and Forecast, 2020-2032
- 11.1. Market Analysis, Insights and Forecast - by Service
- 11.1.1. Domestic Transportation Management
- 11.1.2. International Transportation Management
- 11.1.3. Value-added Warehousing and Distribution
- 11.2. Market Analysis, Insights and Forecast - by End-User
- 11.2.1. Manufacturing & Automotive
- 11.2.2. Oil & Gas and Chemicals
- 11.2.3. Distribu
- 11.2.4. Pharma & Healthcare
- 11.2.5. Construction
- 11.2.6. Other End Users
- 11.1. Market Analysis, Insights and Forecast - by Service
- 12. Competitive Analysis
- 12.1. Company Profiles
- 12.1.1 DB Schenker
- 12.1.1.1. Company Overview
- 12.1.1.2. Products
- 12.1.1.3. Company Financials
- 12.1.1.4. SWOT Analysis
- 12.1.2 OneLogix
- 12.1.2.1. Company Overview
- 12.1.2.2. Products
- 12.1.2.3. Company Financials
- 12.1.2.4. SWOT Analysis
- 12.1.3 DHL
- 12.1.3.1. Company Overview
- 12.1.3.2. Products
- 12.1.3.3. Company Financials
- 12.1.3.4. SWOT Analysis
- 12.1.4 United Parcel Service**List Not Exhaustive
- 12.1.4.1. Company Overview
- 12.1.4.2. Products
- 12.1.4.3. Company Financials
- 12.1.4.4. SWOT Analysis
- 12.1.5 Barloworld Logistics
- 12.1.5.1. Company Overview
- 12.1.5.2. Products
- 12.1.5.3. Company Financials
- 12.1.5.4. SWOT Analysis
- 12.1.6 Vital Distribution
- 12.1.6.1. Company Overview
- 12.1.6.2. Products
- 12.1.6.3. Company Financials
- 12.1.6.4. SWOT Analysis
- 12.1.7 CEVA Logistics
- 12.1.7.1. Company Overview
- 12.1.7.2. Products
- 12.1.7.3. Company Financials
- 12.1.7.4. SWOT Analysis
- 12.1.8 Kuehne + Nagel
- 12.1.8.1. Company Overview
- 12.1.8.2. Products
- 12.1.8.3. Company Financials
- 12.1.8.4. SWOT Analysis
- 12.1.9 Transnova
- 12.1.9.1. Company Overview
- 12.1.9.2. Products
- 12.1.9.3. Company Financials
- 12.1.9.4. SWOT Analysis
- 12.1.10 Bidvest International Logistics
- 12.1.10.1. Company Overview
- 12.1.10.2. Products
- 12.1.10.3. Company Financials
- 12.1.10.4. SWOT Analysis
- 12.1.11 Bollore Logistics
- 12.1.11.1. Company Overview
- 12.1.11.2. Products
- 12.1.11.3. Company Financials
- 12.1.11.4. SWOT Analysis
- 12.1.12 DPD Laser Express Logistics
- 12.1.12.1. Company Overview
- 12.1.12.2. Products
- 12.1.12.3. Company Financials
- 12.1.12.4. SWOT Analysis
- 12.1.13 Value Logistics
- 12.1.13.1. Company Overview
- 12.1.13.2. Products
- 12.1.13.3. Company Financials
- 12.1.13.4. SWOT Analysis
- 12.1.14 DSV
- 12.1.14.1. Company Overview
- 12.1.14.2. Products
- 12.1.14.3. Company Financials
- 12.1.14.4. SWOT Analysis
- 12.1.15 City Logistics
- 12.1.15.1. Company Overview
- 12.1.15.2. Products
- 12.1.15.3. Company Financials
- 12.1.15.4. SWOT Analysis
- 12.1.1 DB Schenker
- 12.2. Market Entropy
- 12.2.1 Company's Key Areas Served
- 12.2.2 Recent Developments
- 12.3. Company Market Share Analysis 2025
- 12.3.1 Top 5 Companies Market Share Analysis
- 12.3.2 Top 3 Companies Market Share Analysis
- 12.4. List of Potential Customers
- 13. Research Methodology
List of Figures
- Figure 1: Global 3PL Industry in South Africa Revenue Breakdown (Million, %) by Region 2025 & 2033
- Figure 2: North America 3PL Industry in South Africa Revenue (Million), by Service 2025 & 2033
- Figure 3: North America 3PL Industry in South Africa Revenue Share (%), by Service 2025 & 2033
- Figure 4: North America 3PL Industry in South Africa Revenue (Million), by End-User 2025 & 2033
- Figure 5: North America 3PL Industry in South Africa Revenue Share (%), by End-User 2025 & 2033
- Figure 6: North America 3PL Industry in South Africa Revenue (Million), by Country 2025 & 2033
- Figure 7: North America 3PL Industry in South Africa Revenue Share (%), by Country 2025 & 2033
- Figure 8: South America 3PL Industry in South Africa Revenue (Million), by Service 2025 & 2033
- Figure 9: South America 3PL Industry in South Africa Revenue Share (%), by Service 2025 & 2033
- Figure 10: South America 3PL Industry in South Africa Revenue (Million), by End-User 2025 & 2033
- Figure 11: South America 3PL Industry in South Africa Revenue Share (%), by End-User 2025 & 2033
- Figure 12: South America 3PL Industry in South Africa Revenue (Million), by Country 2025 & 2033
- Figure 13: South America 3PL Industry in South Africa Revenue Share (%), by Country 2025 & 2033
- Figure 14: Europe 3PL Industry in South Africa Revenue (Million), by Service 2025 & 2033
- Figure 15: Europe 3PL Industry in South Africa Revenue Share (%), by Service 2025 & 2033
- Figure 16: Europe 3PL Industry in South Africa Revenue (Million), by End-User 2025 & 2033
- Figure 17: Europe 3PL Industry in South Africa Revenue Share (%), by End-User 2025 & 2033
- Figure 18: Europe 3PL Industry in South Africa Revenue (Million), by Country 2025 & 2033
- Figure 19: Europe 3PL Industry in South Africa Revenue Share (%), by Country 2025 & 2033
- Figure 20: Middle East & Africa 3PL Industry in South Africa Revenue (Million), by Service 2025 & 2033
- Figure 21: Middle East & Africa 3PL Industry in South Africa Revenue Share (%), by Service 2025 & 2033
- Figure 22: Middle East & Africa 3PL Industry in South Africa Revenue (Million), by End-User 2025 & 2033
- Figure 23: Middle East & Africa 3PL Industry in South Africa Revenue Share (%), by End-User 2025 & 2033
- Figure 24: Middle East & Africa 3PL Industry in South Africa Revenue (Million), by Country 2025 & 2033
- Figure 25: Middle East & Africa 3PL Industry in South Africa Revenue Share (%), by Country 2025 & 2033
- Figure 26: Asia Pacific 3PL Industry in South Africa Revenue (Million), by Service 2025 & 2033
- Figure 27: Asia Pacific 3PL Industry in South Africa Revenue Share (%), by Service 2025 & 2033
- Figure 28: Asia Pacific 3PL Industry in South Africa Revenue (Million), by End-User 2025 & 2033
- Figure 29: Asia Pacific 3PL Industry in South Africa Revenue Share (%), by End-User 2025 & 2033
- Figure 30: Asia Pacific 3PL Industry in South Africa Revenue (Million), by Country 2025 & 2033
- Figure 31: Asia Pacific 3PL Industry in South Africa Revenue Share (%), by Country 2025 & 2033
List of Tables
- Table 1: Global 3PL Industry in South Africa Revenue Million Forecast, by Service 2020 & 2033
- Table 2: Global 3PL Industry in South Africa Revenue Million Forecast, by End-User 2020 & 2033
- Table 3: Global 3PL Industry in South Africa Revenue Million Forecast, by Region 2020 & 2033
- Table 4: Global 3PL Industry in South Africa Revenue Million Forecast, by Service 2020 & 2033
- Table 5: Global 3PL Industry in South Africa Revenue Million Forecast, by End-User 2020 & 2033
- Table 6: Global 3PL Industry in South Africa Revenue Million Forecast, by Country 2020 & 2033
- Table 7: United States 3PL Industry in South Africa Revenue (Million) Forecast, by Application 2020 & 2033
- Table 8: Canada 3PL Industry in South Africa Revenue (Million) Forecast, by Application 2020 & 2033
- Table 9: Mexico 3PL Industry in South Africa Revenue (Million) Forecast, by Application 2020 & 2033
- Table 10: Global 3PL Industry in South Africa Revenue Million Forecast, by Service 2020 & 2033
- Table 11: Global 3PL Industry in South Africa Revenue Million Forecast, by End-User 2020 & 2033
- Table 12: Global 3PL Industry in South Africa Revenue Million Forecast, by Country 2020 & 2033
- Table 13: Brazil 3PL Industry in South Africa Revenue (Million) Forecast, by Application 2020 & 2033
- Table 14: Argentina 3PL Industry in South Africa Revenue (Million) Forecast, by Application 2020 & 2033
- Table 15: Rest of South America 3PL Industry in South Africa Revenue (Million) Forecast, by Application 2020 & 2033
- Table 16: Global 3PL Industry in South Africa Revenue Million Forecast, by Service 2020 & 2033
- Table 17: Global 3PL Industry in South Africa Revenue Million Forecast, by End-User 2020 & 2033
- Table 18: Global 3PL Industry in South Africa Revenue Million Forecast, by Country 2020 & 2033
- Table 19: United Kingdom 3PL Industry in South Africa Revenue (Million) Forecast, by Application 2020 & 2033
- Table 20: Germany 3PL Industry in South Africa Revenue (Million) Forecast, by Application 2020 & 2033
- Table 21: France 3PL Industry in South Africa Revenue (Million) Forecast, by Application 2020 & 2033
- Table 22: Italy 3PL Industry in South Africa Revenue (Million) Forecast, by Application 2020 & 2033
- Table 23: Spain 3PL Industry in South Africa Revenue (Million) Forecast, by Application 2020 & 2033
- Table 24: Russia 3PL Industry in South Africa Revenue (Million) Forecast, by Application 2020 & 2033
- Table 25: Benelux 3PL Industry in South Africa Revenue (Million) Forecast, by Application 2020 & 2033
- Table 26: Nordics 3PL Industry in South Africa Revenue (Million) Forecast, by Application 2020 & 2033
- Table 27: Rest of Europe 3PL Industry in South Africa Revenue (Million) Forecast, by Application 2020 & 2033
- Table 28: Global 3PL Industry in South Africa Revenue Million Forecast, by Service 2020 & 2033
- Table 29: Global 3PL Industry in South Africa Revenue Million Forecast, by End-User 2020 & 2033
- Table 30: Global 3PL Industry in South Africa Revenue Million Forecast, by Country 2020 & 2033
- Table 31: Turkey 3PL Industry in South Africa Revenue (Million) Forecast, by Application 2020 & 2033
- Table 32: Israel 3PL Industry in South Africa Revenue (Million) Forecast, by Application 2020 & 2033
- Table 33: GCC 3PL Industry in South Africa Revenue (Million) Forecast, by Application 2020 & 2033
- Table 34: North Africa 3PL Industry in South Africa Revenue (Million) Forecast, by Application 2020 & 2033
- Table 35: South Africa 3PL Industry in South Africa Revenue (Million) Forecast, by Application 2020 & 2033
- Table 36: Rest of Middle East & Africa 3PL Industry in South Africa Revenue (Million) Forecast, by Application 2020 & 2033
- Table 37: Global 3PL Industry in South Africa Revenue Million Forecast, by Service 2020 & 2033
- Table 38: Global 3PL Industry in South Africa Revenue Million Forecast, by End-User 2020 & 2033
- Table 39: Global 3PL Industry in South Africa Revenue Million Forecast, by Country 2020 & 2033
- Table 40: China 3PL Industry in South Africa Revenue (Million) Forecast, by Application 2020 & 2033
- Table 41: India 3PL Industry in South Africa Revenue (Million) Forecast, by Application 2020 & 2033
- Table 42: Japan 3PL Industry in South Africa Revenue (Million) Forecast, by Application 2020 & 2033
- Table 43: South Korea 3PL Industry in South Africa Revenue (Million) Forecast, by Application 2020 & 2033
- Table 44: ASEAN 3PL Industry in South Africa Revenue (Million) Forecast, by Application 2020 & 2033
- Table 45: Oceania 3PL Industry in South Africa Revenue (Million) Forecast, by Application 2020 & 2033
- Table 46: Rest of Asia Pacific 3PL Industry in South Africa Revenue (Million) Forecast, by Application 2020 & 2033
Frequently Asked Questions
1. What is the projected Compound Annual Growth Rate (CAGR) of the 3PL Industry in South Africa?
The projected CAGR is approximately 6.64%.
2. Which companies are prominent players in the 3PL Industry in South Africa?
Key companies in the market include DB Schenker, OneLogix, DHL, United Parcel Service**List Not Exhaustive, Barloworld Logistics, Vital Distribution, CEVA Logistics, Kuehne + Nagel, Transnova, Bidvest International Logistics, Bollore Logistics, DPD Laser Express Logistics, Value Logistics, DSV, City Logistics.
3. What are the main segments of the 3PL Industry in South Africa?
The market segments include Service, End-User.
4. Can you provide details about the market size?
The market size is estimated to be USD 5.99 Million as of 2022.
5. What are some drivers contributing to market growth?
E-commerce Fueling the Growth of 3PL Market.
6. What are the notable trends driving market growth?
AfCFTA to Increase Intra Regional Trade.
7. Are there any restraints impacting market growth?
Slow Infrastructure Development.
8. Can you provide examples of recent developments in the market?
N/A
9. What pricing options are available for accessing the report?
Pricing options include single-user, multi-user, and enterprise licenses priced at USD 3800, USD 4500, and USD 5800 respectively.
10. Is the market size provided in terms of value or volume?
The market size is provided in terms of value, measured in Million.
11. Are there any specific market keywords associated with the report?
Yes, the market keyword associated with the report is "3PL Industry in South Africa," which aids in identifying and referencing the specific market segment covered.
12. How do I determine which pricing option suits my needs best?
The pricing options vary based on user requirements and access needs. Individual users may opt for single-user licenses, while businesses requiring broader access may choose multi-user or enterprise licenses for cost-effective access to the report.
13. Are there any additional resources or data provided in the 3PL Industry in South Africa report?
While the report offers comprehensive insights, it's advisable to review the specific contents or supplementary materials provided to ascertain if additional resources or data are available.
14. How can I stay updated on further developments or reports in the 3PL Industry in South Africa?
To stay informed about further developments, trends, and reports in the 3PL Industry in South Africa, consider subscribing to industry newsletters, following relevant companies and organizations, or regularly checking reputable industry news sources and publications.
Methodology
Step 1 - Identification of Relevant Samples Size from Population Database


Step 2 - Approaches for Defining Global Market Size (Value, Volume* & Price*)

Note*: In applicable scenarios
Step 3 - Data Sources
Primary Research
- Web Analytics
- Survey Reports
- Research Institute
- Latest Research Reports
- Opinion Leaders
Secondary Research
- Annual Reports
- White Paper
- Latest Press Release
- Industry Association
- Paid Database
- Investor Presentations

Step 4 - Data Triangulation
Involves using different sources of information in order to increase the validity of a study
These sources are likely to be stakeholders in a program - participants, other researchers, program staff, other community members, and so on.
Then we put all data in single framework & apply various statistical tools to find out the dynamic on the market.
During the analysis stage, feedback from the stakeholder groups would be compared to determine areas of agreement as well as areas of divergence