

Key Insights
The global Low-Calorie Food market is poised for substantial growth, projected to reach a market size of $19.2 billion in 2025. This expansion is fueled by a compelling compound annual growth rate (CAGR) of 6.2% from 2019 to 2033, indicating a sustained upward trajectory. A primary driver for this market's dynamism is the escalating global health consciousness, with consumers actively seeking alternatives to sugar and high-calorie ingredients to manage weight and prevent chronic diseases like diabetes and obesity. This demand is particularly strong in developed regions but is rapidly gaining traction in emerging economies as awareness and disposable incomes rise. Furthermore, advancements in food technology have led to the development of more palatable and diverse low-calorie ingredients, expanding the range of product offerings across various categories. The market is witnessing a significant surge in demand for natural sweeteners like Stevia, driven by consumer preference for "clean label" products. This trend is reshaping product formulations and encouraging innovation among leading food and beverage manufacturers.
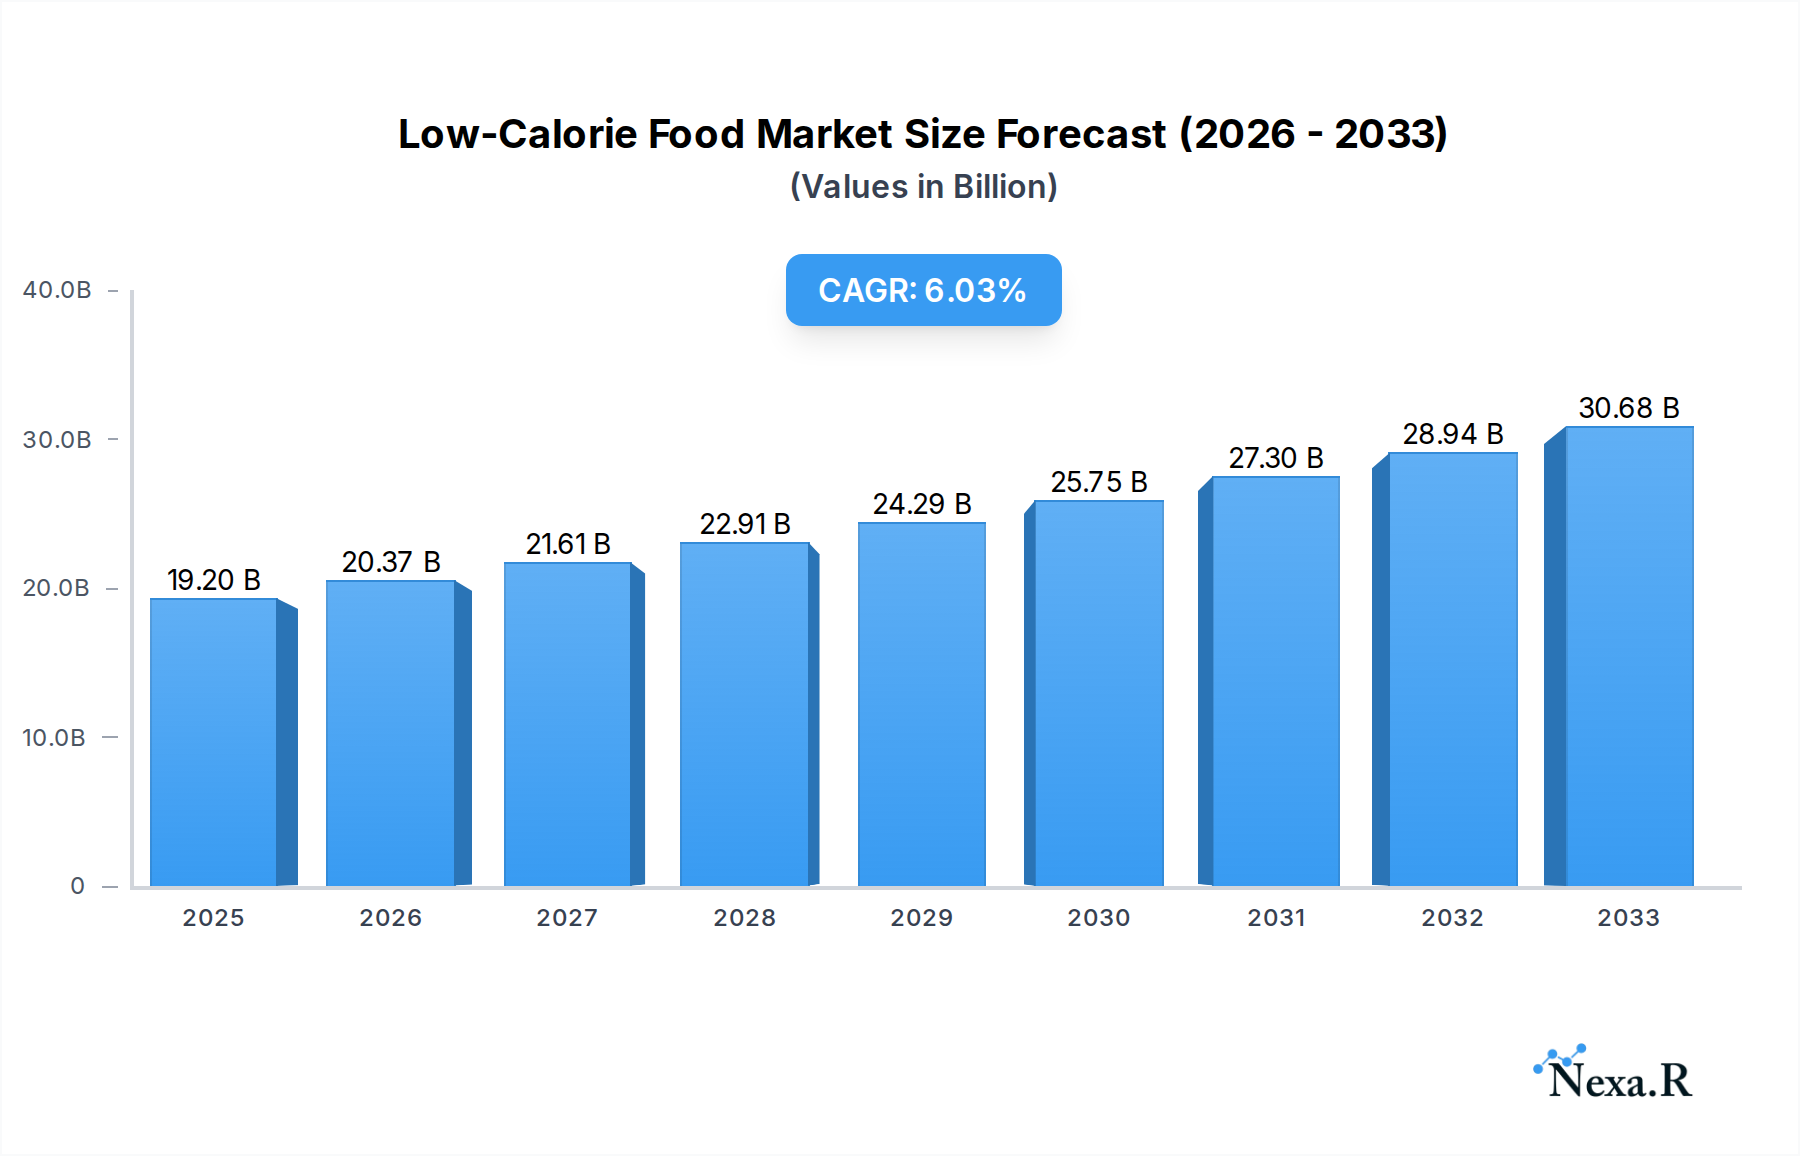
Low-Calorie Food Market Size (In Billion)
The market's growth trajectory is further supported by evolving consumer lifestyles, characterized by busier schedules and a greater emphasis on convenience and healthier eating habits. This is translating into increased consumption of low-calorie processed foods, beverages, and meal replacements. The burgeoning food and beverage industry, coupled with a robust presence of key players such as PepsiCo, Coca-Cola, Nestlé, and Cargill, actively investing in research and development for innovative low-calorie solutions, underpins this market's vitality. Strategic collaborations and product launches are expected to further accelerate market penetration. While the market is experiencing robust growth, it is not without its challenges. Regulatory scrutiny regarding the safety and labeling of artificial sweeteners, along with consumer skepticism about the taste and perceived artificiality of some low-calorie products, represent potential restraints. However, the overarching trend towards healthier living, coupled with ongoing innovation in ingredient technology and product development, strongly suggests a continued and robust expansion of the Low-Calorie Food market in the coming years.

Low-Calorie Food Company Market Share
Low-Calorie Food Report Description
This comprehensive market research report offers an in-depth analysis of the global Low-Calorie Food market, a rapidly expanding sector driven by increasing health consciousness and a growing demand for healthier food and beverage options. The report covers the study period from 2019–2033, with a base year of 2025 and an estimated year also of 2025, followed by a forecast period from 2025–2033 and a historical period from 2019–2024. We provide granular insights into market dynamics, growth trends, regional dominance, product landscape, key drivers, barriers, opportunities, and the competitive ecosystem.
This report is essential for industry professionals, including manufacturers, suppliers, ingredient providers, R&D specialists, marketers, investors, and policymakers, seeking to understand the evolving low-calorie sweetener market, sugar substitute market, and the broader healthy food market. With a focus on high-traffic keywords such as "low-calorie food," "sugar-free products," "diet foods," "artificial sweeteners," and "natural sweeteners," this report is SEO-optimized for maximum search engine visibility. We delve into the parent market of the broader food and beverage industry and the child market segments within low-calorie offerings.
The report quantifies critical data points in billion units, offering a clear financial perspective on market size, revenue projections, and investment potential. Detailed analyses of key applications in Healthcare, Food, and Beverages, alongside prominent types like Stevia, Aspartame, Cyclamate, Sucralose, and Saccharin, provide a nuanced understanding of the market's multifaceted nature.
Low-Calorie Food Market Dynamics & Structure
The Global Low-Calorie Food Market is characterized by a moderately concentrated structure, with leading players actively engaged in strategic collaborations and acquisitions to enhance their product portfolios and expand their geographical reach. Technological innovation remains a primary driver, with ongoing research and development focused on creating novel low-calorie ingredients with improved taste profiles, stability, and functionality. Regulatory frameworks play a significant role, influencing product approvals, labeling requirements, and consumer trust. Competitive product substitutes, particularly natural and naturally derived sweeteners, are increasingly challenging established artificial sweeteners. End-user demographics are shifting towards younger, health-conscious consumers and aging populations managing chronic conditions like diabetes. Mergers & Acquisitions (M&A) activity is expected to rise as companies seek to consolidate market share and acquire innovative technologies.
- Market Concentration: Dominated by a mix of large multinational corporations and specialized ingredient manufacturers.
- Technological Innovation: Focus on natural sweeteners, clean-label ingredients, and enhanced sensory experiences.
- Regulatory Frameworks: Stringent approvals for novel ingredients, evolving labeling standards.
- Competitive Product Substitutes: Rise of stevia, monk fruit, and erythritol impacting aspartame and sucralose market share.
- End-User Demographics: Growing demand from health-conscious millennials, Gen Z, and individuals with metabolic disorders.
- M&A Trends: Strategic acquisitions of innovative ingredient companies and startups focusing on plant-based sweeteners.
Low-Calorie Food Growth Trends & Insights
The low-calorie food market is experiencing robust growth, projected to reach significant valuation in the coming years. This expansion is fueled by a confluence of factors including escalating global obesity rates, a heightened awareness of health and wellness, and a widespread preference for reduced-sugar diets. The market size is evolving dynamically, with increasing adoption rates across various food and beverage categories. Technological advancements, particularly in the development of natural low-calorie sweeteners like stevia and monk fruit extracts, are disrupting traditional markets and offering consumers more palatable alternatives. Consumer behavior shifts are profound, with a notable move away from high-sugar products towards options perceived as healthier and offering weight management benefits. These shifts are reflected in the increasing penetration of sugar-free products and diet beverages across both developed and developing economies. The CAGR for the low-calorie food market is impressive, indicating sustained expansion. The demand for low-calorie ingredients in processed foods, dairy products, and baked goods is on an upward trajectory. This trend is further bolstered by evolving dietary guidelines and public health initiatives promoting reduced sugar intake. The sweetener market is witnessing a significant transition, with a growing preference for ingredients that are perceived as natural and have a clean label. The sugar substitute market is thus a key segment within this broader growth narrative. The increasing availability of innovative low-calorie formulations is making them more accessible and appealing to a wider consumer base. This market evolution is not merely about calorie reduction but also about enhancing the overall nutritional profile and taste experience of food and beverage products. The market penetration of low-calorie food products is expected to deepen as manufacturers continue to innovate and cater to diverse consumer needs and preferences.
Dominant Regions, Countries, or Segments in Low-Calorie Food
The North America region, particularly the United States, stands as a dominant force in the global low-calorie food market. This dominance is driven by a combination of factors including a high prevalence of diet-conscious consumers, a well-established food and beverage industry with a strong focus on innovation, and robust regulatory support for healthy food products. The Food segment within the application categories is a significant growth engine, encompassing a wide array of processed foods, dairy products, and bakery items that are increasingly formulated with low-calorie sweeteners. Within the Types segment, Stevia is emerging as a leading low-calorie sweetener due to its natural origin and zero-calorie profile, experiencing substantial market share gains.
- Key Drivers in North America:
- Consumer Health Awareness: High prevalence of obesity and related health concerns (diabetes, cardiovascular diseases) driving demand for healthier alternatives.
- Product Innovation & R&D: Significant investment by major food and beverage companies in developing and marketing low-calorie products.
- Retailer Support: Prominent shelf space and marketing efforts dedicated to diet and low-calorie food options.
- Government Initiatives: Public health campaigns and initiatives promoting reduced sugar intake.
- Dominance Factors in the Food Segment:
- Widespread Adoption: Low-calorie sweeteners are integrated across a vast spectrum of food categories, from snacks and desserts to sauces and ready-to-eat meals.
- Manufacturer Investment: Extensive R&D and product reformulation by food manufacturers to meet consumer demand for healthier options.
- Perceived Health Benefits: Consumers increasingly associate low-calorie food options with weight management and overall well-being.
- Growth Potential of Stevia:
- Natural Origin Appeal: Growing consumer preference for natural and plant-based ingredients over artificial alternatives.
- Versatility: Stevia's adaptability across a wide range of food and beverage applications.
- Improved Taste Profiles: Advancements in processing and formulation have addressed earlier taste challenges associated with stevia.
Low-Calorie Food Product Landscape
The low-calorie food product landscape is characterized by continuous innovation in both sweetener technology and application. Manufacturers are actively introducing new formulations of sugar-free beverages, diet snacks, and reduced-calorie dairy products. Performance metrics such as taste, stability, and cost-effectiveness are paramount in driving product adoption. Unique selling propositions often revolve around "natural," "clean label," and "no artificial ingredients." Technological advancements are enabling the development of sweeteners with enhanced sweetness intensity and cleaner taste profiles, reducing the need for masking agents.
Key Drivers, Barriers & Challenges in Low-Calorie Food
The low-calorie food market is propelled by several key drivers, including escalating global health consciousness and a rising demand for weight management solutions. Technological innovations in sweetener production, particularly natural alternatives like stevia and monk fruit, are making products more appealing. Government initiatives promoting healthier eating habits and the growing awareness of the detrimental effects of excessive sugar consumption also play a crucial role. The increasing availability of diverse low-calorie options across various food and beverage categories further fuels market expansion.
However, the market faces significant challenges and restraints. Consumer perception regarding the safety and taste of artificial sweeteners remains a barrier, despite scientific evidence supporting their use. Regulatory hurdles and varying approval processes across different countries can slow down product launches. Supply chain complexities for certain natural sweeteners and the fluctuating costs of raw materials can impact profitability. Intense competition from established sugar producers and the constant emergence of new sweetener technologies also present ongoing challenges.
Emerging Opportunities in Low-Calorie Food
Emerging opportunities in the low-calorie food industry are abundant, driven by evolving consumer preferences and unmet market needs. There is a significant untapped market for plant-based low-calorie dairy alternatives and low-sugar baked goods that cater to specific dietary requirements like keto and paleo. Innovative applications in the healthcare segment, such as specialized nutritional products for diabetic patients and bariatric surgery candidates, present a growing avenue for growth. Furthermore, the demand for naturally sweetened functional beverages with added health benefits, such as prebiotics and probiotics, is on the rise.
Growth Accelerators in the Low-Calorie Food Industry
Several catalysts are driving long-term growth in the low-calorie food industry. Technological breakthroughs in precision fermentation and advanced extraction techniques for natural sweeteners are leading to improved quality and cost-effectiveness. Strategic partnerships between ingredient suppliers and major food and beverage manufacturers are accelerating the development and adoption of new low-calorie products. Furthermore, aggressive market expansion strategies targeting emerging economies with growing middle classes and increasing health awareness are significant growth accelerators. The continuous innovation in product formulation to mimic the taste and texture of sugar without the calories is also a key driver.
Key Players Shaping the Low-Calorie Food Market
- PepsiCo
- Coca-Cola
- Groupe Danone
- Bernard Food
- Nestle
- Ajinomoto
- McNeil Nutritionals, LLC
- Cargill
- Beneo
- Abott laboratories
- Ingredion
- Galam
- Zydus Wellness
- Danisco
Notable Milestones in Low-Calorie Food Sector
- 2019: Increased regulatory scrutiny and labeling changes for artificial sweeteners in select regions.
- 2020: Growing consumer demand for natural sweeteners (stevia, monk fruit) gains significant momentum.
- 2021: Major beverage companies launch expanded portfolios of sugar-free and low-calorie drink options.
- 2022: Significant investments in R&D for next-generation low-calorie sweeteners with improved taste profiles.
- 2023: Rise in acquisitions of small and medium-sized ingredient companies by larger players.
- 2024: Introduction of innovative low-calorie applications in the bakery and confectionery sectors.
In-Depth Low-Calorie Food Market Outlook
The low-calorie food market is poised for sustained and robust growth, driven by an unwavering global consumer focus on health and wellness. Growth accelerators such as continuous advancements in natural sweetener technology, strategic collaborations between key industry players, and expansion into untapped emerging markets will shape the future trajectory. The market is expected to witness an increasing penetration of low-calorie options across diverse product categories, from beverages and snacks to dairy and baked goods. Strategic opportunities lie in catering to evolving dietary trends, developing specialized nutritional products for health-conscious segments, and leveraging clean-label ingredients to build consumer trust. The future outlook is exceptionally bright for companies that can innovate and adapt to the dynamic demands of this expanding sector.
Low-Calorie Food Segmentation
-
1. Application
- 1.1. Healthcare
- 1.2. Food
- 1.3. Beverages
-
2. Types
- 2.1. Stevia
- 2.2. Aspartame
- 2.3. Cyclamate
- 2.4. Sucralose
- 2.5. Saccharin
Low-Calorie Food Segmentation By Geography
-
1. North America
- 1.1. United States
- 1.2. Canada
- 1.3. Mexico
-
2. South America
- 2.1. Brazil
- 2.2. Argentina
- 2.3. Rest of South America
-
3. Europe
- 3.1. United Kingdom
- 3.2. Germany
- 3.3. France
- 3.4. Italy
- 3.5. Spain
- 3.6. Russia
- 3.7. Benelux
- 3.8. Nordics
- 3.9. Rest of Europe
-
4. Middle East & Africa
- 4.1. Turkey
- 4.2. Israel
- 4.3. GCC
- 4.4. North Africa
- 4.5. South Africa
- 4.6. Rest of Middle East & Africa
-
5. Asia Pacific
- 5.1. China
- 5.2. India
- 5.3. Japan
- 5.4. South Korea
- 5.5. ASEAN
- 5.6. Oceania
- 5.7. Rest of Asia Pacific
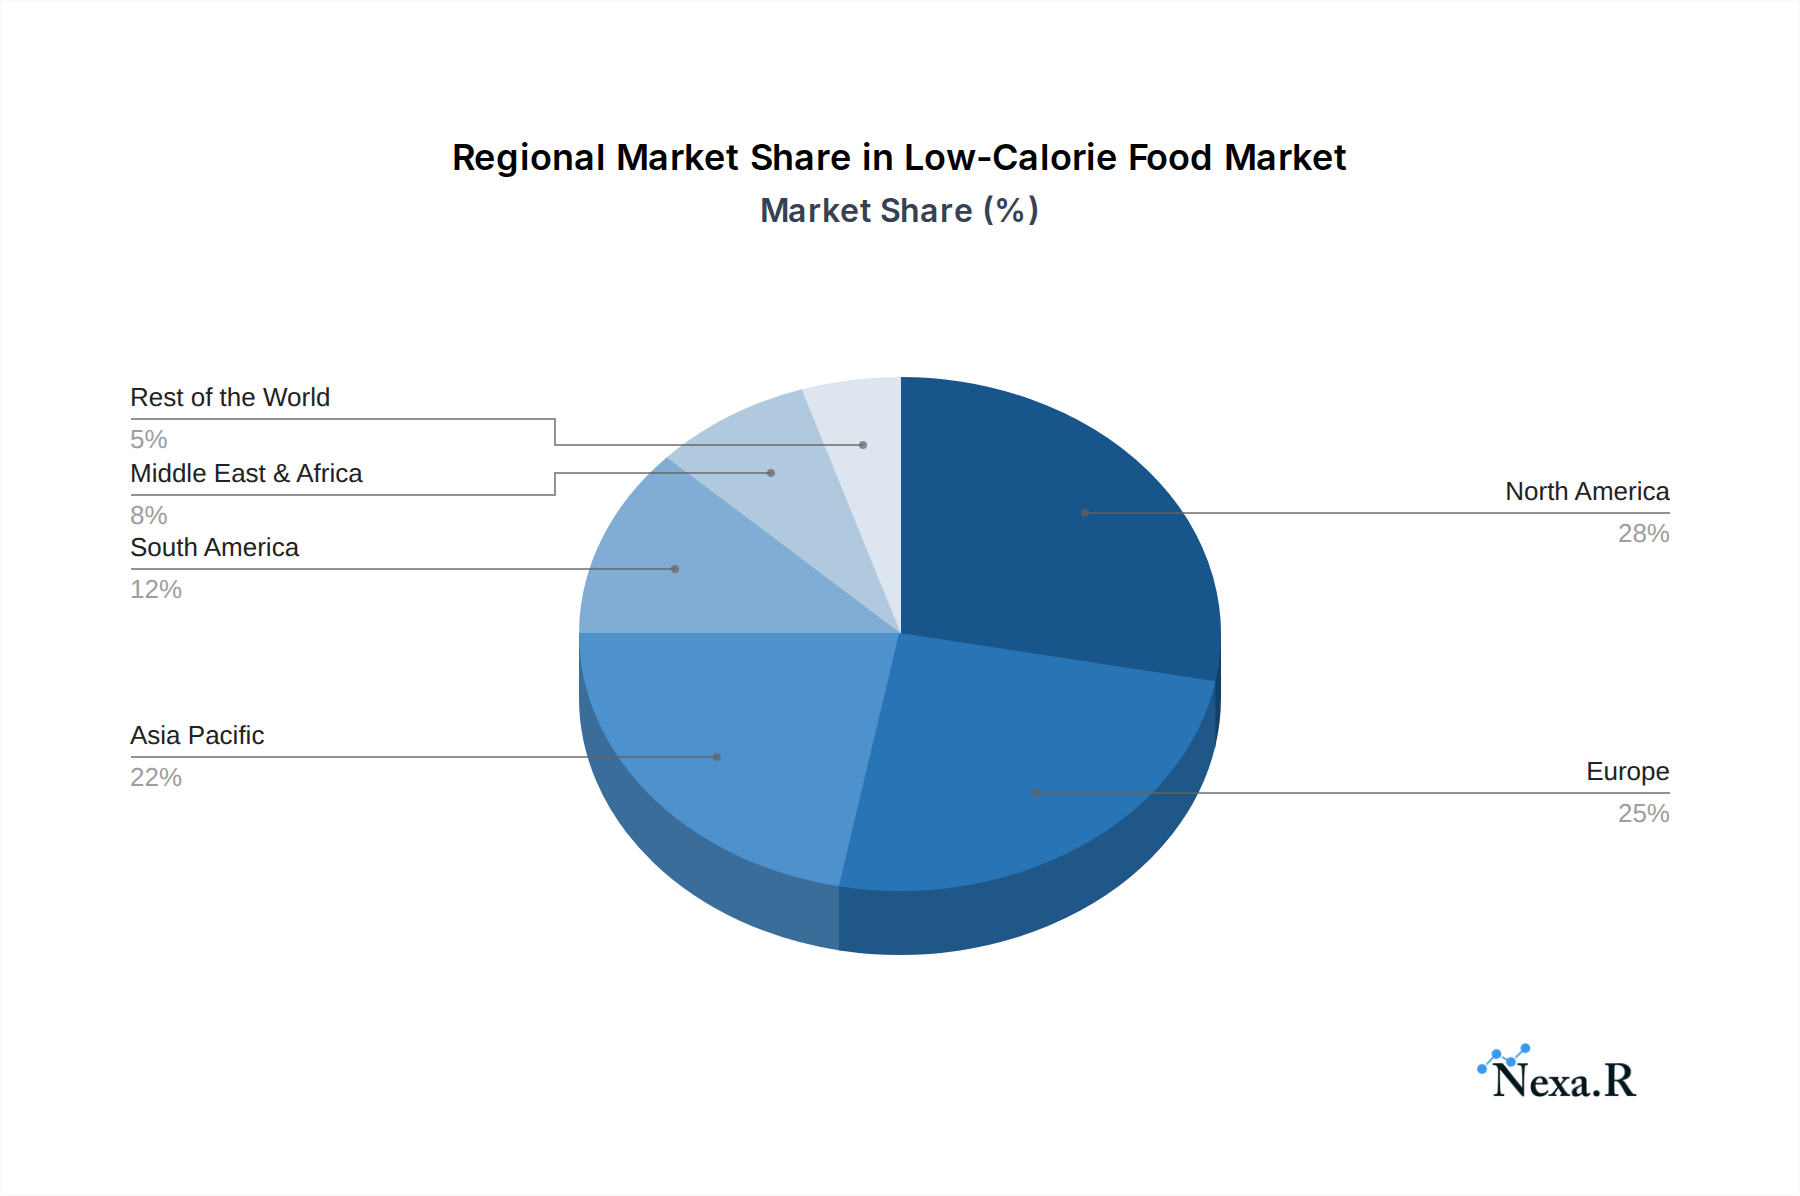
Low-Calorie Food Regional Market Share
Geographic Coverage of Low-Calorie Food
Low-Calorie Food REPORT HIGHLIGHTS
| Aspects | Details |
|---|---|
| Study Period | 2020-2034 |
| Base Year | 2025 |
| Estimated Year | 2026 |
| Forecast Period | 2026-2034 |
| Historical Period | 2020-2025 |
| Growth Rate | CAGR of 6.2% from 2020-2034 |
| Segmentation |
|
Table of Contents
- 1. Introduction
- 1.1. Research Scope
- 1.2. Market Segmentation
- 1.3. Research Methodology
- 1.4. Definitions and Assumptions
- 2. Executive Summary
- 2.1. Introduction
- 3. Market Dynamics
- 3.1. Introduction
- 3.2. Market Drivers
- 3.3. Market Restrains
- 3.4. Market Trends
- 4. Market Factor Analysis
- 4.1. Porters Five Forces
- 4.2. Supply/Value Chain
- 4.3. PESTEL analysis
- 4.4. Market Entropy
- 4.5. Patent/Trademark Analysis
- 5. Global Low-Calorie Food Analysis, Insights and Forecast, 2020-2032
- 5.1. Market Analysis, Insights and Forecast - by Application
- 5.1.1. Healthcare
- 5.1.2. Food
- 5.1.3. Beverages
- 5.2. Market Analysis, Insights and Forecast - by Types
- 5.2.1. Stevia
- 5.2.2. Aspartame
- 5.2.3. Cyclamate
- 5.2.4. Sucralose
- 5.2.5. Saccharin
- 5.3. Market Analysis, Insights and Forecast - by Region
- 5.3.1. North America
- 5.3.2. South America
- 5.3.3. Europe
- 5.3.4. Middle East & Africa
- 5.3.5. Asia Pacific
- 5.1. Market Analysis, Insights and Forecast - by Application
- 6. North America Low-Calorie Food Analysis, Insights and Forecast, 2020-2032
- 6.1. Market Analysis, Insights and Forecast - by Application
- 6.1.1. Healthcare
- 6.1.2. Food
- 6.1.3. Beverages
- 6.2. Market Analysis, Insights and Forecast - by Types
- 6.2.1. Stevia
- 6.2.2. Aspartame
- 6.2.3. Cyclamate
- 6.2.4. Sucralose
- 6.2.5. Saccharin
- 6.1. Market Analysis, Insights and Forecast - by Application
- 7. South America Low-Calorie Food Analysis, Insights and Forecast, 2020-2032
- 7.1. Market Analysis, Insights and Forecast - by Application
- 7.1.1. Healthcare
- 7.1.2. Food
- 7.1.3. Beverages
- 7.2. Market Analysis, Insights and Forecast - by Types
- 7.2.1. Stevia
- 7.2.2. Aspartame
- 7.2.3. Cyclamate
- 7.2.4. Sucralose
- 7.2.5. Saccharin
- 7.1. Market Analysis, Insights and Forecast - by Application
- 8. Europe Low-Calorie Food Analysis, Insights and Forecast, 2020-2032
- 8.1. Market Analysis, Insights and Forecast - by Application
- 8.1.1. Healthcare
- 8.1.2. Food
- 8.1.3. Beverages
- 8.2. Market Analysis, Insights and Forecast - by Types
- 8.2.1. Stevia
- 8.2.2. Aspartame
- 8.2.3. Cyclamate
- 8.2.4. Sucralose
- 8.2.5. Saccharin
- 8.1. Market Analysis, Insights and Forecast - by Application
- 9. Middle East & Africa Low-Calorie Food Analysis, Insights and Forecast, 2020-2032
- 9.1. Market Analysis, Insights and Forecast - by Application
- 9.1.1. Healthcare
- 9.1.2. Food
- 9.1.3. Beverages
- 9.2. Market Analysis, Insights and Forecast - by Types
- 9.2.1. Stevia
- 9.2.2. Aspartame
- 9.2.3. Cyclamate
- 9.2.4. Sucralose
- 9.2.5. Saccharin
- 9.1. Market Analysis, Insights and Forecast - by Application
- 10. Asia Pacific Low-Calorie Food Analysis, Insights and Forecast, 2020-2032
- 10.1. Market Analysis, Insights and Forecast - by Application
- 10.1.1. Healthcare
- 10.1.2. Food
- 10.1.3. Beverages
- 10.2. Market Analysis, Insights and Forecast - by Types
- 10.2.1. Stevia
- 10.2.2. Aspartame
- 10.2.3. Cyclamate
- 10.2.4. Sucralose
- 10.2.5. Saccharin
- 10.1. Market Analysis, Insights and Forecast - by Application
- 11. Competitive Analysis
- 11.1. Global Market Share Analysis 2025
- 11.2. Company Profiles
- 11.2.1 PepsiCo
- 11.2.1.1. Overview
- 11.2.1.2. Products
- 11.2.1.3. SWOT Analysis
- 11.2.1.4. Recent Developments
- 11.2.1.5. Financials (Based on Availability)
- 11.2.2 Coca-Cola
- 11.2.2.1. Overview
- 11.2.2.2. Products
- 11.2.2.3. SWOT Analysis
- 11.2.2.4. Recent Developments
- 11.2.2.5. Financials (Based on Availability)
- 11.2.3 Groupe Danone
- 11.2.3.1. Overview
- 11.2.3.2. Products
- 11.2.3.3. SWOT Analysis
- 11.2.3.4. Recent Developments
- 11.2.3.5. Financials (Based on Availability)
- 11.2.4 Bernard Food
- 11.2.4.1. Overview
- 11.2.4.2. Products
- 11.2.4.3. SWOT Analysis
- 11.2.4.4. Recent Developments
- 11.2.4.5. Financials (Based on Availability)
- 11.2.5 Nestle
- 11.2.5.1. Overview
- 11.2.5.2. Products
- 11.2.5.3. SWOT Analysis
- 11.2.5.4. Recent Developments
- 11.2.5.5. Financials (Based on Availability)
- 11.2.6 Ajinomoto
- 11.2.6.1. Overview
- 11.2.6.2. Products
- 11.2.6.3. SWOT Analysis
- 11.2.6.4. Recent Developments
- 11.2.6.5. Financials (Based on Availability)
- 11.2.7 McNeil Nutritionals
- 11.2.7.1. Overview
- 11.2.7.2. Products
- 11.2.7.3. SWOT Analysis
- 11.2.7.4. Recent Developments
- 11.2.7.5. Financials (Based on Availability)
- 11.2.8 LLC and Cargill
- 11.2.8.1. Overview
- 11.2.8.2. Products
- 11.2.8.3. SWOT Analysis
- 11.2.8.4. Recent Developments
- 11.2.8.5. Financials (Based on Availability)
- 11.2.9 Beneo
- 11.2.9.1. Overview
- 11.2.9.2. Products
- 11.2.9.3. SWOT Analysis
- 11.2.9.4. Recent Developments
- 11.2.9.5. Financials (Based on Availability)
- 11.2.10 Abott laboratories
- 11.2.10.1. Overview
- 11.2.10.2. Products
- 11.2.10.3. SWOT Analysis
- 11.2.10.4. Recent Developments
- 11.2.10.5. Financials (Based on Availability)
- 11.2.11 Ingredion
- 11.2.11.1. Overview
- 11.2.11.2. Products
- 11.2.11.3. SWOT Analysis
- 11.2.11.4. Recent Developments
- 11.2.11.5. Financials (Based on Availability)
- 11.2.12 Galam
- 11.2.12.1. Overview
- 11.2.12.2. Products
- 11.2.12.3. SWOT Analysis
- 11.2.12.4. Recent Developments
- 11.2.12.5. Financials (Based on Availability)
- 11.2.13 Zydus Wellness
- 11.2.13.1. Overview
- 11.2.13.2. Products
- 11.2.13.3. SWOT Analysis
- 11.2.13.4. Recent Developments
- 11.2.13.5. Financials (Based on Availability)
- 11.2.14 Danisco
- 11.2.14.1. Overview
- 11.2.14.2. Products
- 11.2.14.3. SWOT Analysis
- 11.2.14.4. Recent Developments
- 11.2.14.5. Financials (Based on Availability)
- 11.2.1 PepsiCo
List of Figures
- Figure 1: Global Low-Calorie Food Revenue Breakdown (undefined, %) by Region 2025 & 2033
- Figure 2: North America Low-Calorie Food Revenue (undefined), by Application 2025 & 2033
- Figure 3: North America Low-Calorie Food Revenue Share (%), by Application 2025 & 2033
- Figure 4: North America Low-Calorie Food Revenue (undefined), by Types 2025 & 2033
- Figure 5: North America Low-Calorie Food Revenue Share (%), by Types 2025 & 2033
- Figure 6: North America Low-Calorie Food Revenue (undefined), by Country 2025 & 2033
- Figure 7: North America Low-Calorie Food Revenue Share (%), by Country 2025 & 2033
- Figure 8: South America Low-Calorie Food Revenue (undefined), by Application 2025 & 2033
- Figure 9: South America Low-Calorie Food Revenue Share (%), by Application 2025 & 2033
- Figure 10: South America Low-Calorie Food Revenue (undefined), by Types 2025 & 2033
- Figure 11: South America Low-Calorie Food Revenue Share (%), by Types 2025 & 2033
- Figure 12: South America Low-Calorie Food Revenue (undefined), by Country 2025 & 2033
- Figure 13: South America Low-Calorie Food Revenue Share (%), by Country 2025 & 2033
- Figure 14: Europe Low-Calorie Food Revenue (undefined), by Application 2025 & 2033
- Figure 15: Europe Low-Calorie Food Revenue Share (%), by Application 2025 & 2033
- Figure 16: Europe Low-Calorie Food Revenue (undefined), by Types 2025 & 2033
- Figure 17: Europe Low-Calorie Food Revenue Share (%), by Types 2025 & 2033
- Figure 18: Europe Low-Calorie Food Revenue (undefined), by Country 2025 & 2033
- Figure 19: Europe Low-Calorie Food Revenue Share (%), by Country 2025 & 2033
- Figure 20: Middle East & Africa Low-Calorie Food Revenue (undefined), by Application 2025 & 2033
- Figure 21: Middle East & Africa Low-Calorie Food Revenue Share (%), by Application 2025 & 2033
- Figure 22: Middle East & Africa Low-Calorie Food Revenue (undefined), by Types 2025 & 2033
- Figure 23: Middle East & Africa Low-Calorie Food Revenue Share (%), by Types 2025 & 2033
- Figure 24: Middle East & Africa Low-Calorie Food Revenue (undefined), by Country 2025 & 2033
- Figure 25: Middle East & Africa Low-Calorie Food Revenue Share (%), by Country 2025 & 2033
- Figure 26: Asia Pacific Low-Calorie Food Revenue (undefined), by Application 2025 & 2033
- Figure 27: Asia Pacific Low-Calorie Food Revenue Share (%), by Application 2025 & 2033
- Figure 28: Asia Pacific Low-Calorie Food Revenue (undefined), by Types 2025 & 2033
- Figure 29: Asia Pacific Low-Calorie Food Revenue Share (%), by Types 2025 & 2033
- Figure 30: Asia Pacific Low-Calorie Food Revenue (undefined), by Country 2025 & 2033
- Figure 31: Asia Pacific Low-Calorie Food Revenue Share (%), by Country 2025 & 2033
List of Tables
- Table 1: Global Low-Calorie Food Revenue undefined Forecast, by Application 2020 & 2033
- Table 2: Global Low-Calorie Food Revenue undefined Forecast, by Types 2020 & 2033
- Table 3: Global Low-Calorie Food Revenue undefined Forecast, by Region 2020 & 2033
- Table 4: Global Low-Calorie Food Revenue undefined Forecast, by Application 2020 & 2033
- Table 5: Global Low-Calorie Food Revenue undefined Forecast, by Types 2020 & 2033
- Table 6: Global Low-Calorie Food Revenue undefined Forecast, by Country 2020 & 2033
- Table 7: United States Low-Calorie Food Revenue (undefined) Forecast, by Application 2020 & 2033
- Table 8: Canada Low-Calorie Food Revenue (undefined) Forecast, by Application 2020 & 2033
- Table 9: Mexico Low-Calorie Food Revenue (undefined) Forecast, by Application 2020 & 2033
- Table 10: Global Low-Calorie Food Revenue undefined Forecast, by Application 2020 & 2033
- Table 11: Global Low-Calorie Food Revenue undefined Forecast, by Types 2020 & 2033
- Table 12: Global Low-Calorie Food Revenue undefined Forecast, by Country 2020 & 2033
- Table 13: Brazil Low-Calorie Food Revenue (undefined) Forecast, by Application 2020 & 2033
- Table 14: Argentina Low-Calorie Food Revenue (undefined) Forecast, by Application 2020 & 2033
- Table 15: Rest of South America Low-Calorie Food Revenue (undefined) Forecast, by Application 2020 & 2033
- Table 16: Global Low-Calorie Food Revenue undefined Forecast, by Application 2020 & 2033
- Table 17: Global Low-Calorie Food Revenue undefined Forecast, by Types 2020 & 2033
- Table 18: Global Low-Calorie Food Revenue undefined Forecast, by Country 2020 & 2033
- Table 19: United Kingdom Low-Calorie Food Revenue (undefined) Forecast, by Application 2020 & 2033
- Table 20: Germany Low-Calorie Food Revenue (undefined) Forecast, by Application 2020 & 2033
- Table 21: France Low-Calorie Food Revenue (undefined) Forecast, by Application 2020 & 2033
- Table 22: Italy Low-Calorie Food Revenue (undefined) Forecast, by Application 2020 & 2033
- Table 23: Spain Low-Calorie Food Revenue (undefined) Forecast, by Application 2020 & 2033
- Table 24: Russia Low-Calorie Food Revenue (undefined) Forecast, by Application 2020 & 2033
- Table 25: Benelux Low-Calorie Food Revenue (undefined) Forecast, by Application 2020 & 2033
- Table 26: Nordics Low-Calorie Food Revenue (undefined) Forecast, by Application 2020 & 2033
- Table 27: Rest of Europe Low-Calorie Food Revenue (undefined) Forecast, by Application 2020 & 2033
- Table 28: Global Low-Calorie Food Revenue undefined Forecast, by Application 2020 & 2033
- Table 29: Global Low-Calorie Food Revenue undefined Forecast, by Types 2020 & 2033
- Table 30: Global Low-Calorie Food Revenue undefined Forecast, by Country 2020 & 2033
- Table 31: Turkey Low-Calorie Food Revenue (undefined) Forecast, by Application 2020 & 2033
- Table 32: Israel Low-Calorie Food Revenue (undefined) Forecast, by Application 2020 & 2033
- Table 33: GCC Low-Calorie Food Revenue (undefined) Forecast, by Application 2020 & 2033
- Table 34: North Africa Low-Calorie Food Revenue (undefined) Forecast, by Application 2020 & 2033
- Table 35: South Africa Low-Calorie Food Revenue (undefined) Forecast, by Application 2020 & 2033
- Table 36: Rest of Middle East & Africa Low-Calorie Food Revenue (undefined) Forecast, by Application 2020 & 2033
- Table 37: Global Low-Calorie Food Revenue undefined Forecast, by Application 2020 & 2033
- Table 38: Global Low-Calorie Food Revenue undefined Forecast, by Types 2020 & 2033
- Table 39: Global Low-Calorie Food Revenue undefined Forecast, by Country 2020 & 2033
- Table 40: China Low-Calorie Food Revenue (undefined) Forecast, by Application 2020 & 2033
- Table 41: India Low-Calorie Food Revenue (undefined) Forecast, by Application 2020 & 2033
- Table 42: Japan Low-Calorie Food Revenue (undefined) Forecast, by Application 2020 & 2033
- Table 43: South Korea Low-Calorie Food Revenue (undefined) Forecast, by Application 2020 & 2033
- Table 44: ASEAN Low-Calorie Food Revenue (undefined) Forecast, by Application 2020 & 2033
- Table 45: Oceania Low-Calorie Food Revenue (undefined) Forecast, by Application 2020 & 2033
- Table 46: Rest of Asia Pacific Low-Calorie Food Revenue (undefined) Forecast, by Application 2020 & 2033
Frequently Asked Questions
1. What is the projected Compound Annual Growth Rate (CAGR) of the Low-Calorie Food?
The projected CAGR is approximately 6.2%.
2. Which companies are prominent players in the Low-Calorie Food?
Key companies in the market include PepsiCo, Coca-Cola, Groupe Danone, Bernard Food, Nestle, Ajinomoto, McNeil Nutritionals, LLC and Cargill, Beneo, Abott laboratories, Ingredion, Galam, Zydus Wellness, Danisco.
3. What are the main segments of the Low-Calorie Food?
The market segments include Application, Types.
4. Can you provide details about the market size?
The market size is estimated to be USD XXX N/A as of 2022.
5. What are some drivers contributing to market growth?
N/A
6. What are the notable trends driving market growth?
N/A
7. Are there any restraints impacting market growth?
N/A
8. Can you provide examples of recent developments in the market?
N/A
9. What pricing options are available for accessing the report?
Pricing options include single-user, multi-user, and enterprise licenses priced at USD 4900.00, USD 7350.00, and USD 9800.00 respectively.
10. Is the market size provided in terms of value or volume?
The market size is provided in terms of value, measured in N/A.
11. Are there any specific market keywords associated with the report?
Yes, the market keyword associated with the report is "Low-Calorie Food," which aids in identifying and referencing the specific market segment covered.
12. How do I determine which pricing option suits my needs best?
The pricing options vary based on user requirements and access needs. Individual users may opt for single-user licenses, while businesses requiring broader access may choose multi-user or enterprise licenses for cost-effective access to the report.
13. Are there any additional resources or data provided in the Low-Calorie Food report?
While the report offers comprehensive insights, it's advisable to review the specific contents or supplementary materials provided to ascertain if additional resources or data are available.
14. How can I stay updated on further developments or reports in the Low-Calorie Food?
To stay informed about further developments, trends, and reports in the Low-Calorie Food, consider subscribing to industry newsletters, following relevant companies and organizations, or regularly checking reputable industry news sources and publications.
Methodology
Step 1 - Identification of Relevant Samples Size from Population Database


Step 2 - Approaches for Defining Global Market Size (Value, Volume* & Price*)

Note*: In applicable scenarios
Step 3 - Data Sources
Primary Research
- Web Analytics
- Survey Reports
- Research Institute
- Latest Research Reports
- Opinion Leaders
Secondary Research
- Annual Reports
- White Paper
- Latest Press Release
- Industry Association
- Paid Database
- Investor Presentations

Step 4 - Data Triangulation
Involves using different sources of information in order to increase the validity of a study
These sources are likely to be stakeholders in a program - participants, other researchers, program staff, other community members, and so on.
Then we put all data in single framework & apply various statistical tools to find out the dynamic on the market.
During the analysis stage, feedback from the stakeholder groups would be compared to determine areas of agreement as well as areas of divergence