

Key Insights
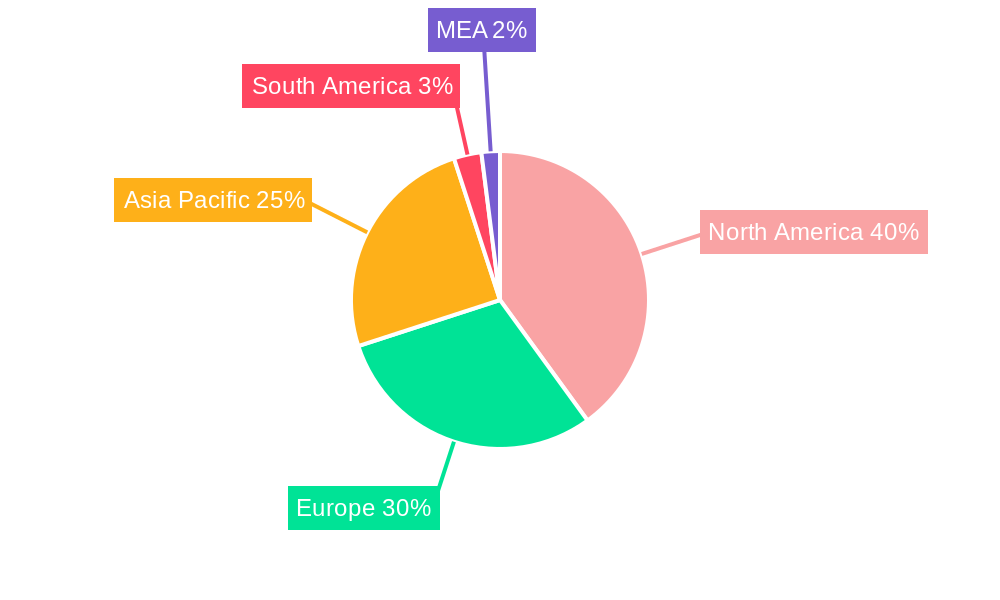
The nanorobotics market is experiencing robust growth, projected to reach a substantial size driven by advancements in nanotechnology, biotechnology, and artificial intelligence. The market's Compound Annual Growth Rate (CAGR) of 10% from 2019 to 2033 indicates significant expansion, fueled primarily by the increasing demand for minimally invasive medical procedures, efficient drug delivery systems, and advanced diagnostic tools. Key applications such as medical imaging, drug delivery, and health sensors are spearheading this growth. Biochips, representing a significant segment within nanorobotics manufacturing, are experiencing high demand due to their diverse applications in diagnostics and therapeutics. The development of sophisticated nanobots, including bacteria-based varieties, promises to revolutionize targeted drug delivery, paving the way for personalized medicine and more effective treatments. 3D printing technologies are also playing a crucial role, enabling the cost-effective and precise manufacturing of complex nanorobotic structures. While regulatory hurdles and high research and development costs pose challenges, ongoing investments and collaborative efforts across academia and industry are driving innovation and market expansion. The North American market currently holds a leading position, owing to strong research infrastructure and substantial funding for nanotechnology initiatives. However, the Asia-Pacific region is anticipated to witness significant growth in the coming years, driven by increasing healthcare spending and a burgeoning technological landscape.
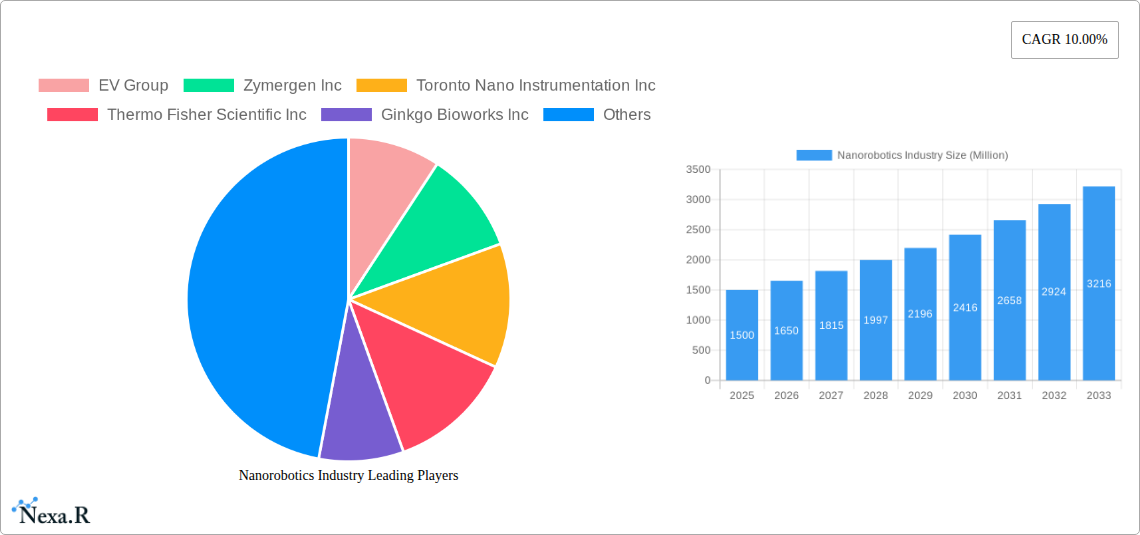
The competitive landscape is characterized by a mix of established players and emerging startups. Companies like EV Group, Zymergen Inc., and Thermo Fisher Scientific Inc., are key contributors to the industry, focusing on different aspects of the nanorobotics value chain, from manufacturing to application development. The continued influx of investment and technological breakthroughs in areas such as artificial intelligence for control systems and biocompatibility materials are further accelerating the growth trajectory. While challenges remain in terms of scalability, cost reduction, and biocompatibility issues, the long-term prospects for the nanorobotics market remain exceptionally positive, with applications expected to extend beyond healthcare to fields such as environmental remediation and advanced materials science. The continued integration of nanorobotics with other emerging technologies, such as the Internet of Medical Things (IoMT), will only amplify its impact across various sectors in the coming years.
Nanorobotics Industry Market Report: 2019-2033
This comprehensive report provides an in-depth analysis of the Nanorobotics industry, encompassing market dynamics, growth trends, regional dominance, product landscapes, and future outlook. The study period covers 2019-2033, with a base year of 2025 and a forecast period of 2025-2033. This report is crucial for industry professionals, investors, and researchers seeking to understand and capitalize on the opportunities within this rapidly evolving sector. The report also details parent market (nanotechnology) and child markets (Biochips, Nubots, etc.) contributing to market growth and penetration. The total market size in 2025 is estimated to be xx Million.
Nanorobotics Industry Market Dynamics & Structure
The nanorobotics market is characterized by high fragmentation with several players competing for market share. Technological innovation, particularly in areas like advanced materials and microfabrication, is a key driver of growth. Stringent regulatory frameworks related to safety and efficacy, particularly within the medical applications segment, present both opportunities and challenges. Competitive product substitutes, such as traditional microsurgery tools, pose a significant challenge to market penetration. End-user demographics, primarily focusing on healthcare and research institutions, are constantly expanding as awareness and acceptance of nanorobotics technology increases. M&A activity in the sector has been relatively modest, with xx deals recorded in the historical period (2019-2024), indicating potential for future consolidation.
- Market Concentration: Moderately fragmented, with no single dominant player.
- Technological Innovation: Rapid advancements in materials science, microfluidics, and AI are driving innovation.
- Regulatory Landscape: Stringent regulations, particularly in medical applications, impact market growth.
- Competitive Substitutes: Traditional methods pose a challenge to nanorobotics adoption.
- End-User Demographics: Primarily healthcare and research institutions.
- M&A Activity: xx deals during 2019-2024, with potential for increased activity.
Nanorobotics Industry Growth Trends & Insights
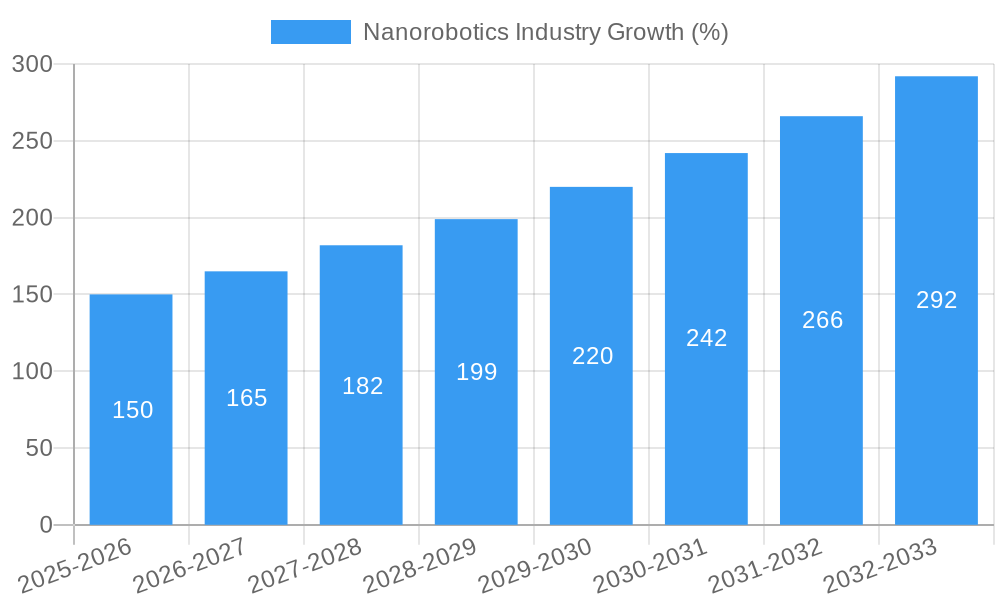
The nanorobotics market is experiencing robust growth, driven by increasing demand across various applications. The market size, valued at xx Million in 2025, is projected to reach xx Million by 2033, exhibiting a CAGR of xx% during the forecast period (2025-2033). This growth is fueled by technological disruptions leading to improved efficiency and efficacy of nanorobotic systems, alongside a shift in consumer behavior towards minimally invasive medical procedures and advanced diagnostic tools. Adoption rates are increasing steadily, particularly in developed economies, due to greater awareness and investment in R&D.
Dominant Regions, Countries, or Segments in Nanorobotics Industry
North America currently holds the largest market share in the nanorobotics industry, driven by substantial investments in R&D and the presence of key players. However, the Asia-Pacific region is poised for rapid growth due to increasing healthcare expenditure and government initiatives supporting technological advancements. Within the application segments, Medical Imaging and Drug Delivery are the most dominant, accounting for xx% and xx% of the market, respectively. Among manufacturing types, 3D printing is gaining traction due to its ability to create complex nanostructures.
- Key Regional Drivers: Strong R&D investments in North America; Government initiatives and healthcare spending in Asia-Pacific.
- Dominant Application: Medical Imaging and Drug Delivery, with xx% and xx% market share respectively.
- Leading Manufacturing Type: 3D printing is gaining momentum due to its ability to create intricate structures.
Nanorobotics Industry Product Landscape
The nanorobotics product landscape is characterized by diverse product offerings, ranging from biochips and nanobots for drug delivery to sophisticated imaging systems. Innovations focus on enhancing precision, biocompatibility, and control mechanisms. Unique selling propositions include minimally invasive procedures, improved diagnostics, and targeted therapies, driving market demand. Technological advancements are constantly evolving, incorporating advanced materials, AI algorithms, and improved microfabrication techniques.
Key Drivers, Barriers & Challenges in Nanorobotics Industry
Key Drivers:
- Growing demand for minimally invasive medical procedures.
- Increasing investments in nanotechnology research and development.
- Advancements in microfabrication and materials science.
- Favorable government regulations and policies in some regions.
Challenges and Restraints:
- High manufacturing costs and complexity.
- Concerns about safety and toxicity of nanomaterials.
- Regulatory hurdles and lengthy approval processes for medical applications.
- Limited scalability and production capacity. This results in an estimated xx Million shortfall in meeting projected demand by 2030.
Emerging Opportunities in Nanorobotics Industry
Significant opportunities exist in exploring novel applications of nanorobotics in areas like environmental remediation, targeted cancer therapies, and advanced diagnostics. Untapped markets in developing countries present considerable growth potential, particularly in areas where access to advanced healthcare is limited. The increasing integration of AI and machine learning in nanorobotics offers opportunities for enhanced control, precision, and automation.
Growth Accelerators in the Nanorobotics Industry
Long-term growth will be fueled by continuous technological breakthroughs, particularly in areas like biocompatible materials and advanced control systems. Strategic partnerships between research institutions, pharmaceutical companies, and technology providers will be crucial in accelerating innovation and market adoption. Market expansion strategies focusing on emerging economies and diversifying applications will further propel growth.
Key Players Shaping the Nanorobotics Industry Market
- EV Group
- Zymergen Inc
- Toronto Nano Instrumentation Inc
- Thermo Fisher Scientific Inc
- Ginkgo Bioworks Inc
- Oxford Instruments
- Imina Technologies SA
- Synthace Limited
- Illumina Inc
- Nanoics Imaging Limited
Notable Milestones in Nanorobotics Industry Sector
- 2020: Successful demonstration of targeted drug delivery using bacteria-based nanobots.
- 2022: Launch of a new generation of high-resolution nanorobotic imaging systems.
- 2023: Major pharmaceutical company announces strategic partnership with a nanorobotics firm for cancer therapy development.
In-Depth Nanorobotics Industry Market Outlook
The nanorobotics market is poised for significant expansion driven by continuous innovation and rising demand across diverse sectors. Strategic partnerships and focused R&D efforts in areas like biocompatibility and scalability will unlock new opportunities. The future holds immense potential for nanorobotics to revolutionize healthcare, manufacturing, and environmental sustainability.
Nanorobotics Industry Segmentation
-
1. Type of Manufacuturing
- 1.1. Biochips
- 1.2. Nubots
- 1.3. Bacteria-based Nanobots
- 1.4. 3D Printing
- 1.5. Other Types
-
2. Application
- 2.1. Medical Imaging
- 2.2. Information Storage
- 2.3. Drug Delivery
- 2.4. Health Sensors and Replicators
- 2.5. Other Applications
Nanorobotics Industry Segmentation By Geography
-
1. North America
- 1.1. Unites States
- 1.2. Canada
-
2. Europe
- 2.1. Germany
- 2.2. United Kingdom
- 2.3. France
- 2.4. Rest of Europe
-
3. Asia Pacific
- 3.1. India
- 3.2. China
- 3.3. Japan
- 3.4. Rest of Asia Pacific
-
4. Rest of the World
- 4.1. Latin America
- 4.2. Middle East and Africa
Nanorobotics Industry REPORT HIGHLIGHTS
| Aspects | Details |
|---|---|
| Study Period | 2019-2033 |
| Base Year | 2024 |
| Estimated Year | 2025 |
| Forecast Period | 2025-2033 |
| Historical Period | 2019-2024 |
| Growth Rate | CAGR of 10.00% from 2019-2033 |
| Segmentation |
|
Table of Contents
- 1. Introduction
- 1.1. Research Scope
- 1.2. Market Segmentation
- 1.3. Research Methodology
- 1.4. Definitions and Assumptions
- 2. Executive Summary
- 2.1. Introduction
- 3. Market Dynamics
- 3.1. Introduction
- 3.2. Market Drivers
- 3.2.1. ; Increasing Investment in Technology by Governments and Universities; Growing Demand for Advanced Medical Treatments
- 3.3. Market Restrains
- 3.3.1. ; High Manufacturing and Development Costs
- 3.4. Market Trends
- 3.4.1. Drug Delivery Application is Expected to Witness Significant Growth Rate
- 4. Market Factor Analysis
- 4.1. Porters Five Forces
- 4.2. Supply/Value Chain
- 4.3. PESTEL analysis
- 4.4. Market Entropy
- 4.5. Patent/Trademark Analysis
- 5. Global Nanorobotics Industry Analysis, Insights and Forecast, 2019-2031
- 5.1. Market Analysis, Insights and Forecast - by Type of Manufacuturing
- 5.1.1. Biochips
- 5.1.2. Nubots
- 5.1.3. Bacteria-based Nanobots
- 5.1.4. 3D Printing
- 5.1.5. Other Types
- 5.2. Market Analysis, Insights and Forecast - by Application
- 5.2.1. Medical Imaging
- 5.2.2. Information Storage
- 5.2.3. Drug Delivery
- 5.2.4. Health Sensors and Replicators
- 5.2.5. Other Applications
- 5.3. Market Analysis, Insights and Forecast - by Region
- 5.3.1. North America
- 5.3.2. Europe
- 5.3.3. Asia Pacific
- 5.3.4. Rest of the World
- 5.1. Market Analysis, Insights and Forecast - by Type of Manufacuturing
- 6. North America Nanorobotics Industry Analysis, Insights and Forecast, 2019-2031
- 6.1. Market Analysis, Insights and Forecast - by Type of Manufacuturing
- 6.1.1. Biochips
- 6.1.2. Nubots
- 6.1.3. Bacteria-based Nanobots
- 6.1.4. 3D Printing
- 6.1.5. Other Types
- 6.2. Market Analysis, Insights and Forecast - by Application
- 6.2.1. Medical Imaging
- 6.2.2. Information Storage
- 6.2.3. Drug Delivery
- 6.2.4. Health Sensors and Replicators
- 6.2.5. Other Applications
- 6.1. Market Analysis, Insights and Forecast - by Type of Manufacuturing
- 7. Europe Nanorobotics Industry Analysis, Insights and Forecast, 2019-2031
- 7.1. Market Analysis, Insights and Forecast - by Type of Manufacuturing
- 7.1.1. Biochips
- 7.1.2. Nubots
- 7.1.3. Bacteria-based Nanobots
- 7.1.4. 3D Printing
- 7.1.5. Other Types
- 7.2. Market Analysis, Insights and Forecast - by Application
- 7.2.1. Medical Imaging
- 7.2.2. Information Storage
- 7.2.3. Drug Delivery
- 7.2.4. Health Sensors and Replicators
- 7.2.5. Other Applications
- 7.1. Market Analysis, Insights and Forecast - by Type of Manufacuturing
- 8. Asia Pacific Nanorobotics Industry Analysis, Insights and Forecast, 2019-2031
- 8.1. Market Analysis, Insights and Forecast - by Type of Manufacuturing
- 8.1.1. Biochips
- 8.1.2. Nubots
- 8.1.3. Bacteria-based Nanobots
- 8.1.4. 3D Printing
- 8.1.5. Other Types
- 8.2. Market Analysis, Insights and Forecast - by Application
- 8.2.1. Medical Imaging
- 8.2.2. Information Storage
- 8.2.3. Drug Delivery
- 8.2.4. Health Sensors and Replicators
- 8.2.5. Other Applications
- 8.1. Market Analysis, Insights and Forecast - by Type of Manufacuturing
- 9. Rest of the World Nanorobotics Industry Analysis, Insights and Forecast, 2019-2031
- 9.1. Market Analysis, Insights and Forecast - by Type of Manufacuturing
- 9.1.1. Biochips
- 9.1.2. Nubots
- 9.1.3. Bacteria-based Nanobots
- 9.1.4. 3D Printing
- 9.1.5. Other Types
- 9.2. Market Analysis, Insights and Forecast - by Application
- 9.2.1. Medical Imaging
- 9.2.2. Information Storage
- 9.2.3. Drug Delivery
- 9.2.4. Health Sensors and Replicators
- 9.2.5. Other Applications
- 9.1. Market Analysis, Insights and Forecast - by Type of Manufacuturing
- 10. North America Nanorobotics Industry Analysis, Insights and Forecast, 2019-2031
- 10.1. Market Analysis, Insights and Forecast - By Country/Sub-region
- 10.1.1 United States
- 10.1.2 Canada
- 10.1.3 Mexico
- 11. Europe Nanorobotics Industry Analysis, Insights and Forecast, 2019-2031
- 11.1. Market Analysis, Insights and Forecast - By Country/Sub-region
- 11.1.1 Germany
- 11.1.2 United Kingdom
- 11.1.3 France
- 11.1.4 Spain
- 11.1.5 Italy
- 11.1.6 Spain
- 11.1.7 Belgium
- 11.1.8 Netherland
- 11.1.9 Nordics
- 11.1.10 Rest of Europe
- 12. Asia Pacific Nanorobotics Industry Analysis, Insights and Forecast, 2019-2031
- 12.1. Market Analysis, Insights and Forecast - By Country/Sub-region
- 12.1.1 China
- 12.1.2 Japan
- 12.1.3 India
- 12.1.4 South Korea
- 12.1.5 Southeast Asia
- 12.1.6 Australia
- 12.1.7 Indonesia
- 12.1.8 Phillipes
- 12.1.9 Singapore
- 12.1.10 Thailandc
- 12.1.11 Rest of Asia Pacific
- 13. South America Nanorobotics Industry Analysis, Insights and Forecast, 2019-2031
- 13.1. Market Analysis, Insights and Forecast - By Country/Sub-region
- 13.1.1 Brazil
- 13.1.2 Argentina
- 13.1.3 Peru
- 13.1.4 Chile
- 13.1.5 Colombia
- 13.1.6 Ecuador
- 13.1.7 Venezuela
- 13.1.8 Rest of South America
- 14. North America Nanorobotics Industry Analysis, Insights and Forecast, 2019-2031
- 14.1. Market Analysis, Insights and Forecast - By Country/Sub-region
- 14.1.1 United States
- 14.1.2 Canada
- 14.1.3 Mexico
- 15. MEA Nanorobotics Industry Analysis, Insights and Forecast, 2019-2031
- 15.1. Market Analysis, Insights and Forecast - By Country/Sub-region
- 15.1.1 United Arab Emirates
- 15.1.2 Saudi Arabia
- 15.1.3 South Africa
- 15.1.4 Rest of Middle East and Africa
- 16. Competitive Analysis
- 16.1. Global Market Share Analysis 2024
- 16.2. Company Profiles
- 16.2.1 EV Group
- 16.2.1.1. Overview
- 16.2.1.2. Products
- 16.2.1.3. SWOT Analysis
- 16.2.1.4. Recent Developments
- 16.2.1.5. Financials (Based on Availability)
- 16.2.2 Zymergen Inc
- 16.2.2.1. Overview
- 16.2.2.2. Products
- 16.2.2.3. SWOT Analysis
- 16.2.2.4. Recent Developments
- 16.2.2.5. Financials (Based on Availability)
- 16.2.3 Toronto Nano Instrumentation Inc
- 16.2.3.1. Overview
- 16.2.3.2. Products
- 16.2.3.3. SWOT Analysis
- 16.2.3.4. Recent Developments
- 16.2.3.5. Financials (Based on Availability)
- 16.2.4 Thermo Fisher Scientific Inc
- 16.2.4.1. Overview
- 16.2.4.2. Products
- 16.2.4.3. SWOT Analysis
- 16.2.4.4. Recent Developments
- 16.2.4.5. Financials (Based on Availability)
- 16.2.5 Ginkgo Bioworks Inc
- 16.2.5.1. Overview
- 16.2.5.2. Products
- 16.2.5.3. SWOT Analysis
- 16.2.5.4. Recent Developments
- 16.2.5.5. Financials (Based on Availability)
- 16.2.6 Oxford Instruments
- 16.2.6.1. Overview
- 16.2.6.2. Products
- 16.2.6.3. SWOT Analysis
- 16.2.6.4. Recent Developments
- 16.2.6.5. Financials (Based on Availability)
- 16.2.7 Imina Technologies SA
- 16.2.7.1. Overview
- 16.2.7.2. Products
- 16.2.7.3. SWOT Analysis
- 16.2.7.4. Recent Developments
- 16.2.7.5. Financials (Based on Availability)
- 16.2.8 Synthace Limited
- 16.2.8.1. Overview
- 16.2.8.2. Products
- 16.2.8.3. SWOT Analysis
- 16.2.8.4. Recent Developments
- 16.2.8.5. Financials (Based on Availability)
- 16.2.9 Illumina Inc
- 16.2.9.1. Overview
- 16.2.9.2. Products
- 16.2.9.3. SWOT Analysis
- 16.2.9.4. Recent Developments
- 16.2.9.5. Financials (Based on Availability)
- 16.2.10 Nanoics Imaging Limited
- 16.2.10.1. Overview
- 16.2.10.2. Products
- 16.2.10.3. SWOT Analysis
- 16.2.10.4. Recent Developments
- 16.2.10.5. Financials (Based on Availability)
- 16.2.1 EV Group
List of Figures
- Figure 1: Global Nanorobotics Industry Revenue Breakdown (Million, %) by Region 2024 & 2032
- Figure 2: North America Nanorobotics Industry Revenue (Million), by Country 2024 & 2032
- Figure 3: North America Nanorobotics Industry Revenue Share (%), by Country 2024 & 2032
- Figure 4: Europe Nanorobotics Industry Revenue (Million), by Country 2024 & 2032
- Figure 5: Europe Nanorobotics Industry Revenue Share (%), by Country 2024 & 2032
- Figure 6: Asia Pacific Nanorobotics Industry Revenue (Million), by Country 2024 & 2032
- Figure 7: Asia Pacific Nanorobotics Industry Revenue Share (%), by Country 2024 & 2032
- Figure 8: South America Nanorobotics Industry Revenue (Million), by Country 2024 & 2032
- Figure 9: South America Nanorobotics Industry Revenue Share (%), by Country 2024 & 2032
- Figure 10: North America Nanorobotics Industry Revenue (Million), by Country 2024 & 2032
- Figure 11: North America Nanorobotics Industry Revenue Share (%), by Country 2024 & 2032
- Figure 12: MEA Nanorobotics Industry Revenue (Million), by Country 2024 & 2032
- Figure 13: MEA Nanorobotics Industry Revenue Share (%), by Country 2024 & 2032
- Figure 14: North America Nanorobotics Industry Revenue (Million), by Type of Manufacuturing 2024 & 2032
- Figure 15: North America Nanorobotics Industry Revenue Share (%), by Type of Manufacuturing 2024 & 2032
- Figure 16: North America Nanorobotics Industry Revenue (Million), by Application 2024 & 2032
- Figure 17: North America Nanorobotics Industry Revenue Share (%), by Application 2024 & 2032
- Figure 18: North America Nanorobotics Industry Revenue (Million), by Country 2024 & 2032
- Figure 19: North America Nanorobotics Industry Revenue Share (%), by Country 2024 & 2032
- Figure 20: Europe Nanorobotics Industry Revenue (Million), by Type of Manufacuturing 2024 & 2032
- Figure 21: Europe Nanorobotics Industry Revenue Share (%), by Type of Manufacuturing 2024 & 2032
- Figure 22: Europe Nanorobotics Industry Revenue (Million), by Application 2024 & 2032
- Figure 23: Europe Nanorobotics Industry Revenue Share (%), by Application 2024 & 2032
- Figure 24: Europe Nanorobotics Industry Revenue (Million), by Country 2024 & 2032
- Figure 25: Europe Nanorobotics Industry Revenue Share (%), by Country 2024 & 2032
- Figure 26: Asia Pacific Nanorobotics Industry Revenue (Million), by Type of Manufacuturing 2024 & 2032
- Figure 27: Asia Pacific Nanorobotics Industry Revenue Share (%), by Type of Manufacuturing 2024 & 2032
- Figure 28: Asia Pacific Nanorobotics Industry Revenue (Million), by Application 2024 & 2032
- Figure 29: Asia Pacific Nanorobotics Industry Revenue Share (%), by Application 2024 & 2032
- Figure 30: Asia Pacific Nanorobotics Industry Revenue (Million), by Country 2024 & 2032
- Figure 31: Asia Pacific Nanorobotics Industry Revenue Share (%), by Country 2024 & 2032
- Figure 32: Rest of the World Nanorobotics Industry Revenue (Million), by Type of Manufacuturing 2024 & 2032
- Figure 33: Rest of the World Nanorobotics Industry Revenue Share (%), by Type of Manufacuturing 2024 & 2032
- Figure 34: Rest of the World Nanorobotics Industry Revenue (Million), by Application 2024 & 2032
- Figure 35: Rest of the World Nanorobotics Industry Revenue Share (%), by Application 2024 & 2032
- Figure 36: Rest of the World Nanorobotics Industry Revenue (Million), by Country 2024 & 2032
- Figure 37: Rest of the World Nanorobotics Industry Revenue Share (%), by Country 2024 & 2032
List of Tables
- Table 1: Global Nanorobotics Industry Revenue Million Forecast, by Region 2019 & 2032
- Table 2: Global Nanorobotics Industry Revenue Million Forecast, by Type of Manufacuturing 2019 & 2032
- Table 3: Global Nanorobotics Industry Revenue Million Forecast, by Application 2019 & 2032
- Table 4: Global Nanorobotics Industry Revenue Million Forecast, by Region 2019 & 2032
- Table 5: Global Nanorobotics Industry Revenue Million Forecast, by Country 2019 & 2032
- Table 6: United States Nanorobotics Industry Revenue (Million) Forecast, by Application 2019 & 2032
- Table 7: Canada Nanorobotics Industry Revenue (Million) Forecast, by Application 2019 & 2032
- Table 8: Mexico Nanorobotics Industry Revenue (Million) Forecast, by Application 2019 & 2032
- Table 9: Global Nanorobotics Industry Revenue Million Forecast, by Country 2019 & 2032
- Table 10: Germany Nanorobotics Industry Revenue (Million) Forecast, by Application 2019 & 2032
- Table 11: United Kingdom Nanorobotics Industry Revenue (Million) Forecast, by Application 2019 & 2032
- Table 12: France Nanorobotics Industry Revenue (Million) Forecast, by Application 2019 & 2032
- Table 13: Spain Nanorobotics Industry Revenue (Million) Forecast, by Application 2019 & 2032
- Table 14: Italy Nanorobotics Industry Revenue (Million) Forecast, by Application 2019 & 2032
- Table 15: Spain Nanorobotics Industry Revenue (Million) Forecast, by Application 2019 & 2032
- Table 16: Belgium Nanorobotics Industry Revenue (Million) Forecast, by Application 2019 & 2032
- Table 17: Netherland Nanorobotics Industry Revenue (Million) Forecast, by Application 2019 & 2032
- Table 18: Nordics Nanorobotics Industry Revenue (Million) Forecast, by Application 2019 & 2032
- Table 19: Rest of Europe Nanorobotics Industry Revenue (Million) Forecast, by Application 2019 & 2032
- Table 20: Global Nanorobotics Industry Revenue Million Forecast, by Country 2019 & 2032
- Table 21: China Nanorobotics Industry Revenue (Million) Forecast, by Application 2019 & 2032
- Table 22: Japan Nanorobotics Industry Revenue (Million) Forecast, by Application 2019 & 2032
- Table 23: India Nanorobotics Industry Revenue (Million) Forecast, by Application 2019 & 2032
- Table 24: South Korea Nanorobotics Industry Revenue (Million) Forecast, by Application 2019 & 2032
- Table 25: Southeast Asia Nanorobotics Industry Revenue (Million) Forecast, by Application 2019 & 2032
- Table 26: Australia Nanorobotics Industry Revenue (Million) Forecast, by Application 2019 & 2032
- Table 27: Indonesia Nanorobotics Industry Revenue (Million) Forecast, by Application 2019 & 2032
- Table 28: Phillipes Nanorobotics Industry Revenue (Million) Forecast, by Application 2019 & 2032
- Table 29: Singapore Nanorobotics Industry Revenue (Million) Forecast, by Application 2019 & 2032
- Table 30: Thailandc Nanorobotics Industry Revenue (Million) Forecast, by Application 2019 & 2032
- Table 31: Rest of Asia Pacific Nanorobotics Industry Revenue (Million) Forecast, by Application 2019 & 2032
- Table 32: Global Nanorobotics Industry Revenue Million Forecast, by Country 2019 & 2032
- Table 33: Brazil Nanorobotics Industry Revenue (Million) Forecast, by Application 2019 & 2032
- Table 34: Argentina Nanorobotics Industry Revenue (Million) Forecast, by Application 2019 & 2032
- Table 35: Peru Nanorobotics Industry Revenue (Million) Forecast, by Application 2019 & 2032
- Table 36: Chile Nanorobotics Industry Revenue (Million) Forecast, by Application 2019 & 2032
- Table 37: Colombia Nanorobotics Industry Revenue (Million) Forecast, by Application 2019 & 2032
- Table 38: Ecuador Nanorobotics Industry Revenue (Million) Forecast, by Application 2019 & 2032
- Table 39: Venezuela Nanorobotics Industry Revenue (Million) Forecast, by Application 2019 & 2032
- Table 40: Rest of South America Nanorobotics Industry Revenue (Million) Forecast, by Application 2019 & 2032
- Table 41: Global Nanorobotics Industry Revenue Million Forecast, by Country 2019 & 2032
- Table 42: United States Nanorobotics Industry Revenue (Million) Forecast, by Application 2019 & 2032
- Table 43: Canada Nanorobotics Industry Revenue (Million) Forecast, by Application 2019 & 2032
- Table 44: Mexico Nanorobotics Industry Revenue (Million) Forecast, by Application 2019 & 2032
- Table 45: Global Nanorobotics Industry Revenue Million Forecast, by Country 2019 & 2032
- Table 46: United Arab Emirates Nanorobotics Industry Revenue (Million) Forecast, by Application 2019 & 2032
- Table 47: Saudi Arabia Nanorobotics Industry Revenue (Million) Forecast, by Application 2019 & 2032
- Table 48: South Africa Nanorobotics Industry Revenue (Million) Forecast, by Application 2019 & 2032
- Table 49: Rest of Middle East and Africa Nanorobotics Industry Revenue (Million) Forecast, by Application 2019 & 2032
- Table 50: Global Nanorobotics Industry Revenue Million Forecast, by Type of Manufacuturing 2019 & 2032
- Table 51: Global Nanorobotics Industry Revenue Million Forecast, by Application 2019 & 2032
- Table 52: Global Nanorobotics Industry Revenue Million Forecast, by Country 2019 & 2032
- Table 53: Unites States Nanorobotics Industry Revenue (Million) Forecast, by Application 2019 & 2032
- Table 54: Canada Nanorobotics Industry Revenue (Million) Forecast, by Application 2019 & 2032
- Table 55: Global Nanorobotics Industry Revenue Million Forecast, by Type of Manufacuturing 2019 & 2032
- Table 56: Global Nanorobotics Industry Revenue Million Forecast, by Application 2019 & 2032
- Table 57: Global Nanorobotics Industry Revenue Million Forecast, by Country 2019 & 2032
- Table 58: Germany Nanorobotics Industry Revenue (Million) Forecast, by Application 2019 & 2032
- Table 59: United Kingdom Nanorobotics Industry Revenue (Million) Forecast, by Application 2019 & 2032
- Table 60: France Nanorobotics Industry Revenue (Million) Forecast, by Application 2019 & 2032
- Table 61: Rest of Europe Nanorobotics Industry Revenue (Million) Forecast, by Application 2019 & 2032
- Table 62: Global Nanorobotics Industry Revenue Million Forecast, by Type of Manufacuturing 2019 & 2032
- Table 63: Global Nanorobotics Industry Revenue Million Forecast, by Application 2019 & 2032
- Table 64: Global Nanorobotics Industry Revenue Million Forecast, by Country 2019 & 2032
- Table 65: India Nanorobotics Industry Revenue (Million) Forecast, by Application 2019 & 2032
- Table 66: China Nanorobotics Industry Revenue (Million) Forecast, by Application 2019 & 2032
- Table 67: Japan Nanorobotics Industry Revenue (Million) Forecast, by Application 2019 & 2032
- Table 68: Rest of Asia Pacific Nanorobotics Industry Revenue (Million) Forecast, by Application 2019 & 2032
- Table 69: Global Nanorobotics Industry Revenue Million Forecast, by Type of Manufacuturing 2019 & 2032
- Table 70: Global Nanorobotics Industry Revenue Million Forecast, by Application 2019 & 2032
- Table 71: Global Nanorobotics Industry Revenue Million Forecast, by Country 2019 & 2032
- Table 72: Latin America Nanorobotics Industry Revenue (Million) Forecast, by Application 2019 & 2032
- Table 73: Middle East and Africa Nanorobotics Industry Revenue (Million) Forecast, by Application 2019 & 2032
Frequently Asked Questions
1. What is the projected Compound Annual Growth Rate (CAGR) of the Nanorobotics Industry?
The projected CAGR is approximately 10.00%.
2. Which companies are prominent players in the Nanorobotics Industry?
Key companies in the market include EV Group, Zymergen Inc, Toronto Nano Instrumentation Inc , Thermo Fisher Scientific Inc, Ginkgo Bioworks Inc, Oxford Instruments, Imina Technologies SA, Synthace Limited, Illumina Inc, Nanoics Imaging Limited.
3. What are the main segments of the Nanorobotics Industry?
The market segments include Type of Manufacuturing, Application.
4. Can you provide details about the market size?
The market size is estimated to be USD XX Million as of 2022.
5. What are some drivers contributing to market growth?
; Increasing Investment in Technology by Governments and Universities; Growing Demand for Advanced Medical Treatments.
6. What are the notable trends driving market growth?
Drug Delivery Application is Expected to Witness Significant Growth Rate.
7. Are there any restraints impacting market growth?
; High Manufacturing and Development Costs.
8. Can you provide examples of recent developments in the market?
N/A
9. What pricing options are available for accessing the report?
Pricing options include single-user, multi-user, and enterprise licenses priced at USD 4750, USD 5250, and USD 8750 respectively.
10. Is the market size provided in terms of value or volume?
The market size is provided in terms of value, measured in Million.
11. Are there any specific market keywords associated with the report?
Yes, the market keyword associated with the report is "Nanorobotics Industry," which aids in identifying and referencing the specific market segment covered.
12. How do I determine which pricing option suits my needs best?
The pricing options vary based on user requirements and access needs. Individual users may opt for single-user licenses, while businesses requiring broader access may choose multi-user or enterprise licenses for cost-effective access to the report.
13. Are there any additional resources or data provided in the Nanorobotics Industry report?
While the report offers comprehensive insights, it's advisable to review the specific contents or supplementary materials provided to ascertain if additional resources or data are available.
14. How can I stay updated on further developments or reports in the Nanorobotics Industry?
To stay informed about further developments, trends, and reports in the Nanorobotics Industry, consider subscribing to industry newsletters, following relevant companies and organizations, or regularly checking reputable industry news sources and publications.
Methodology
Step 1 - Identification of Relevant Samples Size from Population Database


Step 2 - Approaches for Defining Global Market Size (Value, Volume* & Price*)

Note*: In applicable scenarios
Step 3 - Data Sources
Primary Research
- Web Analytics
- Survey Reports
- Research Institute
- Latest Research Reports
- Opinion Leaders
Secondary Research
- Annual Reports
- White Paper
- Latest Press Release
- Industry Association
- Paid Database
- Investor Presentations

Step 4 - Data Triangulation
Involves using different sources of information in order to increase the validity of a study
These sources are likely to be stakeholders in a program - participants, other researchers, program staff, other community members, and so on.
Then we put all data in single framework & apply various statistical tools to find out the dynamic on the market.
During the analysis stage, feedback from the stakeholder groups would be compared to determine areas of agreement as well as areas of divergence
