

Key Insights
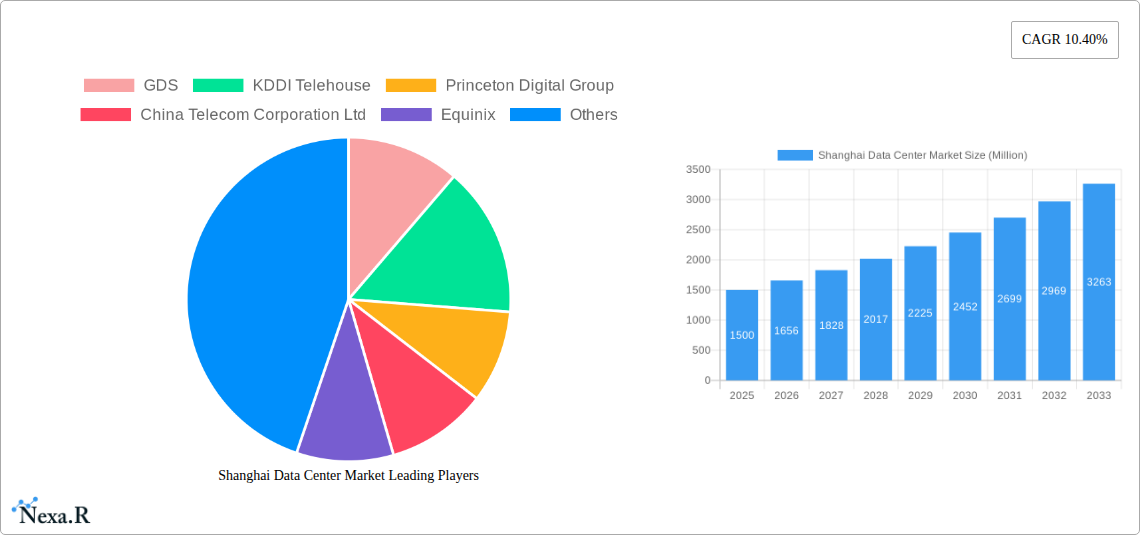
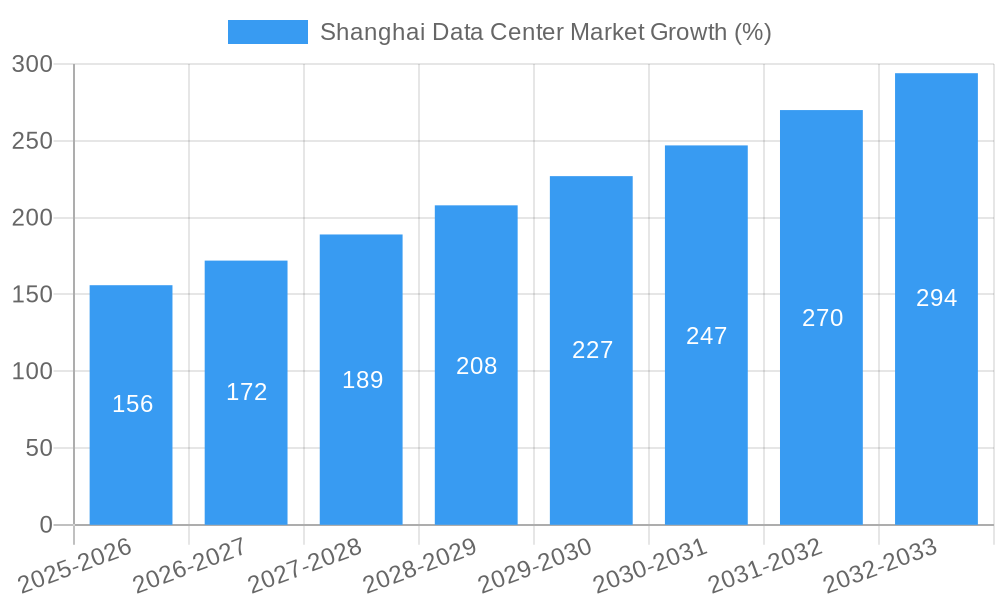
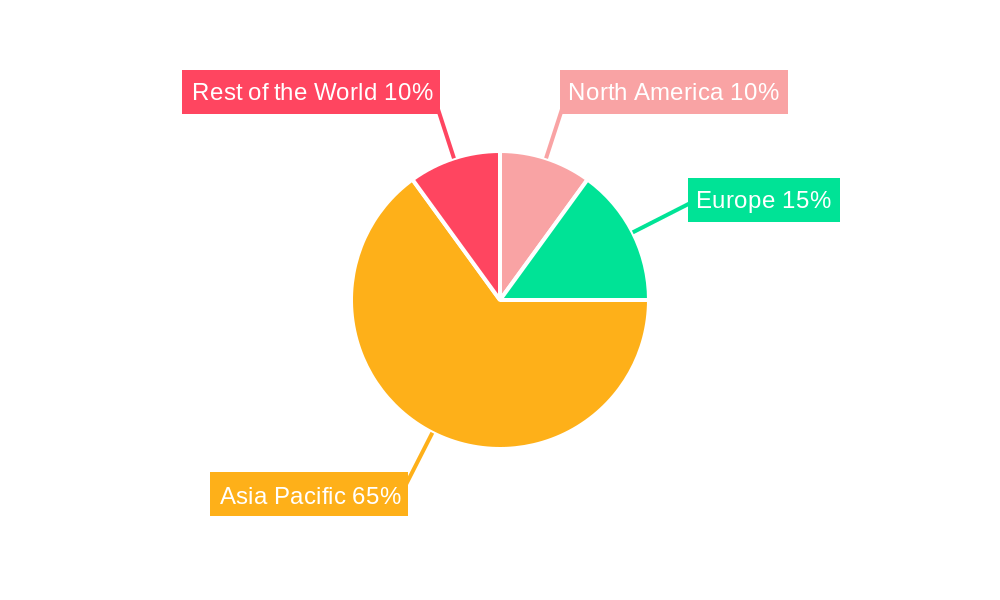
The Shanghai data center market is experiencing robust growth, driven by the city's burgeoning digital economy and increasing cloud adoption. The market's Compound Annual Growth Rate (CAGR) of 10.40% from 2019 to 2024 indicates significant expansion, projected to continue throughout the forecast period (2025-2033). Key drivers include the government's initiatives promoting digital transformation, the expansion of e-commerce and fintech sectors, and the rising demand for high-bandwidth applications like streaming and cloud gaming. While constraints such as land scarcity and energy consumption remain, the market's resilience is evident in the diverse range of segments, including retail, wholesale, and hyperscale colocation types, catering to a wide spectrum of end users from cloud & IT companies to BFSI and manufacturing. Leading players like Equinix, NTT Ltd., and China Telecom Corporation Ltd. are strategically investing in expanding their capacity to meet the rising demand. The Asia Pacific region, with Shanghai at its heart, is expected to dominate the market share, propelled by strong economic growth and supportive government policies. The increasing demand for higher tiers of data centers (Tier 1 & Tier 2), reflecting a need for greater reliability and resilience, also contributes to market expansion. The shift towards larger data center sizes (Medium, Large, and Mega) signifies a preference for scalability and cost-effectiveness.
The Shanghai data center market's segmentation offers valuable insights into its dynamics. The high utilization of absorption capacity demonstrates a healthy demand, particularly within the cloud & IT and telecom sectors. The robust growth across various colocation types highlights market maturity and the adaptability of service providers. Growth in the hyperscale segment indicates the increasing reliance on large-scale cloud infrastructure. Future growth hinges on overcoming challenges related to infrastructure development, managing energy consumption, and ensuring data security and compliance. Strategic partnerships and technological advancements, such as improved cooling systems and AI-powered resource management, are crucial for sustainable market expansion in the coming years. Further research into specific regional dynamics and evolving technological trends will be critical in accurately projecting market value over the long term.
Shanghai Data Center Market Report: 2019-2033
This comprehensive report provides an in-depth analysis of the Shanghai data center market, encompassing market dynamics, growth trends, key players, and future outlook. It covers the period from 2019 to 2033, with 2025 as the base and estimated year. The report is a valuable resource for industry professionals, investors, and businesses seeking to understand and capitalize on opportunities within this rapidly evolving market.
Keywords: Shanghai data center market, data center colocation, hyperscale data centers, cloud computing, retail colocation, wholesale colocation, data center infrastructure, China data center market, Tier 1 data center, GDS, KDDI Telehouse, Princeton Digital Group, China Telecom, Equinix, Chayora, NTT Ltd, data center absorption, data center size, market size, market growth, market share, M&A activity.
Shanghai Data Center Market Dynamics & Structure
The Shanghai data center market is characterized by a dynamic interplay of technological advancements, regulatory frameworks, and intense competition. Market concentration is moderate, with several large players dominating alongside smaller, specialized providers. Technological innovation, driven by the increasing demand for high-performance computing and cloud services, is a key driver. However, regulatory hurdles and the need for substantial capital investment pose significant barriers to entry for new entrants. The market exhibits strong M&A activity, with larger players strategically acquiring smaller firms to expand their footprint and enhance their service offerings.
- Market Concentration: Moderate, with top 5 players holding approximately XX% market share in 2025.
- Technological Innovation: Significant investment in 5G, edge computing, and AI infrastructure driving growth.
- Regulatory Framework: Government policies promoting digital infrastructure development and data security create both opportunities and challenges.
- Competitive Substitutes: Limited direct substitutes, but alternative cloud services and distributed computing models pose indirect competition.
- End-User Demographics: Strong growth driven by the increasing adoption of cloud computing across diverse sectors, notably Cloud & IT, Telecom, and E-Commerce.
- M&A Trends: Significant M&A activity in the past five years, with an estimated XX deals completed between 2019 and 2024.
Shanghai Data Center Market Growth Trends & Insights
The Shanghai data center market experienced robust growth during the historical period (2019-2024), fueled by the rapid expansion of the digital economy. The market size reached XX million in 2024 and is projected to reach XX million in 2025, exhibiting a CAGR of XX% during the forecast period (2025-2033). This growth is primarily driven by the increasing adoption of cloud services, the proliferation of data-intensive applications, and the government's push for digital transformation. The market penetration rate for colocation services is expected to increase significantly, driven by the demand for scalable and reliable IT infrastructure. Technological disruptions, such as the rise of edge computing and the increasing adoption of hyperscale data centers, are further shaping market dynamics and influencing consumer behavior shifts towards greater efficiency and cost optimization. The increasing focus on data security and compliance also presents opportunities for data center providers specializing in security and compliance solutions.
Dominant Regions, Countries, or Segments in Shanghai Data Center Market
The Pudong district of Shanghai stands as the dominant region within the Shanghai data center market, due to its well-established infrastructure, proximity to major telecommunication hubs, and supportive regulatory environment. Within the segment breakdown, the Hyperscale segment demonstrates the highest growth potential, driven by the expansion of cloud providers and the rise of data-intensive applications. The Cloud & IT end-user segment also plays a crucial role, accounting for a significant share of the total market demand.
- Key Drivers:
- Well-developed infrastructure and connectivity in Pudong.
- Supportive government policies and incentives.
- High concentration of major technology companies and data users.
- Dominant Segments: Hyperscale Colocation and Cloud & IT end-user segment.
- Growth Potential: Significant opportunities exist in expanding capacity within Pudong and exploring new regions with growing demand.
Shanghai Data Center Market Product Landscape
The Shanghai data center market offers a diverse range of products and services, encompassing retail, wholesale, and hyperscale colocation options. These services cater to various needs, ranging from small businesses to large enterprises and hyperscale cloud providers. Technological advancements are leading to increased energy efficiency, higher density deployments, and improved security features in data center facilities. Products are increasingly differentiated by their sustainability features, disaster recovery capabilities, and capacity to adapt to emerging technologies like edge computing and AI. Unique selling propositions often revolve around service level agreements (SLAs), customer support, and strategic location advantages.
Key Drivers, Barriers & Challenges in Shanghai Data Center Market
Key Drivers:
- Increasing Cloud Adoption: The surge in cloud computing across all sectors drives substantial demand for data center capacity.
- Government Initiatives: Government support for digital infrastructure development fosters market growth.
- 5G & Edge Computing: These technologies create new opportunities for data center deployments closer to end users.
Challenges:
- High Infrastructure Costs: Significant investments are required for land acquisition, construction, and equipment.
- Energy Consumption: Data centers are energy intensive, posing environmental and cost concerns.
- Regulatory Compliance: Meeting stringent data security and privacy regulations adds complexity.
Emerging Opportunities in Shanghai Data Center Market
Emerging opportunities arise from the growth of edge computing, creating demand for smaller, geographically distributed data centers. Further potential lies in the adoption of sustainable and energy-efficient technologies within data center infrastructure. The increasing focus on data security and privacy presents further opportunities for specialized data center services that offer advanced security features and compliance capabilities.
Growth Accelerators in the Shanghai Data Center Market Industry
Long-term growth is accelerated by continuous technological advancements in areas such as AI, machine learning, and IoT, which generate large volumes of data requiring robust data center infrastructure. Strategic partnerships between data center providers and cloud service providers further enhance market expansion. Government initiatives to support the growth of digital industries provide a strong foundation for long-term growth prospects.
Key Players Shaping the Shanghai Data Center Market Market
- GDS
- KDDI Telehouse
- Princeton Digital Group
- China Telecom Corporation Ltd
- Equinix
- Chayora Ltd
- NTT Ltd
Notable Milestones in Shanghai Data Center Market Sector
- 2021 Q3: GDS announces expansion of its Shanghai data center campus.
- 2022 Q1: China Telecom launches a new hyperscale data center in Shanghai.
- 2023 Q2: Equinix acquires a local data center provider in Shanghai.
- 2024 Q4: New regulations on data sovereignty come into effect in Shanghai.
In-Depth Shanghai Data Center Market Market Outlook
The Shanghai data center market is poised for continued robust growth over the next decade. The convergence of technological innovation, supportive government policies, and increasing demand from various sectors will drive market expansion. Strategic partnerships, investments in sustainable infrastructure, and expansion into new geographic areas present key strategic opportunities for data center providers. The focus on meeting stringent regulatory requirements and providing advanced security features will be crucial for success in this competitive market.
Shanghai Data Center Market Segmentation
-
1. DC Size
- 1.1. Small
- 1.2. Medium
- 1.3. Large
- 1.4. Massive
- 1.5. Mega
-
2. Tier Type
- 2.1. Tier 1 & 2
- 2.2. Tier 3
- 2.3. Tier 4
-
3. Absorption
-
3.1. Utilized
-
3.1.1. Colocation Type
- 3.1.1.1. Retail
- 3.1.1.2. Wholesale
- 3.1.1.3. Hyperscale
-
3.1.2. End User
- 3.1.2.1. Cloud & IT
- 3.1.2.2. Telecom
- 3.1.2.3. Media & Entertainment
- 3.1.2.4. Government
- 3.1.2.5. BFSI
- 3.1.2.6. Manufacturing
- 3.1.2.7. E-Commerce
- 3.1.2.8. Other End User
-
3.1.1. Colocation Type
- 3.2. Non-Utilized
-
3.1. Utilized
Shanghai Data Center Market Segmentation By Geography
-
1. North America
- 1.1. United States
- 1.2. Canada
- 1.3. Mexico
-
2. South America
- 2.1. Brazil
- 2.2. Argentina
- 2.3. Rest of South America
-
3. Europe
- 3.1. United Kingdom
- 3.2. Germany
- 3.3. France
- 3.4. Italy
- 3.5. Spain
- 3.6. Russia
- 3.7. Benelux
- 3.8. Nordics
- 3.9. Rest of Europe
-
4. Middle East & Africa
- 4.1. Turkey
- 4.2. Israel
- 4.3. GCC
- 4.4. North Africa
- 4.5. South Africa
- 4.6. Rest of Middle East & Africa
-
5. Asia Pacific
- 5.1. China
- 5.2. India
- 5.3. Japan
- 5.4. South Korea
- 5.5. ASEAN
- 5.6. Oceania
- 5.7. Rest of Asia Pacific
Shanghai Data Center Market REPORT HIGHLIGHTS
| Aspects | Details |
|---|---|
| Study Period | 2019-2033 |
| Base Year | 2024 |
| Estimated Year | 2025 |
| Forecast Period | 2025-2033 |
| Historical Period | 2019-2024 |
| Growth Rate | CAGR of 10.40% from 2019-2033 |
| Segmentation |
|
Table of Contents
- 1. Introduction
- 1.1. Research Scope
- 1.2. Market Segmentation
- 1.3. Research Methodology
- 1.4. Definitions and Assumptions
- 2. Executive Summary
- 2.1. Introduction
- 3. Market Dynamics
- 3.1. Introduction
- 3.2. Market Drivers
- 3.2.1. Continuous roll out of 5G; Growth of high-quality defensive companies; Demand for new digital services
- 3.3. Market Restrains
- 3.3.1. High Cost of Satellite Imaging Data Acquisition and Processing; High-resolution Images Offered by Other Imaging Technologies
- 3.4. Market Trends
- 3.4.1. Increasing cloud and colocation services are anticipated to drive the growth of data center market in the Shanghai.
- 4. Market Factor Analysis
- 4.1. Porters Five Forces
- 4.2. Supply/Value Chain
- 4.3. PESTEL analysis
- 4.4. Market Entropy
- 4.5. Patent/Trademark Analysis
- 5. Global Shanghai Data Center Market Analysis, Insights and Forecast, 2019-2031
- 5.1. Market Analysis, Insights and Forecast - by DC Size
- 5.1.1. Small
- 5.1.2. Medium
- 5.1.3. Large
- 5.1.4. Massive
- 5.1.5. Mega
- 5.2. Market Analysis, Insights and Forecast - by Tier Type
- 5.2.1. Tier 1 & 2
- 5.2.2. Tier 3
- 5.2.3. Tier 4
- 5.3. Market Analysis, Insights and Forecast - by Absorption
- 5.3.1. Utilized
- 5.3.1.1. Colocation Type
- 5.3.1.1.1. Retail
- 5.3.1.1.2. Wholesale
- 5.3.1.1.3. Hyperscale
- 5.3.1.2. End User
- 5.3.1.2.1. Cloud & IT
- 5.3.1.2.2. Telecom
- 5.3.1.2.3. Media & Entertainment
- 5.3.1.2.4. Government
- 5.3.1.2.5. BFSI
- 5.3.1.2.6. Manufacturing
- 5.3.1.2.7. E-Commerce
- 5.3.1.2.8. Other End User
- 5.3.1.1. Colocation Type
- 5.3.2. Non-Utilized
- 5.3.1. Utilized
- 5.4. Market Analysis, Insights and Forecast - by Region
- 5.4.1. North America
- 5.4.2. South America
- 5.4.3. Europe
- 5.4.4. Middle East & Africa
- 5.4.5. Asia Pacific
- 5.1. Market Analysis, Insights and Forecast - by DC Size
- 6. North America Shanghai Data Center Market Analysis, Insights and Forecast, 2019-2031
- 6.1. Market Analysis, Insights and Forecast - by DC Size
- 6.1.1. Small
- 6.1.2. Medium
- 6.1.3. Large
- 6.1.4. Massive
- 6.1.5. Mega
- 6.2. Market Analysis, Insights and Forecast - by Tier Type
- 6.2.1. Tier 1 & 2
- 6.2.2. Tier 3
- 6.2.3. Tier 4
- 6.3. Market Analysis, Insights and Forecast - by Absorption
- 6.3.1. Utilized
- 6.3.1.1. Colocation Type
- 6.3.1.1.1. Retail
- 6.3.1.1.2. Wholesale
- 6.3.1.1.3. Hyperscale
- 6.3.1.2. End User
- 6.3.1.2.1. Cloud & IT
- 6.3.1.2.2. Telecom
- 6.3.1.2.3. Media & Entertainment
- 6.3.1.2.4. Government
- 6.3.1.2.5. BFSI
- 6.3.1.2.6. Manufacturing
- 6.3.1.2.7. E-Commerce
- 6.3.1.2.8. Other End User
- 6.3.1.1. Colocation Type
- 6.3.2. Non-Utilized
- 6.3.1. Utilized
- 6.1. Market Analysis, Insights and Forecast - by DC Size
- 7. South America Shanghai Data Center Market Analysis, Insights and Forecast, 2019-2031
- 7.1. Market Analysis, Insights and Forecast - by DC Size
- 7.1.1. Small
- 7.1.2. Medium
- 7.1.3. Large
- 7.1.4. Massive
- 7.1.5. Mega
- 7.2. Market Analysis, Insights and Forecast - by Tier Type
- 7.2.1. Tier 1 & 2
- 7.2.2. Tier 3
- 7.2.3. Tier 4
- 7.3. Market Analysis, Insights and Forecast - by Absorption
- 7.3.1. Utilized
- 7.3.1.1. Colocation Type
- 7.3.1.1.1. Retail
- 7.3.1.1.2. Wholesale
- 7.3.1.1.3. Hyperscale
- 7.3.1.2. End User
- 7.3.1.2.1. Cloud & IT
- 7.3.1.2.2. Telecom
- 7.3.1.2.3. Media & Entertainment
- 7.3.1.2.4. Government
- 7.3.1.2.5. BFSI
- 7.3.1.2.6. Manufacturing
- 7.3.1.2.7. E-Commerce
- 7.3.1.2.8. Other End User
- 7.3.1.1. Colocation Type
- 7.3.2. Non-Utilized
- 7.3.1. Utilized
- 7.1. Market Analysis, Insights and Forecast - by DC Size
- 8. Europe Shanghai Data Center Market Analysis, Insights and Forecast, 2019-2031
- 8.1. Market Analysis, Insights and Forecast - by DC Size
- 8.1.1. Small
- 8.1.2. Medium
- 8.1.3. Large
- 8.1.4. Massive
- 8.1.5. Mega
- 8.2. Market Analysis, Insights and Forecast - by Tier Type
- 8.2.1. Tier 1 & 2
- 8.2.2. Tier 3
- 8.2.3. Tier 4
- 8.3. Market Analysis, Insights and Forecast - by Absorption
- 8.3.1. Utilized
- 8.3.1.1. Colocation Type
- 8.3.1.1.1. Retail
- 8.3.1.1.2. Wholesale
- 8.3.1.1.3. Hyperscale
- 8.3.1.2. End User
- 8.3.1.2.1. Cloud & IT
- 8.3.1.2.2. Telecom
- 8.3.1.2.3. Media & Entertainment
- 8.3.1.2.4. Government
- 8.3.1.2.5. BFSI
- 8.3.1.2.6. Manufacturing
- 8.3.1.2.7. E-Commerce
- 8.3.1.2.8. Other End User
- 8.3.1.1. Colocation Type
- 8.3.2. Non-Utilized
- 8.3.1. Utilized
- 8.1. Market Analysis, Insights and Forecast - by DC Size
- 9. Middle East & Africa Shanghai Data Center Market Analysis, Insights and Forecast, 2019-2031
- 9.1. Market Analysis, Insights and Forecast - by DC Size
- 9.1.1. Small
- 9.1.2. Medium
- 9.1.3. Large
- 9.1.4. Massive
- 9.1.5. Mega
- 9.2. Market Analysis, Insights and Forecast - by Tier Type
- 9.2.1. Tier 1 & 2
- 9.2.2. Tier 3
- 9.2.3. Tier 4
- 9.3. Market Analysis, Insights and Forecast - by Absorption
- 9.3.1. Utilized
- 9.3.1.1. Colocation Type
- 9.3.1.1.1. Retail
- 9.3.1.1.2. Wholesale
- 9.3.1.1.3. Hyperscale
- 9.3.1.2. End User
- 9.3.1.2.1. Cloud & IT
- 9.3.1.2.2. Telecom
- 9.3.1.2.3. Media & Entertainment
- 9.3.1.2.4. Government
- 9.3.1.2.5. BFSI
- 9.3.1.2.6. Manufacturing
- 9.3.1.2.7. E-Commerce
- 9.3.1.2.8. Other End User
- 9.3.1.1. Colocation Type
- 9.3.2. Non-Utilized
- 9.3.1. Utilized
- 9.1. Market Analysis, Insights and Forecast - by DC Size
- 10. Asia Pacific Shanghai Data Center Market Analysis, Insights and Forecast, 2019-2031
- 10.1. Market Analysis, Insights and Forecast - by DC Size
- 10.1.1. Small
- 10.1.2. Medium
- 10.1.3. Large
- 10.1.4. Massive
- 10.1.5. Mega
- 10.2. Market Analysis, Insights and Forecast - by Tier Type
- 10.2.1. Tier 1 & 2
- 10.2.2. Tier 3
- 10.2.3. Tier 4
- 10.3. Market Analysis, Insights and Forecast - by Absorption
- 10.3.1. Utilized
- 10.3.1.1. Colocation Type
- 10.3.1.1.1. Retail
- 10.3.1.1.2. Wholesale
- 10.3.1.1.3. Hyperscale
- 10.3.1.2. End User
- 10.3.1.2.1. Cloud & IT
- 10.3.1.2.2. Telecom
- 10.3.1.2.3. Media & Entertainment
- 10.3.1.2.4. Government
- 10.3.1.2.5. BFSI
- 10.3.1.2.6. Manufacturing
- 10.3.1.2.7. E-Commerce
- 10.3.1.2.8. Other End User
- 10.3.1.1. Colocation Type
- 10.3.2. Non-Utilized
- 10.3.1. Utilized
- 10.1. Market Analysis, Insights and Forecast - by DC Size
- 11. North America Shanghai Data Center Market Analysis, Insights and Forecast, 2019-2031
- 11.1. Market Analysis, Insights and Forecast - By Country/Sub-region
- 11.1.1.
- 12. Europe Shanghai Data Center Market Analysis, Insights and Forecast, 2019-2031
- 12.1. Market Analysis, Insights and Forecast - By Country/Sub-region
- 12.1.1.
- 13. Asia Pacific Shanghai Data Center Market Analysis, Insights and Forecast, 2019-2031
- 13.1. Market Analysis, Insights and Forecast - By Country/Sub-region
- 13.1.1.
- 14. Rest of the World Shanghai Data Center Market Analysis, Insights and Forecast, 2019-2031
- 14.1. Market Analysis, Insights and Forecast - By Country/Sub-region
- 14.1.1.
- 15. Competitive Analysis
- 15.1. Global Market Share Analysis 2024
- 15.2. Company Profiles
- 15.2.1 GDS
- 15.2.1.1. Overview
- 15.2.1.2. Products
- 15.2.1.3. SWOT Analysis
- 15.2.1.4. Recent Developments
- 15.2.1.5. Financials (Based on Availability)
- 15.2.2 KDDI Telehouse
- 15.2.2.1. Overview
- 15.2.2.2. Products
- 15.2.2.3. SWOT Analysis
- 15.2.2.4. Recent Developments
- 15.2.2.5. Financials (Based on Availability)
- 15.2.3 Princeton Digital Group
- 15.2.3.1. Overview
- 15.2.3.2. Products
- 15.2.3.3. SWOT Analysis
- 15.2.3.4. Recent Developments
- 15.2.3.5. Financials (Based on Availability)
- 15.2.4 China Telecom Corporation Ltd
- 15.2.4.1. Overview
- 15.2.4.2. Products
- 15.2.4.3. SWOT Analysis
- 15.2.4.4. Recent Developments
- 15.2.4.5. Financials (Based on Availability)
- 15.2.5 Equinix
- 15.2.5.1. Overview
- 15.2.5.2. Products
- 15.2.5.3. SWOT Analysis
- 15.2.5.4. Recent Developments
- 15.2.5.5. Financials (Based on Availability)
- 15.2.6 Chayora Lt
- 15.2.6.1. Overview
- 15.2.6.2. Products
- 15.2.6.3. SWOT Analysis
- 15.2.6.4. Recent Developments
- 15.2.6.5. Financials (Based on Availability)
- 15.2.7 NTT Ltd
- 15.2.7.1. Overview
- 15.2.7.2. Products
- 15.2.7.3. SWOT Analysis
- 15.2.7.4. Recent Developments
- 15.2.7.5. Financials (Based on Availability)
- 15.2.1 GDS
List of Figures
- Figure 1: Global Shanghai Data Center Market Revenue Breakdown (Million, %) by Region 2024 & 2032
- Figure 2: North America Shanghai Data Center Market Revenue (Million), by Country 2024 & 2032
- Figure 3: North America Shanghai Data Center Market Revenue Share (%), by Country 2024 & 2032
- Figure 4: Europe Shanghai Data Center Market Revenue (Million), by Country 2024 & 2032
- Figure 5: Europe Shanghai Data Center Market Revenue Share (%), by Country 2024 & 2032
- Figure 6: Asia Pacific Shanghai Data Center Market Revenue (Million), by Country 2024 & 2032
- Figure 7: Asia Pacific Shanghai Data Center Market Revenue Share (%), by Country 2024 & 2032
- Figure 8: Rest of the World Shanghai Data Center Market Revenue (Million), by Country 2024 & 2032
- Figure 9: Rest of the World Shanghai Data Center Market Revenue Share (%), by Country 2024 & 2032
- Figure 10: North America Shanghai Data Center Market Revenue (Million), by DC Size 2024 & 2032
- Figure 11: North America Shanghai Data Center Market Revenue Share (%), by DC Size 2024 & 2032
- Figure 12: North America Shanghai Data Center Market Revenue (Million), by Tier Type 2024 & 2032
- Figure 13: North America Shanghai Data Center Market Revenue Share (%), by Tier Type 2024 & 2032
- Figure 14: North America Shanghai Data Center Market Revenue (Million), by Absorption 2024 & 2032
- Figure 15: North America Shanghai Data Center Market Revenue Share (%), by Absorption 2024 & 2032
- Figure 16: North America Shanghai Data Center Market Revenue (Million), by Country 2024 & 2032
- Figure 17: North America Shanghai Data Center Market Revenue Share (%), by Country 2024 & 2032
- Figure 18: South America Shanghai Data Center Market Revenue (Million), by DC Size 2024 & 2032
- Figure 19: South America Shanghai Data Center Market Revenue Share (%), by DC Size 2024 & 2032
- Figure 20: South America Shanghai Data Center Market Revenue (Million), by Tier Type 2024 & 2032
- Figure 21: South America Shanghai Data Center Market Revenue Share (%), by Tier Type 2024 & 2032
- Figure 22: South America Shanghai Data Center Market Revenue (Million), by Absorption 2024 & 2032
- Figure 23: South America Shanghai Data Center Market Revenue Share (%), by Absorption 2024 & 2032
- Figure 24: South America Shanghai Data Center Market Revenue (Million), by Country 2024 & 2032
- Figure 25: South America Shanghai Data Center Market Revenue Share (%), by Country 2024 & 2032
- Figure 26: Europe Shanghai Data Center Market Revenue (Million), by DC Size 2024 & 2032
- Figure 27: Europe Shanghai Data Center Market Revenue Share (%), by DC Size 2024 & 2032
- Figure 28: Europe Shanghai Data Center Market Revenue (Million), by Tier Type 2024 & 2032
- Figure 29: Europe Shanghai Data Center Market Revenue Share (%), by Tier Type 2024 & 2032
- Figure 30: Europe Shanghai Data Center Market Revenue (Million), by Absorption 2024 & 2032
- Figure 31: Europe Shanghai Data Center Market Revenue Share (%), by Absorption 2024 & 2032
- Figure 32: Europe Shanghai Data Center Market Revenue (Million), by Country 2024 & 2032
- Figure 33: Europe Shanghai Data Center Market Revenue Share (%), by Country 2024 & 2032
- Figure 34: Middle East & Africa Shanghai Data Center Market Revenue (Million), by DC Size 2024 & 2032
- Figure 35: Middle East & Africa Shanghai Data Center Market Revenue Share (%), by DC Size 2024 & 2032
- Figure 36: Middle East & Africa Shanghai Data Center Market Revenue (Million), by Tier Type 2024 & 2032
- Figure 37: Middle East & Africa Shanghai Data Center Market Revenue Share (%), by Tier Type 2024 & 2032
- Figure 38: Middle East & Africa Shanghai Data Center Market Revenue (Million), by Absorption 2024 & 2032
- Figure 39: Middle East & Africa Shanghai Data Center Market Revenue Share (%), by Absorption 2024 & 2032
- Figure 40: Middle East & Africa Shanghai Data Center Market Revenue (Million), by Country 2024 & 2032
- Figure 41: Middle East & Africa Shanghai Data Center Market Revenue Share (%), by Country 2024 & 2032
- Figure 42: Asia Pacific Shanghai Data Center Market Revenue (Million), by DC Size 2024 & 2032
- Figure 43: Asia Pacific Shanghai Data Center Market Revenue Share (%), by DC Size 2024 & 2032
- Figure 44: Asia Pacific Shanghai Data Center Market Revenue (Million), by Tier Type 2024 & 2032
- Figure 45: Asia Pacific Shanghai Data Center Market Revenue Share (%), by Tier Type 2024 & 2032
- Figure 46: Asia Pacific Shanghai Data Center Market Revenue (Million), by Absorption 2024 & 2032
- Figure 47: Asia Pacific Shanghai Data Center Market Revenue Share (%), by Absorption 2024 & 2032
- Figure 48: Asia Pacific Shanghai Data Center Market Revenue (Million), by Country 2024 & 2032
- Figure 49: Asia Pacific Shanghai Data Center Market Revenue Share (%), by Country 2024 & 2032
List of Tables
- Table 1: Global Shanghai Data Center Market Revenue Million Forecast, by Region 2019 & 2032
- Table 2: Global Shanghai Data Center Market Revenue Million Forecast, by DC Size 2019 & 2032
- Table 3: Global Shanghai Data Center Market Revenue Million Forecast, by Tier Type 2019 & 2032
- Table 4: Global Shanghai Data Center Market Revenue Million Forecast, by Absorption 2019 & 2032
- Table 5: Global Shanghai Data Center Market Revenue Million Forecast, by Region 2019 & 2032
- Table 6: Global Shanghai Data Center Market Revenue Million Forecast, by Country 2019 & 2032
- Table 7: Shanghai Data Center Market Revenue (Million) Forecast, by Application 2019 & 2032
- Table 8: Global Shanghai Data Center Market Revenue Million Forecast, by Country 2019 & 2032
- Table 9: Shanghai Data Center Market Revenue (Million) Forecast, by Application 2019 & 2032
- Table 10: Global Shanghai Data Center Market Revenue Million Forecast, by Country 2019 & 2032
- Table 11: Shanghai Data Center Market Revenue (Million) Forecast, by Application 2019 & 2032
- Table 12: Global Shanghai Data Center Market Revenue Million Forecast, by Country 2019 & 2032
- Table 13: Shanghai Data Center Market Revenue (Million) Forecast, by Application 2019 & 2032
- Table 14: Global Shanghai Data Center Market Revenue Million Forecast, by DC Size 2019 & 2032
- Table 15: Global Shanghai Data Center Market Revenue Million Forecast, by Tier Type 2019 & 2032
- Table 16: Global Shanghai Data Center Market Revenue Million Forecast, by Absorption 2019 & 2032
- Table 17: Global Shanghai Data Center Market Revenue Million Forecast, by Country 2019 & 2032
- Table 18: United States Shanghai Data Center Market Revenue (Million) Forecast, by Application 2019 & 2032
- Table 19: Canada Shanghai Data Center Market Revenue (Million) Forecast, by Application 2019 & 2032
- Table 20: Mexico Shanghai Data Center Market Revenue (Million) Forecast, by Application 2019 & 2032
- Table 21: Global Shanghai Data Center Market Revenue Million Forecast, by DC Size 2019 & 2032
- Table 22: Global Shanghai Data Center Market Revenue Million Forecast, by Tier Type 2019 & 2032
- Table 23: Global Shanghai Data Center Market Revenue Million Forecast, by Absorption 2019 & 2032
- Table 24: Global Shanghai Data Center Market Revenue Million Forecast, by Country 2019 & 2032
- Table 25: Brazil Shanghai Data Center Market Revenue (Million) Forecast, by Application 2019 & 2032
- Table 26: Argentina Shanghai Data Center Market Revenue (Million) Forecast, by Application 2019 & 2032
- Table 27: Rest of South America Shanghai Data Center Market Revenue (Million) Forecast, by Application 2019 & 2032
- Table 28: Global Shanghai Data Center Market Revenue Million Forecast, by DC Size 2019 & 2032
- Table 29: Global Shanghai Data Center Market Revenue Million Forecast, by Tier Type 2019 & 2032
- Table 30: Global Shanghai Data Center Market Revenue Million Forecast, by Absorption 2019 & 2032
- Table 31: Global Shanghai Data Center Market Revenue Million Forecast, by Country 2019 & 2032
- Table 32: United Kingdom Shanghai Data Center Market Revenue (Million) Forecast, by Application 2019 & 2032
- Table 33: Germany Shanghai Data Center Market Revenue (Million) Forecast, by Application 2019 & 2032
- Table 34: France Shanghai Data Center Market Revenue (Million) Forecast, by Application 2019 & 2032
- Table 35: Italy Shanghai Data Center Market Revenue (Million) Forecast, by Application 2019 & 2032
- Table 36: Spain Shanghai Data Center Market Revenue (Million) Forecast, by Application 2019 & 2032
- Table 37: Russia Shanghai Data Center Market Revenue (Million) Forecast, by Application 2019 & 2032
- Table 38: Benelux Shanghai Data Center Market Revenue (Million) Forecast, by Application 2019 & 2032
- Table 39: Nordics Shanghai Data Center Market Revenue (Million) Forecast, by Application 2019 & 2032
- Table 40: Rest of Europe Shanghai Data Center Market Revenue (Million) Forecast, by Application 2019 & 2032
- Table 41: Global Shanghai Data Center Market Revenue Million Forecast, by DC Size 2019 & 2032
- Table 42: Global Shanghai Data Center Market Revenue Million Forecast, by Tier Type 2019 & 2032
- Table 43: Global Shanghai Data Center Market Revenue Million Forecast, by Absorption 2019 & 2032
- Table 44: Global Shanghai Data Center Market Revenue Million Forecast, by Country 2019 & 2032
- Table 45: Turkey Shanghai Data Center Market Revenue (Million) Forecast, by Application 2019 & 2032
- Table 46: Israel Shanghai Data Center Market Revenue (Million) Forecast, by Application 2019 & 2032
- Table 47: GCC Shanghai Data Center Market Revenue (Million) Forecast, by Application 2019 & 2032
- Table 48: North Africa Shanghai Data Center Market Revenue (Million) Forecast, by Application 2019 & 2032
- Table 49: South Africa Shanghai Data Center Market Revenue (Million) Forecast, by Application 2019 & 2032
- Table 50: Rest of Middle East & Africa Shanghai Data Center Market Revenue (Million) Forecast, by Application 2019 & 2032
- Table 51: Global Shanghai Data Center Market Revenue Million Forecast, by DC Size 2019 & 2032
- Table 52: Global Shanghai Data Center Market Revenue Million Forecast, by Tier Type 2019 & 2032
- Table 53: Global Shanghai Data Center Market Revenue Million Forecast, by Absorption 2019 & 2032
- Table 54: Global Shanghai Data Center Market Revenue Million Forecast, by Country 2019 & 2032
- Table 55: China Shanghai Data Center Market Revenue (Million) Forecast, by Application 2019 & 2032
- Table 56: India Shanghai Data Center Market Revenue (Million) Forecast, by Application 2019 & 2032
- Table 57: Japan Shanghai Data Center Market Revenue (Million) Forecast, by Application 2019 & 2032
- Table 58: South Korea Shanghai Data Center Market Revenue (Million) Forecast, by Application 2019 & 2032
- Table 59: ASEAN Shanghai Data Center Market Revenue (Million) Forecast, by Application 2019 & 2032
- Table 60: Oceania Shanghai Data Center Market Revenue (Million) Forecast, by Application 2019 & 2032
- Table 61: Rest of Asia Pacific Shanghai Data Center Market Revenue (Million) Forecast, by Application 2019 & 2032
Frequently Asked Questions
1. What is the projected Compound Annual Growth Rate (CAGR) of the Shanghai Data Center Market?
The projected CAGR is approximately 10.40%.
2. Which companies are prominent players in the Shanghai Data Center Market?
Key companies in the market include GDS, KDDI Telehouse, Princeton Digital Group, China Telecom Corporation Ltd, Equinix, Chayora Lt, NTT Ltd.
3. What are the main segments of the Shanghai Data Center Market?
The market segments include DC Size, Tier Type, Absorption.
4. Can you provide details about the market size?
The market size is estimated to be USD XX Million as of 2022.
5. What are some drivers contributing to market growth?
Continuous roll out of 5G; Growth of high-quality defensive companies; Demand for new digital services.
6. What are the notable trends driving market growth?
Increasing cloud and colocation services are anticipated to drive the growth of data center market in the Shanghai..
7. Are there any restraints impacting market growth?
High Cost of Satellite Imaging Data Acquisition and Processing; High-resolution Images Offered by Other Imaging Technologies.
8. Can you provide examples of recent developments in the market?
N/A
9. What pricing options are available for accessing the report?
Pricing options include single-user, multi-user, and enterprise licenses priced at USD 3800, USD 4500, and USD 5800 respectively.
10. Is the market size provided in terms of value or volume?
The market size is provided in terms of value, measured in Million.
11. Are there any specific market keywords associated with the report?
Yes, the market keyword associated with the report is "Shanghai Data Center Market," which aids in identifying and referencing the specific market segment covered.
12. How do I determine which pricing option suits my needs best?
The pricing options vary based on user requirements and access needs. Individual users may opt for single-user licenses, while businesses requiring broader access may choose multi-user or enterprise licenses for cost-effective access to the report.
13. Are there any additional resources or data provided in the Shanghai Data Center Market report?
While the report offers comprehensive insights, it's advisable to review the specific contents or supplementary materials provided to ascertain if additional resources or data are available.
14. How can I stay updated on further developments or reports in the Shanghai Data Center Market?
To stay informed about further developments, trends, and reports in the Shanghai Data Center Market, consider subscribing to industry newsletters, following relevant companies and organizations, or regularly checking reputable industry news sources and publications.
Methodology
Step 1 - Identification of Relevant Samples Size from Population Database


Step 2 - Approaches for Defining Global Market Size (Value, Volume* & Price*)

Note*: In applicable scenarios
Step 3 - Data Sources
Primary Research
- Web Analytics
- Survey Reports
- Research Institute
- Latest Research Reports
- Opinion Leaders
Secondary Research
- Annual Reports
- White Paper
- Latest Press Release
- Industry Association
- Paid Database
- Investor Presentations

Step 4 - Data Triangulation
Involves using different sources of information in order to increase the validity of a study
These sources are likely to be stakeholders in a program - participants, other researchers, program staff, other community members, and so on.
Then we put all data in single framework & apply various statistical tools to find out the dynamic on the market.
During the analysis stage, feedback from the stakeholder groups would be compared to determine areas of agreement as well as areas of divergence
