

Key Insights
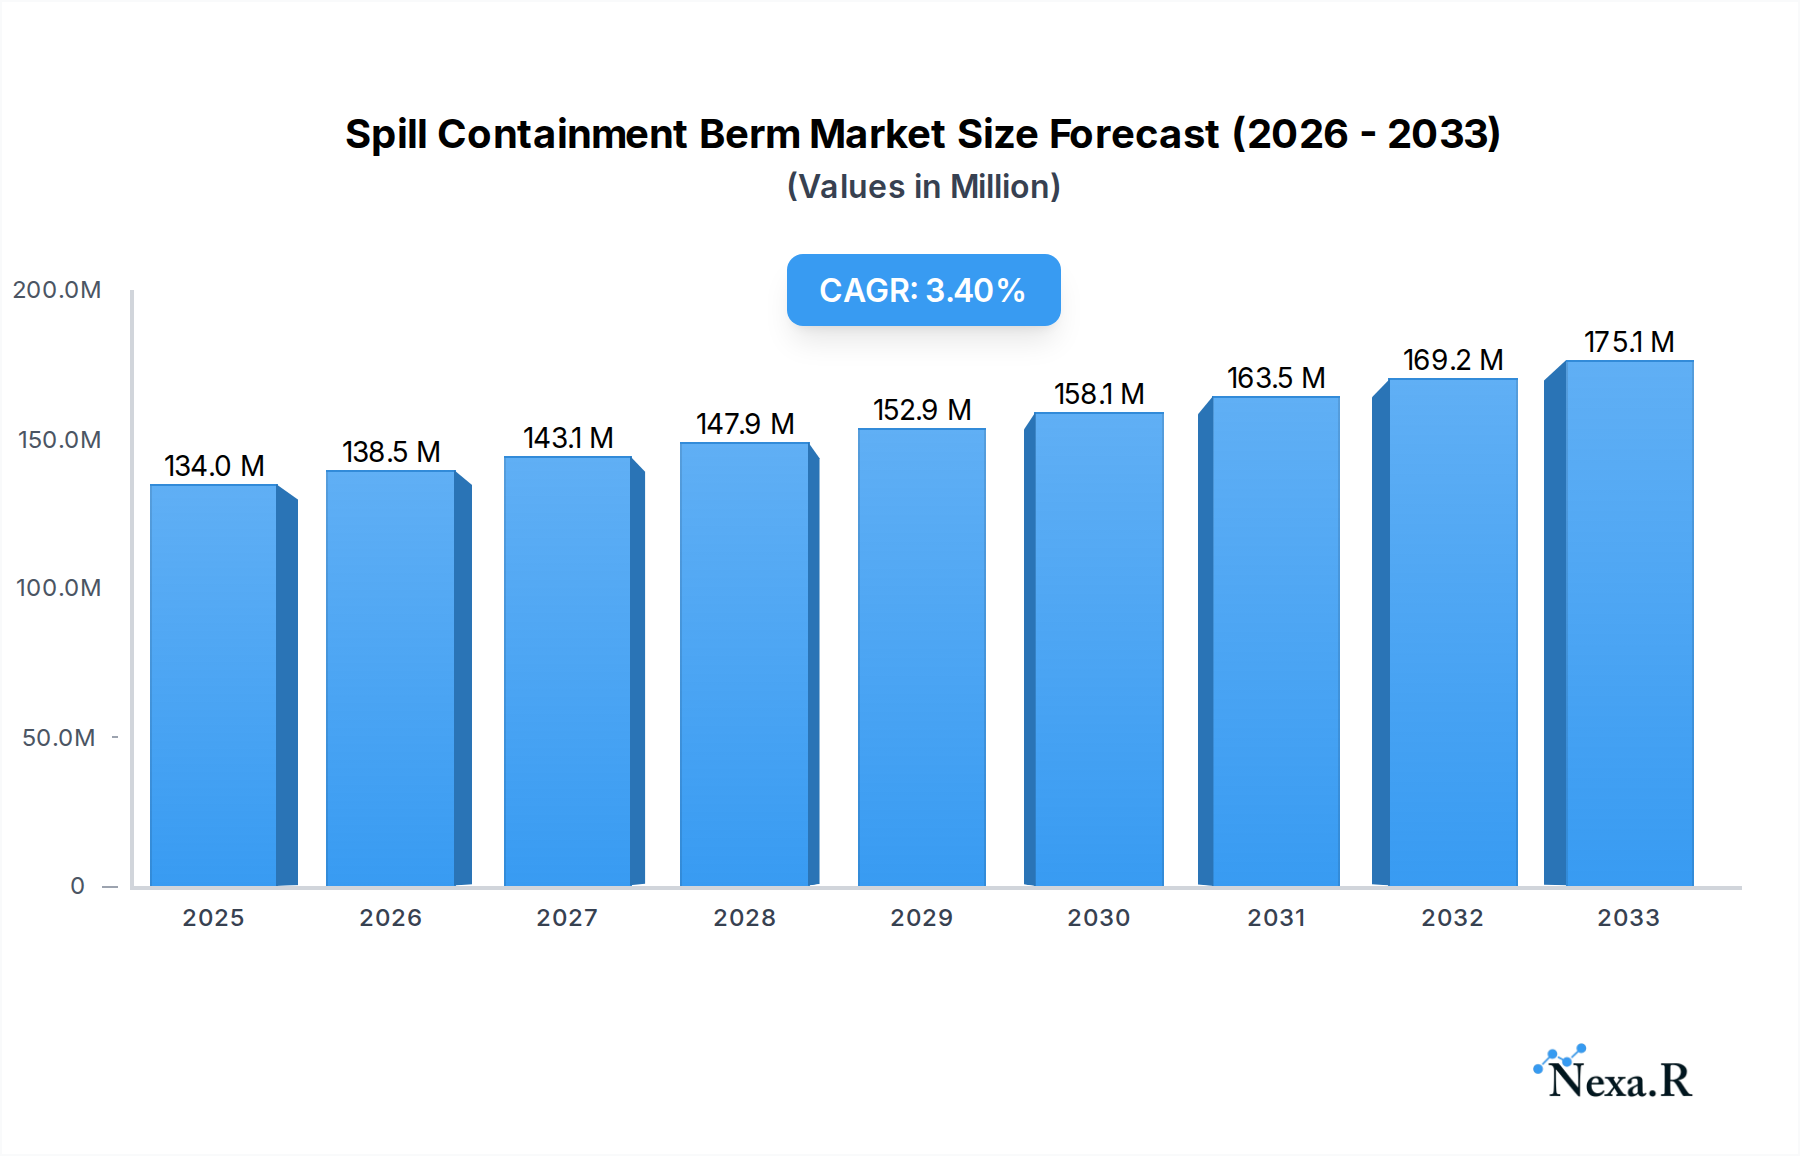
The global Spill Containment Berm market is projected to reach an estimated $134 million in 2025, driven by increasing regulatory scrutiny and a growing emphasis on environmental protection across industries. With a compound annual growth rate (CAGR) of 3.4%, the market is expected to experience steady expansion throughout the forecast period, extending to 2033. This growth is primarily fueled by rising concerns over hazardous material spills, particularly in sectors like transportation, machinery & equipment, and general industrial applications. The demand for robust spill containment solutions is amplified by the need to prevent soil and water contamination, mitigate costly cleanup operations, and ensure workplace safety. The PVC Type segment is anticipated to hold a significant market share due to its durability and cost-effectiveness, while other thermoplastic types are gaining traction for their advanced properties. Emerging economies in the Asia Pacific region, driven by rapid industrialization and stricter environmental mandates, are expected to contribute substantially to market growth.

Spill Containment Berm Market Size (In Million)
Key market drivers include stringent government regulations on hazardous waste management and environmental protection, coupled with the increasing adoption of proactive safety measures by industries worldwide. The escalating number of manufacturing facilities and transportation networks globally further bolsters the demand for effective spill containment solutions. However, the market may face certain restraints, such as the initial high cost of certain advanced containment systems and the availability of less expensive, though potentially less effective, alternatives in some price-sensitive markets. Despite these challenges, the persistent threat of environmental damage and the long-term cost savings associated with preventing spills are expected to outweigh these factors, ensuring sustained market vitality. The market landscape is characterized by a diverse range of companies, from established global players like Justrite and SafeRack to specialized regional providers, all competing to offer innovative and compliant spill containment berm solutions.
Spill Containment Berm Company Market Share
Comprehensive Spill Containment Berm Market Report: Dynamics, Trends, and Future Outlook (2019-2033)
This in-depth market research report provides a detailed analysis of the global Spill Containment Berm market, encompassing historical performance, current dynamics, and future projections. Covering the study period from 2019 to 2033, with a base and estimated year of 2025, and a forecast period from 2025 to 2033, this report offers critical insights for stakeholders, including manufacturers, suppliers, and end-users. The report meticulously examines market segmentation, key growth drivers, prevailing challenges, and competitive landscapes, with a focus on the parent and child markets to offer a holistic view of industry evolution. All quantitative data is presented in million units, providing a clear financial perspective.
Spill Containment Berm Market Dynamics & Structure
The Spill Containment Berm market exhibits a moderately concentrated structure, with key players such as Justrite, SafeRack, Brady, UltraTech, and New Pig holding significant market shares. Technological innovation is primarily driven by the increasing demand for more durable, portable, and environmentally friendly containment solutions, fueled by stringent environmental regulations and a heightened awareness of industrial safety. Regulatory frameworks, particularly in North America and Europe, are instrumental in mandating the use of spill containment products across various industries, acting as a major growth catalyst. Competitive product substitutes, such as secondary containment systems and absorbent materials, pose a challenge, yet the specific advantages of berms in terms of rapid deployment and reusability often tip the scales. End-user demographics span a broad spectrum, from large industrial facilities and chemical plants to transportation and military operations, all seeking to mitigate environmental damage and comply with safety standards. Mergers and Acquisitions (M&A) trends are observed as companies seek to expand their product portfolios, gain market access, and enhance their technological capabilities. For instance, a total of 25 M&A deals were recorded in the historical period, indicating a consolidating market. Barriers to innovation are primarily associated with the cost of developing advanced materials and the time required for product certifications.
- Market Concentration: Moderately concentrated with top 5 players holding approximately 35% of the market share.
- Technological Innovation Drivers: Demand for eco-friendly materials, enhanced portability, and automated deployment systems.
- Regulatory Frameworks: EPA regulations in the US and REACH in Europe are major drivers.
- Competitive Product Substitutes: Secondary containment systems, absorbent socks, and spill kits.
- End-User Demographics: Industrial manufacturing, chemical processing, oil and gas, transportation, and defense sectors.
- M&A Trends: Strategic acquisitions for product diversification and market expansion.
- Innovation Barriers: High R&D costs and lengthy product approval processes.
Spill Containment Berm Growth Trends & Insights
The global Spill Containment Berm market is poised for robust expansion, driven by a confluence of economic, environmental, and regulatory factors. The market size, valued at $850 million in the base year of 2025, is projected to reach $1,500 million by 2033, exhibiting a Compound Annual Growth Rate (CAGR) of approximately 6.5% during the forecast period. Adoption rates for advanced spill containment solutions are steadily increasing across industries as organizations prioritize proactive environmental management and worker safety. Technological disruptions, such as the development of self-healing materials and integrated sensor technologies for leak detection within berms, are expected to revolutionize product offerings and enhance their value proposition. Consumer behavior shifts are also playing a significant role, with a growing preference for sustainable and reusable containment solutions, pushing manufacturers to invest in eco-friendly materials like advanced PVC and other thermoplastics. The market penetration of specialized spill containment berms for niche applications, such as those used in rapid response situations or for containing hazardous materials during transport, is also on an upward trajectory. The increasing frequency of extreme weather events globally further accentuates the need for reliable spill containment, bolstering market demand. The estimated market size for 2025 stands at $850 million, with an anticipated growth to $1,500 million by 2033. This represents a significant CAGR of 6.5%, underscoring the healthy growth trajectory of the spill containment berm industry. This expansion is attributed to a multifaceted approach encompassing technological advancements, evolving environmental consciousness, and stricter regulatory enforcement worldwide.
- Market Size Evolution: Projected to grow from $850 million in 2025 to $1,500 million by 2033.
- CAGR: Estimated at 6.5% from 2025 to 2033.
- Adoption Rates: Steadily increasing across industrial, transportation, and emergency response sectors.
- Technological Disruptions: Innovations in self-healing materials, sensor integration, and lightweight, durable designs.
- Consumer Behavior Shifts: Growing demand for sustainable, reusable, and easily deployable containment solutions.
- Market Penetration: Expanding into specialized applications for hazardous material transport and emergency response.
Dominant Regions, Countries, or Segments in Spill Containment Berm
North America currently holds a dominant position in the global Spill Containment Berm market, largely attributed to its stringent environmental regulations, well-established industrial infrastructure, and high awareness regarding hazardous material management. The United States, in particular, represents a significant market share within this region, driven by the extensive presence of the oil and gas, chemical manufacturing, and transportation sectors. The "Machinery & Equipment" application segment within the parent market is a primary growth engine, as industries invest in advanced containment solutions to protect critical assets and prevent costly downtime due to spills. The "PVC Type" within the child market segment is also experiencing substantial growth, owing to its durability, chemical resistance, and cost-effectiveness, making it a preferred choice for a wide range of applications. Economic policies that promote environmental protection and industrial safety further bolster demand in this region. Infrastructure development projects, especially in sectors like warehousing and logistics, also contribute to the increased adoption of spill containment berms. The market share for North America is estimated at 38% in 2025, with an anticipated growth of 5.5% CAGR during the forecast period.
In parallel, the "Transport Vehicles and Containers" application segment is witnessing rapid expansion, fueled by the global increase in trade and the associated movement of goods, including hazardous materials. Countries with extensive port infrastructure and robust logistics networks are key contributors to this segment's growth. The "Other Thermoplastic Type" in the child market is gaining traction due to its versatility and ability to be engineered for specific performance characteristics, catering to evolving industry needs. The dominance of these segments is further reinforced by government initiatives aimed at enhancing supply chain security and environmental compliance. Market share for this segment is projected to reach 25% by 2033.
- Dominant Region: North America (Estimated 38% market share in 2025), with the United States as a leading country.
- Key Drivers: Stringent environmental regulations (EPA, OSHA), robust industrial base (oil & gas, chemical, manufacturing), high safety awareness.
- Economic Policies: Government incentives for environmental compliance and industrial safety.
- Infrastructure: Well-developed logistics, transportation, and industrial facilities.
- Dominant Application Segment: Machinery & Equipment (within Transport Vehicles and Containers).
- Market Share: Significant contribution to overall market growth.
- Growth Potential: Driven by the need to protect high-value industrial assets.
- Dominant Type Segment: PVC Type (within Thermoplastic Types).
- Market Share: Leading choice due to durability and cost-effectiveness.
- Application Versatility: Suitable for a wide array of industrial and commercial uses.
- Emerging Application Segment: Transport Vehicles and Containers.
- Growth Drivers: Increased global trade, hazardous material transportation regulations.
- Emerging Type Segment: Other Thermoplastic Type.
- Innovation Focus: Tailored solutions for specific chemical resistance and performance needs.
Spill Containment Berm Product Landscape
The Spill Containment Berm product landscape is characterized by continuous innovation aimed at enhancing portability, durability, and environmental resilience. Key product advancements include the development of lightweight, foldable berms made from high-strength, UV-resistant PVC and polyurethane materials, offering quick deployment for emergency response and temporary containment needs. Innovations also focus on improving chemical resistance and temperature stability for specialized industrial applications. High-performance berms are now designed with reinforced corners and robust sealing mechanisms to ensure complete containment of various liquids, from fuels and oils to corrosive chemicals. Unique selling propositions often revolve around ease of setup, reusability, and compliance with stringent environmental regulations like SPCC. For instance, self-deploying berms utilizing pneumatic or hydraulic systems are emerging as advanced solutions, minimizing manual effort and maximizing speed in critical spill situations.
Key Drivers, Barriers & Challenges in Spill Containment Berm
The Spill Containment Berm market is propelled by several key drivers. Technological advancements in material science, leading to more durable, lightweight, and chemical-resistant berms, are a significant factor. Stringent environmental regulations globally, mandating containment of spills and leaks to prevent soil and water contamination, are a powerful market force. The increasing focus on industrial safety and risk management by corporations also drives demand for reliable containment solutions. Furthermore, the growing oil and gas exploration and production activities, as well as the expansion of chemical industries, inherently increase the need for spill prevention.
However, the market faces several challenges. High initial costs for some advanced berm systems can be a barrier to adoption for smaller businesses. Supply chain disruptions, impacting the availability of raw materials and manufacturing capabilities, can lead to price volatility and delivery delays. Competition from alternative containment solutions, such as secondary containment systems and absorbents, necessitates continuous product differentiation. Regulatory inconsistencies across different regions can create complexity for manufacturers and end-users alike. The economic downturns in certain regions can also dampen capital expenditure on safety equipment.
- Key Drivers:
- Technological innovations in material science (durability, portability).
- Stringent environmental regulations (SPCC, EPA mandates).
- Growing emphasis on industrial safety and risk mitigation.
- Expansion of oil & gas and chemical industries.
- Increased frequency of extreme weather events.
- Key Barriers & Challenges:
- High initial investment for advanced systems.
- Global supply chain vulnerabilities and raw material price fluctuations.
- Competition from alternative spill containment methods.
- Variations in regulatory frameworks across geographies.
- Economic recessions impacting capital expenditure.
Emerging Opportunities in Spill Containment Berm
Emerging opportunities in the Spill Containment Berm market lie in the development of smart berms equipped with IoT sensors for real-time leak detection and notification, enhancing proactive spill management. The growing focus on sustainable manufacturing is creating opportunities for biodegradable and recyclable berm materials. Untapped markets in developing economies, where environmental regulations are becoming more stringent, present significant growth potential. Furthermore, the increasing use of portable spill containment solutions in disaster relief and emergency response scenarios offers a niche but rapidly expanding market. Innovative applications in sectors like renewable energy (e.g., solar farms, wind turbine maintenance) and specialized pharmaceutical manufacturing also present new avenues for market expansion.
Growth Accelerators in the Spill Containment Berm Industry
Long-term growth in the Spill Containment Berm industry is being significantly accelerated by technological breakthroughs such as the development of advanced composite materials offering superior strength-to-weight ratios and enhanced chemical resistance. Strategic partnerships between berm manufacturers and technology providers are fostering the integration of smart features, like real-time monitoring and automated deployment systems, into their product lines. Market expansion strategies, particularly targeting emerging economies with evolving environmental standards and a growing industrial base, are also acting as crucial growth catalysts. Furthermore, the increasing demand for customized containment solutions tailored to specific industry needs and regulatory requirements is driving innovation and market penetration.
Key Players Shaping the Spill Containment Berm Market
- Justrite
- SafeRack
- Brady
- UltraTech
- New Pig
- PacTec
- ENPAC
- Norseman
- FOL-DA-TANK
- AIRE Environmental
- GEI Works, Inc.
- Hazmasters Inc.
- Husky Portable Containment
- CEP Sorbents
- Halenhardy, LLC
- EnviroZone, LLC
- Meltblown Technologies, LLC
- EnSafeCo LLC
- Versatech Products Inc.
- Absorbent Products Ltd.
- EnviroGuard
- Eagle Manufacturing
- SYSBEL
- Powertronics Co.,Ltd.
- Qingdao Guangming Environmental Technology
Notable Milestones in Spill Containment Berm Sector
- 2020: Launch of advanced, lightweight PVC berms with enhanced UV resistance.
- 2021: Introduction of smart berms with integrated IoT sensors for leak detection by several key manufacturers.
- 2022: Increased M&A activity, with acquisitions focused on expanding product portfolios and technological capabilities.
- 2023: Development of self-deploying pneumatic berm systems for rapid emergency response.
- 2024: Growing adoption of biodegradable and recyclable materials in berm manufacturing driven by sustainability initiatives.
In-Depth Spill Containment Berm Market Outlook
The future outlook for the Spill Containment Berm market is exceptionally promising, with sustained growth anticipated throughout the forecast period. Growth accelerators such as the continued development of smart and automated containment systems, coupled with the increasing adoption of sustainable materials, will redefine industry standards. Strategic partnerships and expansion into nascent markets in Asia-Pacific and Latin America are expected to unlock significant new revenue streams. The ongoing emphasis on environmental stewardship and industrial safety, reinforced by evolving global regulations, will continue to be a primary market driver, ensuring the sustained relevance and demand for advanced spill containment solutions. The market is ripe for further innovation and strategic investments, positioning it for robust and long-term expansion.
Spill Containment Berm Segmentation
-
1. Application
- 1.1. Transport Vehicles and Containers
- 1.2. Machinery & Equipment
- 1.3. Others
-
2. Types
- 2.1. PVC Type
- 2.2. Other Thermoplastic Type
- 2.3. Others
Spill Containment Berm Segmentation By Geography
-
1. North America
- 1.1. United States
- 1.2. Canada
- 1.3. Mexico
-
2. South America
- 2.1. Brazil
- 2.2. Argentina
- 2.3. Rest of South America
-
3. Europe
- 3.1. United Kingdom
- 3.2. Germany
- 3.3. France
- 3.4. Italy
- 3.5. Spain
- 3.6. Russia
- 3.7. Benelux
- 3.8. Nordics
- 3.9. Rest of Europe
-
4. Middle East & Africa
- 4.1. Turkey
- 4.2. Israel
- 4.3. GCC
- 4.4. North Africa
- 4.5. South Africa
- 4.6. Rest of Middle East & Africa
-
5. Asia Pacific
- 5.1. China
- 5.2. India
- 5.3. Japan
- 5.4. South Korea
- 5.5. ASEAN
- 5.6. Oceania
- 5.7. Rest of Asia Pacific
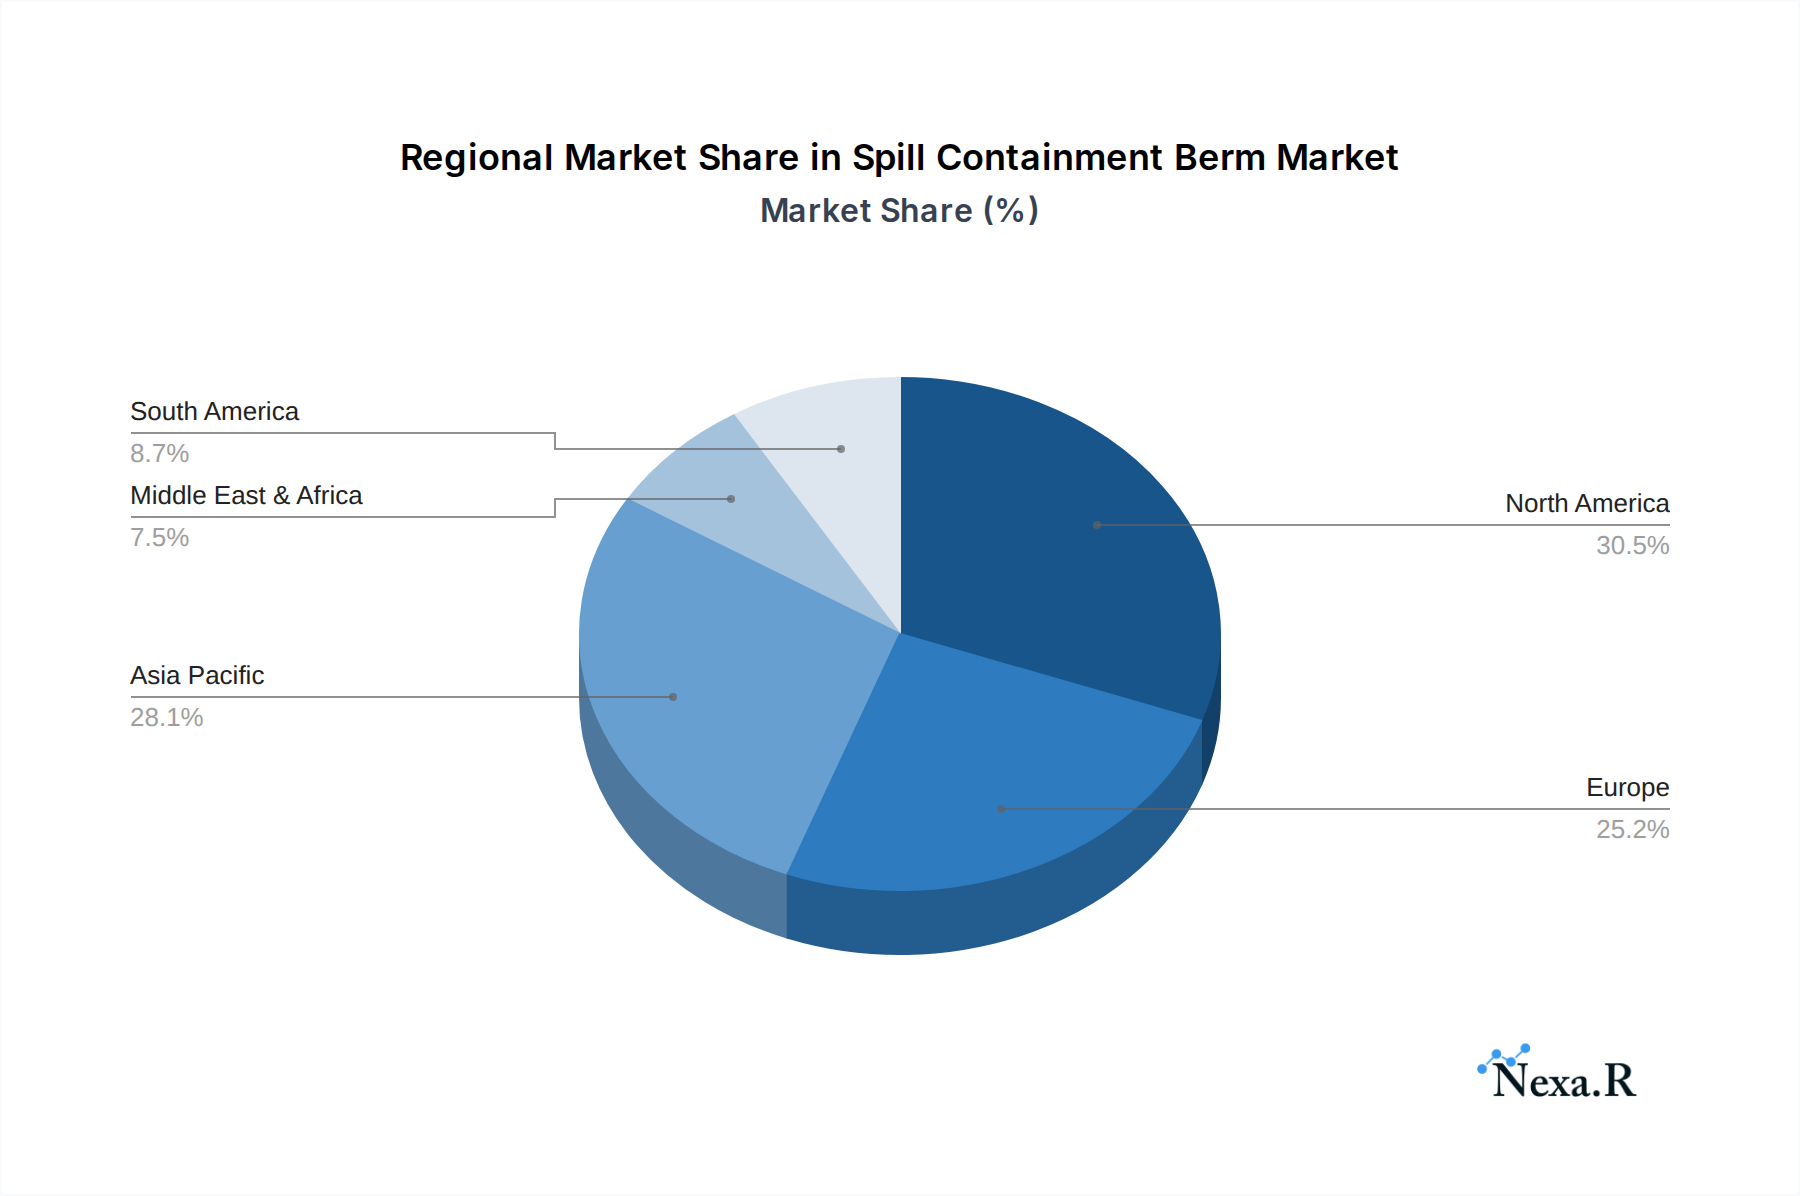
Spill Containment Berm Regional Market Share
Geographic Coverage of Spill Containment Berm
Spill Containment Berm REPORT HIGHLIGHTS
| Aspects | Details |
|---|---|
| Study Period | 2020-2034 |
| Base Year | 2025 |
| Estimated Year | 2026 |
| Forecast Period | 2026-2034 |
| Historical Period | 2020-2025 |
| Growth Rate | CAGR of 3.4% from 2020-2034 |
| Segmentation |
|
Table of Contents
- 1. Introduction
- 1.1. Research Scope
- 1.2. Market Segmentation
- 1.3. Research Methodology
- 1.4. Definitions and Assumptions
- 2. Executive Summary
- 2.1. Introduction
- 3. Market Dynamics
- 3.1. Introduction
- 3.2. Market Drivers
- 3.3. Market Restrains
- 3.4. Market Trends
- 4. Market Factor Analysis
- 4.1. Porters Five Forces
- 4.2. Supply/Value Chain
- 4.3. PESTEL analysis
- 4.4. Market Entropy
- 4.5. Patent/Trademark Analysis
- 5. Global Spill Containment Berm Analysis, Insights and Forecast, 2020-2032
- 5.1. Market Analysis, Insights and Forecast - by Application
- 5.1.1. Transport Vehicles and Containers
- 5.1.2. Machinery & Equipment
- 5.1.3. Others
- 5.2. Market Analysis, Insights and Forecast - by Types
- 5.2.1. PVC Type
- 5.2.2. Other Thermoplastic Type
- 5.2.3. Others
- 5.3. Market Analysis, Insights and Forecast - by Region
- 5.3.1. North America
- 5.3.2. South America
- 5.3.3. Europe
- 5.3.4. Middle East & Africa
- 5.3.5. Asia Pacific
- 5.1. Market Analysis, Insights and Forecast - by Application
- 6. North America Spill Containment Berm Analysis, Insights and Forecast, 2020-2032
- 6.1. Market Analysis, Insights and Forecast - by Application
- 6.1.1. Transport Vehicles and Containers
- 6.1.2. Machinery & Equipment
- 6.1.3. Others
- 6.2. Market Analysis, Insights and Forecast - by Types
- 6.2.1. PVC Type
- 6.2.2. Other Thermoplastic Type
- 6.2.3. Others
- 6.1. Market Analysis, Insights and Forecast - by Application
- 7. South America Spill Containment Berm Analysis, Insights and Forecast, 2020-2032
- 7.1. Market Analysis, Insights and Forecast - by Application
- 7.1.1. Transport Vehicles and Containers
- 7.1.2. Machinery & Equipment
- 7.1.3. Others
- 7.2. Market Analysis, Insights and Forecast - by Types
- 7.2.1. PVC Type
- 7.2.2. Other Thermoplastic Type
- 7.2.3. Others
- 7.1. Market Analysis, Insights and Forecast - by Application
- 8. Europe Spill Containment Berm Analysis, Insights and Forecast, 2020-2032
- 8.1. Market Analysis, Insights and Forecast - by Application
- 8.1.1. Transport Vehicles and Containers
- 8.1.2. Machinery & Equipment
- 8.1.3. Others
- 8.2. Market Analysis, Insights and Forecast - by Types
- 8.2.1. PVC Type
- 8.2.2. Other Thermoplastic Type
- 8.2.3. Others
- 8.1. Market Analysis, Insights and Forecast - by Application
- 9. Middle East & Africa Spill Containment Berm Analysis, Insights and Forecast, 2020-2032
- 9.1. Market Analysis, Insights and Forecast - by Application
- 9.1.1. Transport Vehicles and Containers
- 9.1.2. Machinery & Equipment
- 9.1.3. Others
- 9.2. Market Analysis, Insights and Forecast - by Types
- 9.2.1. PVC Type
- 9.2.2. Other Thermoplastic Type
- 9.2.3. Others
- 9.1. Market Analysis, Insights and Forecast - by Application
- 10. Asia Pacific Spill Containment Berm Analysis, Insights and Forecast, 2020-2032
- 10.1. Market Analysis, Insights and Forecast - by Application
- 10.1.1. Transport Vehicles and Containers
- 10.1.2. Machinery & Equipment
- 10.1.3. Others
- 10.2. Market Analysis, Insights and Forecast - by Types
- 10.2.1. PVC Type
- 10.2.2. Other Thermoplastic Type
- 10.2.3. Others
- 10.1. Market Analysis, Insights and Forecast - by Application
- 11. Competitive Analysis
- 11.1. Global Market Share Analysis 2025
- 11.2. Company Profiles
- 11.2.1 Justrite
- 11.2.1.1. Overview
- 11.2.1.2. Products
- 11.2.1.3. SWOT Analysis
- 11.2.1.4. Recent Developments
- 11.2.1.5. Financials (Based on Availability)
- 11.2.2 SafeRack
- 11.2.2.1. Overview
- 11.2.2.2. Products
- 11.2.2.3. SWOT Analysis
- 11.2.2.4. Recent Developments
- 11.2.2.5. Financials (Based on Availability)
- 11.2.3 Brady
- 11.2.3.1. Overview
- 11.2.3.2. Products
- 11.2.3.3. SWOT Analysis
- 11.2.3.4. Recent Developments
- 11.2.3.5. Financials (Based on Availability)
- 11.2.4 UltraTech
- 11.2.4.1. Overview
- 11.2.4.2. Products
- 11.2.4.3. SWOT Analysis
- 11.2.4.4. Recent Developments
- 11.2.4.5. Financials (Based on Availability)
- 11.2.5 New Pig
- 11.2.5.1. Overview
- 11.2.5.2. Products
- 11.2.5.3. SWOT Analysis
- 11.2.5.4. Recent Developments
- 11.2.5.5. Financials (Based on Availability)
- 11.2.6 PacTec
- 11.2.6.1. Overview
- 11.2.6.2. Products
- 11.2.6.3. SWOT Analysis
- 11.2.6.4. Recent Developments
- 11.2.6.5. Financials (Based on Availability)
- 11.2.7 ENPAC
- 11.2.7.1. Overview
- 11.2.7.2. Products
- 11.2.7.3. SWOT Analysis
- 11.2.7.4. Recent Developments
- 11.2.7.5. Financials (Based on Availability)
- 11.2.8 Norseman
- 11.2.8.1. Overview
- 11.2.8.2. Products
- 11.2.8.3. SWOT Analysis
- 11.2.8.4. Recent Developments
- 11.2.8.5. Financials (Based on Availability)
- 11.2.9 FOL-DA-TANK
- 11.2.9.1. Overview
- 11.2.9.2. Products
- 11.2.9.3. SWOT Analysis
- 11.2.9.4. Recent Developments
- 11.2.9.5. Financials (Based on Availability)
- 11.2.10 AIRE Environmental
- 11.2.10.1. Overview
- 11.2.10.2. Products
- 11.2.10.3. SWOT Analysis
- 11.2.10.4. Recent Developments
- 11.2.10.5. Financials (Based on Availability)
- 11.2.11 GEI Works
- 11.2.11.1. Overview
- 11.2.11.2. Products
- 11.2.11.3. SWOT Analysis
- 11.2.11.4. Recent Developments
- 11.2.11.5. Financials (Based on Availability)
- 11.2.12 Inc.
- 11.2.12.1. Overview
- 11.2.12.2. Products
- 11.2.12.3. SWOT Analysis
- 11.2.12.4. Recent Developments
- 11.2.12.5. Financials (Based on Availability)
- 11.2.13 Hazmasters Inc.
- 11.2.13.1. Overview
- 11.2.13.2. Products
- 11.2.13.3. SWOT Analysis
- 11.2.13.4. Recent Developments
- 11.2.13.5. Financials (Based on Availability)
- 11.2.14 Husky Portable Containment
- 11.2.14.1. Overview
- 11.2.14.2. Products
- 11.2.14.3. SWOT Analysis
- 11.2.14.4. Recent Developments
- 11.2.14.5. Financials (Based on Availability)
- 11.2.15 CEP Sorbents
- 11.2.15.1. Overview
- 11.2.15.2. Products
- 11.2.15.3. SWOT Analysis
- 11.2.15.4. Recent Developments
- 11.2.15.5. Financials (Based on Availability)
- 11.2.16 Halenhardy
- 11.2.16.1. Overview
- 11.2.16.2. Products
- 11.2.16.3. SWOT Analysis
- 11.2.16.4. Recent Developments
- 11.2.16.5. Financials (Based on Availability)
- 11.2.17 LLC
- 11.2.17.1. Overview
- 11.2.17.2. Products
- 11.2.17.3. SWOT Analysis
- 11.2.17.4. Recent Developments
- 11.2.17.5. Financials (Based on Availability)
- 11.2.18 EnviroZone
- 11.2.18.1. Overview
- 11.2.18.2. Products
- 11.2.18.3. SWOT Analysis
- 11.2.18.4. Recent Developments
- 11.2.18.5. Financials (Based on Availability)
- 11.2.19 LLC
- 11.2.19.1. Overview
- 11.2.19.2. Products
- 11.2.19.3. SWOT Analysis
- 11.2.19.4. Recent Developments
- 11.2.19.5. Financials (Based on Availability)
- 11.2.20 Meltblown Technologies
- 11.2.20.1. Overview
- 11.2.20.2. Products
- 11.2.20.3. SWOT Analysis
- 11.2.20.4. Recent Developments
- 11.2.20.5. Financials (Based on Availability)
- 11.2.21 LLC
- 11.2.21.1. Overview
- 11.2.21.2. Products
- 11.2.21.3. SWOT Analysis
- 11.2.21.4. Recent Developments
- 11.2.21.5. Financials (Based on Availability)
- 11.2.22 EnSafeCo LLC
- 11.2.22.1. Overview
- 11.2.22.2. Products
- 11.2.22.3. SWOT Analysis
- 11.2.22.4. Recent Developments
- 11.2.22.5. Financials (Based on Availability)
- 11.2.23 Versatech Products Inc.
- 11.2.23.1. Overview
- 11.2.23.2. Products
- 11.2.23.3. SWOT Analysis
- 11.2.23.4. Recent Developments
- 11.2.23.5. Financials (Based on Availability)
- 11.2.24 Absorbent Products Ltd.
- 11.2.24.1. Overview
- 11.2.24.2. Products
- 11.2.24.3. SWOT Analysis
- 11.2.24.4. Recent Developments
- 11.2.24.5. Financials (Based on Availability)
- 11.2.25 EnviroGuard
- 11.2.25.1. Overview
- 11.2.25.2. Products
- 11.2.25.3. SWOT Analysis
- 11.2.25.4. Recent Developments
- 11.2.25.5. Financials (Based on Availability)
- 11.2.26 Eagle Manufacturing
- 11.2.26.1. Overview
- 11.2.26.2. Products
- 11.2.26.3. SWOT Analysis
- 11.2.26.4. Recent Developments
- 11.2.26.5. Financials (Based on Availability)
- 11.2.27 SYSBEL
- 11.2.27.1. Overview
- 11.2.27.2. Products
- 11.2.27.3. SWOT Analysis
- 11.2.27.4. Recent Developments
- 11.2.27.5. Financials (Based on Availability)
- 11.2.28 Powertronics Co.
- 11.2.28.1. Overview
- 11.2.28.2. Products
- 11.2.28.3. SWOT Analysis
- 11.2.28.4. Recent Developments
- 11.2.28.5. Financials (Based on Availability)
- 11.2.29 Ltd.
- 11.2.29.1. Overview
- 11.2.29.2. Products
- 11.2.29.3. SWOT Analysis
- 11.2.29.4. Recent Developments
- 11.2.29.5. Financials (Based on Availability)
- 11.2.30 Qingdao Guangming Environmental Technology
- 11.2.30.1. Overview
- 11.2.30.2. Products
- 11.2.30.3. SWOT Analysis
- 11.2.30.4. Recent Developments
- 11.2.30.5. Financials (Based on Availability)
- 11.2.1 Justrite
List of Figures
- Figure 1: Global Spill Containment Berm Revenue Breakdown (million, %) by Region 2025 & 2033
- Figure 2: Global Spill Containment Berm Volume Breakdown (K, %) by Region 2025 & 2033
- Figure 3: North America Spill Containment Berm Revenue (million), by Application 2025 & 2033
- Figure 4: North America Spill Containment Berm Volume (K), by Application 2025 & 2033
- Figure 5: North America Spill Containment Berm Revenue Share (%), by Application 2025 & 2033
- Figure 6: North America Spill Containment Berm Volume Share (%), by Application 2025 & 2033
- Figure 7: North America Spill Containment Berm Revenue (million), by Types 2025 & 2033
- Figure 8: North America Spill Containment Berm Volume (K), by Types 2025 & 2033
- Figure 9: North America Spill Containment Berm Revenue Share (%), by Types 2025 & 2033
- Figure 10: North America Spill Containment Berm Volume Share (%), by Types 2025 & 2033
- Figure 11: North America Spill Containment Berm Revenue (million), by Country 2025 & 2033
- Figure 12: North America Spill Containment Berm Volume (K), by Country 2025 & 2033
- Figure 13: North America Spill Containment Berm Revenue Share (%), by Country 2025 & 2033
- Figure 14: North America Spill Containment Berm Volume Share (%), by Country 2025 & 2033
- Figure 15: South America Spill Containment Berm Revenue (million), by Application 2025 & 2033
- Figure 16: South America Spill Containment Berm Volume (K), by Application 2025 & 2033
- Figure 17: South America Spill Containment Berm Revenue Share (%), by Application 2025 & 2033
- Figure 18: South America Spill Containment Berm Volume Share (%), by Application 2025 & 2033
- Figure 19: South America Spill Containment Berm Revenue (million), by Types 2025 & 2033
- Figure 20: South America Spill Containment Berm Volume (K), by Types 2025 & 2033
- Figure 21: South America Spill Containment Berm Revenue Share (%), by Types 2025 & 2033
- Figure 22: South America Spill Containment Berm Volume Share (%), by Types 2025 & 2033
- Figure 23: South America Spill Containment Berm Revenue (million), by Country 2025 & 2033
- Figure 24: South America Spill Containment Berm Volume (K), by Country 2025 & 2033
- Figure 25: South America Spill Containment Berm Revenue Share (%), by Country 2025 & 2033
- Figure 26: South America Spill Containment Berm Volume Share (%), by Country 2025 & 2033
- Figure 27: Europe Spill Containment Berm Revenue (million), by Application 2025 & 2033
- Figure 28: Europe Spill Containment Berm Volume (K), by Application 2025 & 2033
- Figure 29: Europe Spill Containment Berm Revenue Share (%), by Application 2025 & 2033
- Figure 30: Europe Spill Containment Berm Volume Share (%), by Application 2025 & 2033
- Figure 31: Europe Spill Containment Berm Revenue (million), by Types 2025 & 2033
- Figure 32: Europe Spill Containment Berm Volume (K), by Types 2025 & 2033
- Figure 33: Europe Spill Containment Berm Revenue Share (%), by Types 2025 & 2033
- Figure 34: Europe Spill Containment Berm Volume Share (%), by Types 2025 & 2033
- Figure 35: Europe Spill Containment Berm Revenue (million), by Country 2025 & 2033
- Figure 36: Europe Spill Containment Berm Volume (K), by Country 2025 & 2033
- Figure 37: Europe Spill Containment Berm Revenue Share (%), by Country 2025 & 2033
- Figure 38: Europe Spill Containment Berm Volume Share (%), by Country 2025 & 2033
- Figure 39: Middle East & Africa Spill Containment Berm Revenue (million), by Application 2025 & 2033
- Figure 40: Middle East & Africa Spill Containment Berm Volume (K), by Application 2025 & 2033
- Figure 41: Middle East & Africa Spill Containment Berm Revenue Share (%), by Application 2025 & 2033
- Figure 42: Middle East & Africa Spill Containment Berm Volume Share (%), by Application 2025 & 2033
- Figure 43: Middle East & Africa Spill Containment Berm Revenue (million), by Types 2025 & 2033
- Figure 44: Middle East & Africa Spill Containment Berm Volume (K), by Types 2025 & 2033
- Figure 45: Middle East & Africa Spill Containment Berm Revenue Share (%), by Types 2025 & 2033
- Figure 46: Middle East & Africa Spill Containment Berm Volume Share (%), by Types 2025 & 2033
- Figure 47: Middle East & Africa Spill Containment Berm Revenue (million), by Country 2025 & 2033
- Figure 48: Middle East & Africa Spill Containment Berm Volume (K), by Country 2025 & 2033
- Figure 49: Middle East & Africa Spill Containment Berm Revenue Share (%), by Country 2025 & 2033
- Figure 50: Middle East & Africa Spill Containment Berm Volume Share (%), by Country 2025 & 2033
- Figure 51: Asia Pacific Spill Containment Berm Revenue (million), by Application 2025 & 2033
- Figure 52: Asia Pacific Spill Containment Berm Volume (K), by Application 2025 & 2033
- Figure 53: Asia Pacific Spill Containment Berm Revenue Share (%), by Application 2025 & 2033
- Figure 54: Asia Pacific Spill Containment Berm Volume Share (%), by Application 2025 & 2033
- Figure 55: Asia Pacific Spill Containment Berm Revenue (million), by Types 2025 & 2033
- Figure 56: Asia Pacific Spill Containment Berm Volume (K), by Types 2025 & 2033
- Figure 57: Asia Pacific Spill Containment Berm Revenue Share (%), by Types 2025 & 2033
- Figure 58: Asia Pacific Spill Containment Berm Volume Share (%), by Types 2025 & 2033
- Figure 59: Asia Pacific Spill Containment Berm Revenue (million), by Country 2025 & 2033
- Figure 60: Asia Pacific Spill Containment Berm Volume (K), by Country 2025 & 2033
- Figure 61: Asia Pacific Spill Containment Berm Revenue Share (%), by Country 2025 & 2033
- Figure 62: Asia Pacific Spill Containment Berm Volume Share (%), by Country 2025 & 2033
List of Tables
- Table 1: Global Spill Containment Berm Revenue million Forecast, by Application 2020 & 2033
- Table 2: Global Spill Containment Berm Volume K Forecast, by Application 2020 & 2033
- Table 3: Global Spill Containment Berm Revenue million Forecast, by Types 2020 & 2033
- Table 4: Global Spill Containment Berm Volume K Forecast, by Types 2020 & 2033
- Table 5: Global Spill Containment Berm Revenue million Forecast, by Region 2020 & 2033
- Table 6: Global Spill Containment Berm Volume K Forecast, by Region 2020 & 2033
- Table 7: Global Spill Containment Berm Revenue million Forecast, by Application 2020 & 2033
- Table 8: Global Spill Containment Berm Volume K Forecast, by Application 2020 & 2033
- Table 9: Global Spill Containment Berm Revenue million Forecast, by Types 2020 & 2033
- Table 10: Global Spill Containment Berm Volume K Forecast, by Types 2020 & 2033
- Table 11: Global Spill Containment Berm Revenue million Forecast, by Country 2020 & 2033
- Table 12: Global Spill Containment Berm Volume K Forecast, by Country 2020 & 2033
- Table 13: United States Spill Containment Berm Revenue (million) Forecast, by Application 2020 & 2033
- Table 14: United States Spill Containment Berm Volume (K) Forecast, by Application 2020 & 2033
- Table 15: Canada Spill Containment Berm Revenue (million) Forecast, by Application 2020 & 2033
- Table 16: Canada Spill Containment Berm Volume (K) Forecast, by Application 2020 & 2033
- Table 17: Mexico Spill Containment Berm Revenue (million) Forecast, by Application 2020 & 2033
- Table 18: Mexico Spill Containment Berm Volume (K) Forecast, by Application 2020 & 2033
- Table 19: Global Spill Containment Berm Revenue million Forecast, by Application 2020 & 2033
- Table 20: Global Spill Containment Berm Volume K Forecast, by Application 2020 & 2033
- Table 21: Global Spill Containment Berm Revenue million Forecast, by Types 2020 & 2033
- Table 22: Global Spill Containment Berm Volume K Forecast, by Types 2020 & 2033
- Table 23: Global Spill Containment Berm Revenue million Forecast, by Country 2020 & 2033
- Table 24: Global Spill Containment Berm Volume K Forecast, by Country 2020 & 2033
- Table 25: Brazil Spill Containment Berm Revenue (million) Forecast, by Application 2020 & 2033
- Table 26: Brazil Spill Containment Berm Volume (K) Forecast, by Application 2020 & 2033
- Table 27: Argentina Spill Containment Berm Revenue (million) Forecast, by Application 2020 & 2033
- Table 28: Argentina Spill Containment Berm Volume (K) Forecast, by Application 2020 & 2033
- Table 29: Rest of South America Spill Containment Berm Revenue (million) Forecast, by Application 2020 & 2033
- Table 30: Rest of South America Spill Containment Berm Volume (K) Forecast, by Application 2020 & 2033
- Table 31: Global Spill Containment Berm Revenue million Forecast, by Application 2020 & 2033
- Table 32: Global Spill Containment Berm Volume K Forecast, by Application 2020 & 2033
- Table 33: Global Spill Containment Berm Revenue million Forecast, by Types 2020 & 2033
- Table 34: Global Spill Containment Berm Volume K Forecast, by Types 2020 & 2033
- Table 35: Global Spill Containment Berm Revenue million Forecast, by Country 2020 & 2033
- Table 36: Global Spill Containment Berm Volume K Forecast, by Country 2020 & 2033
- Table 37: United Kingdom Spill Containment Berm Revenue (million) Forecast, by Application 2020 & 2033
- Table 38: United Kingdom Spill Containment Berm Volume (K) Forecast, by Application 2020 & 2033
- Table 39: Germany Spill Containment Berm Revenue (million) Forecast, by Application 2020 & 2033
- Table 40: Germany Spill Containment Berm Volume (K) Forecast, by Application 2020 & 2033
- Table 41: France Spill Containment Berm Revenue (million) Forecast, by Application 2020 & 2033
- Table 42: France Spill Containment Berm Volume (K) Forecast, by Application 2020 & 2033
- Table 43: Italy Spill Containment Berm Revenue (million) Forecast, by Application 2020 & 2033
- Table 44: Italy Spill Containment Berm Volume (K) Forecast, by Application 2020 & 2033
- Table 45: Spain Spill Containment Berm Revenue (million) Forecast, by Application 2020 & 2033
- Table 46: Spain Spill Containment Berm Volume (K) Forecast, by Application 2020 & 2033
- Table 47: Russia Spill Containment Berm Revenue (million) Forecast, by Application 2020 & 2033
- Table 48: Russia Spill Containment Berm Volume (K) Forecast, by Application 2020 & 2033
- Table 49: Benelux Spill Containment Berm Revenue (million) Forecast, by Application 2020 & 2033
- Table 50: Benelux Spill Containment Berm Volume (K) Forecast, by Application 2020 & 2033
- Table 51: Nordics Spill Containment Berm Revenue (million) Forecast, by Application 2020 & 2033
- Table 52: Nordics Spill Containment Berm Volume (K) Forecast, by Application 2020 & 2033
- Table 53: Rest of Europe Spill Containment Berm Revenue (million) Forecast, by Application 2020 & 2033
- Table 54: Rest of Europe Spill Containment Berm Volume (K) Forecast, by Application 2020 & 2033
- Table 55: Global Spill Containment Berm Revenue million Forecast, by Application 2020 & 2033
- Table 56: Global Spill Containment Berm Volume K Forecast, by Application 2020 & 2033
- Table 57: Global Spill Containment Berm Revenue million Forecast, by Types 2020 & 2033
- Table 58: Global Spill Containment Berm Volume K Forecast, by Types 2020 & 2033
- Table 59: Global Spill Containment Berm Revenue million Forecast, by Country 2020 & 2033
- Table 60: Global Spill Containment Berm Volume K Forecast, by Country 2020 & 2033
- Table 61: Turkey Spill Containment Berm Revenue (million) Forecast, by Application 2020 & 2033
- Table 62: Turkey Spill Containment Berm Volume (K) Forecast, by Application 2020 & 2033
- Table 63: Israel Spill Containment Berm Revenue (million) Forecast, by Application 2020 & 2033
- Table 64: Israel Spill Containment Berm Volume (K) Forecast, by Application 2020 & 2033
- Table 65: GCC Spill Containment Berm Revenue (million) Forecast, by Application 2020 & 2033
- Table 66: GCC Spill Containment Berm Volume (K) Forecast, by Application 2020 & 2033
- Table 67: North Africa Spill Containment Berm Revenue (million) Forecast, by Application 2020 & 2033
- Table 68: North Africa Spill Containment Berm Volume (K) Forecast, by Application 2020 & 2033
- Table 69: South Africa Spill Containment Berm Revenue (million) Forecast, by Application 2020 & 2033
- Table 70: South Africa Spill Containment Berm Volume (K) Forecast, by Application 2020 & 2033
- Table 71: Rest of Middle East & Africa Spill Containment Berm Revenue (million) Forecast, by Application 2020 & 2033
- Table 72: Rest of Middle East & Africa Spill Containment Berm Volume (K) Forecast, by Application 2020 & 2033
- Table 73: Global Spill Containment Berm Revenue million Forecast, by Application 2020 & 2033
- Table 74: Global Spill Containment Berm Volume K Forecast, by Application 2020 & 2033
- Table 75: Global Spill Containment Berm Revenue million Forecast, by Types 2020 & 2033
- Table 76: Global Spill Containment Berm Volume K Forecast, by Types 2020 & 2033
- Table 77: Global Spill Containment Berm Revenue million Forecast, by Country 2020 & 2033
- Table 78: Global Spill Containment Berm Volume K Forecast, by Country 2020 & 2033
- Table 79: China Spill Containment Berm Revenue (million) Forecast, by Application 2020 & 2033
- Table 80: China Spill Containment Berm Volume (K) Forecast, by Application 2020 & 2033
- Table 81: India Spill Containment Berm Revenue (million) Forecast, by Application 2020 & 2033
- Table 82: India Spill Containment Berm Volume (K) Forecast, by Application 2020 & 2033
- Table 83: Japan Spill Containment Berm Revenue (million) Forecast, by Application 2020 & 2033
- Table 84: Japan Spill Containment Berm Volume (K) Forecast, by Application 2020 & 2033
- Table 85: South Korea Spill Containment Berm Revenue (million) Forecast, by Application 2020 & 2033
- Table 86: South Korea Spill Containment Berm Volume (K) Forecast, by Application 2020 & 2033
- Table 87: ASEAN Spill Containment Berm Revenue (million) Forecast, by Application 2020 & 2033
- Table 88: ASEAN Spill Containment Berm Volume (K) Forecast, by Application 2020 & 2033
- Table 89: Oceania Spill Containment Berm Revenue (million) Forecast, by Application 2020 & 2033
- Table 90: Oceania Spill Containment Berm Volume (K) Forecast, by Application 2020 & 2033
- Table 91: Rest of Asia Pacific Spill Containment Berm Revenue (million) Forecast, by Application 2020 & 2033
- Table 92: Rest of Asia Pacific Spill Containment Berm Volume (K) Forecast, by Application 2020 & 2033
Frequently Asked Questions
1. What is the projected Compound Annual Growth Rate (CAGR) of the Spill Containment Berm?
The projected CAGR is approximately 3.4%.
2. Which companies are prominent players in the Spill Containment Berm?
Key companies in the market include Justrite, SafeRack, Brady, UltraTech, New Pig, PacTec, ENPAC, Norseman, FOL-DA-TANK, AIRE Environmental, GEI Works, Inc., Hazmasters Inc., Husky Portable Containment, CEP Sorbents, Halenhardy, LLC, EnviroZone, LLC, Meltblown Technologies, LLC, EnSafeCo LLC, Versatech Products Inc., Absorbent Products Ltd., EnviroGuard, Eagle Manufacturing, SYSBEL, Powertronics Co., Ltd., Qingdao Guangming Environmental Technology.
3. What are the main segments of the Spill Containment Berm?
The market segments include Application, Types.
4. Can you provide details about the market size?
The market size is estimated to be USD 134 million as of 2022.
5. What are some drivers contributing to market growth?
N/A
6. What are the notable trends driving market growth?
N/A
7. Are there any restraints impacting market growth?
N/A
8. Can you provide examples of recent developments in the market?
N/A
9. What pricing options are available for accessing the report?
Pricing options include single-user, multi-user, and enterprise licenses priced at USD 3950.00, USD 5925.00, and USD 7900.00 respectively.
10. Is the market size provided in terms of value or volume?
The market size is provided in terms of value, measured in million and volume, measured in K.
11. Are there any specific market keywords associated with the report?
Yes, the market keyword associated with the report is "Spill Containment Berm," which aids in identifying and referencing the specific market segment covered.
12. How do I determine which pricing option suits my needs best?
The pricing options vary based on user requirements and access needs. Individual users may opt for single-user licenses, while businesses requiring broader access may choose multi-user or enterprise licenses for cost-effective access to the report.
13. Are there any additional resources or data provided in the Spill Containment Berm report?
While the report offers comprehensive insights, it's advisable to review the specific contents or supplementary materials provided to ascertain if additional resources or data are available.
14. How can I stay updated on further developments or reports in the Spill Containment Berm?
To stay informed about further developments, trends, and reports in the Spill Containment Berm, consider subscribing to industry newsletters, following relevant companies and organizations, or regularly checking reputable industry news sources and publications.
Methodology
Step 1 - Identification of Relevant Samples Size from Population Database


Step 2 - Approaches for Defining Global Market Size (Value, Volume* & Price*)

Note*: In applicable scenarios
Step 3 - Data Sources
Primary Research
- Web Analytics
- Survey Reports
- Research Institute
- Latest Research Reports
- Opinion Leaders
Secondary Research
- Annual Reports
- White Paper
- Latest Press Release
- Industry Association
- Paid Database
- Investor Presentations

Step 4 - Data Triangulation
Involves using different sources of information in order to increase the validity of a study
These sources are likely to be stakeholders in a program - participants, other researchers, program staff, other community members, and so on.
Then we put all data in single framework & apply various statistical tools to find out the dynamic on the market.
During the analysis stage, feedback from the stakeholder groups would be compared to determine areas of agreement as well as areas of divergence