

Key Insights
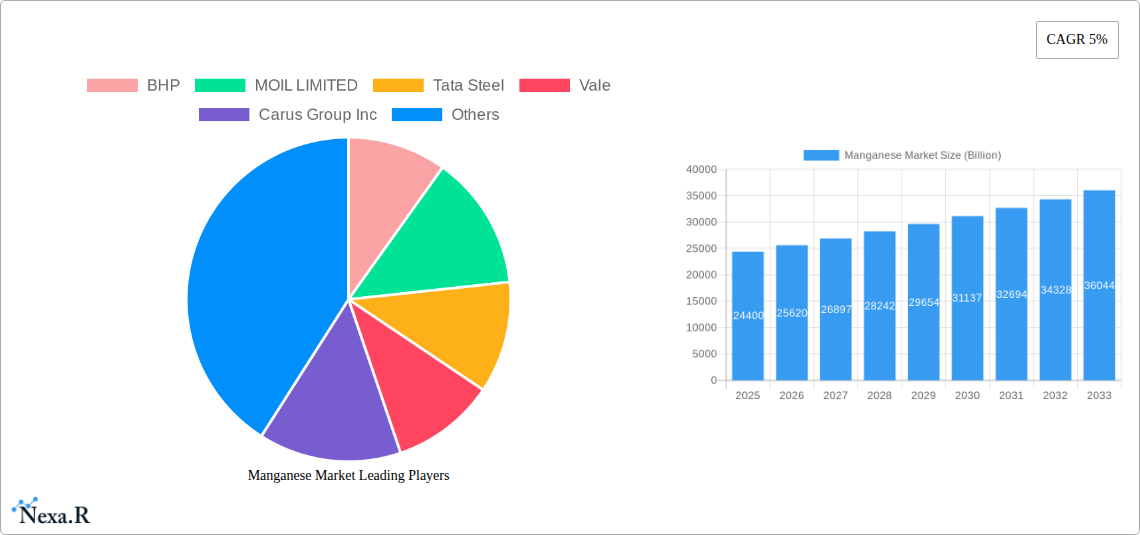
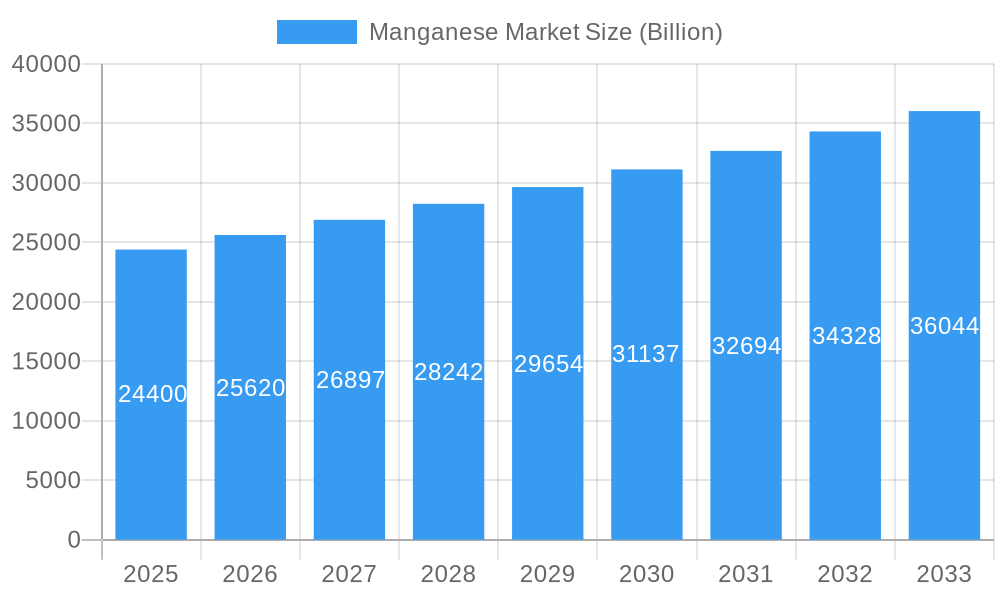
The global Manganese Market is poised for robust growth, projected to reach $24.4 billion by the forecast year, driven by a CAGR of 5% from 2025 to 2033. This expansion is primarily fueled by the increasing demand for manganese in crucial sectors such as steel production, where it acts as a vital alloying agent to enhance strength, toughness, and wear resistance. The burgeoning electric vehicle (EV) market, with its insatiable appetite for batteries, represents another significant growth catalyst. Electrolytic Manganese Dioxide (EMD), a key component in alkaline and lithium-ion batteries, will see accelerated demand. Furthermore, the construction industry's ongoing development, particularly in emerging economies, will sustain the need for manganese-based materials. The market's dynamism is also shaped by advancements in manganese extraction and processing technologies, leading to more efficient and environmentally conscious production methods. Innovations in battery technology are also expected to unlock new avenues for manganese applications, further propelling market expansion.
Manganese Market Market Size (In Billion)
However, the market is not without its challenges. Fluctuations in raw material prices, particularly for high-grade manganese ore, can impact profitability and investment decisions. Geopolitical factors and supply chain disruptions, exacerbated by the concentration of mining operations in specific regions, pose a risk to stable supply. Environmental regulations concerning mining and processing activities, while necessary, can also lead to increased operational costs. Despite these restraints, the overarching trend of industrialization and technological advancement, coupled with a global push towards sustainable energy solutions, underpins a positive outlook for the manganese market. Key players are strategically investing in research and development, exploring new applications, and optimizing their supply chains to navigate these complexities and capitalize on the significant growth opportunities.
Manganese Market Company Market Share
Manganese Market: Comprehensive Analysis & Future Outlook (2019-2033)
This report offers an in-depth analysis of the global manganese market, a critical raw material for various industries. Explore market dynamics, growth trends, dominant regions, product landscape, key drivers, emerging opportunities, and strategic insights shaping the manganese industry. Our analysis covers the historical period from 2019 to 2024, with the base year and estimated year at 2025, and provides a comprehensive forecast period from 2025 to 2033. This report is vital for industry professionals seeking to understand the intricacies of the manganese ore market, manganese alloys market, and the burgeoning manganese chemicals market.
Manganese Market Market Dynamics & Structure
The global manganese market is characterized by a moderately consolidated structure, with a few key players dominating production and supply. Technological innovation plays a crucial role, particularly in developing more efficient extraction and processing techniques, and in creating advanced manganese-based materials. Regulatory frameworks, especially concerning environmental impact and trade policies, significantly influence market accessibility and cost. Competitive product substitutes, while limited for certain high-demand applications like steelmaking, are continuously being explored in niche areas. End-user demographics reveal a strong reliance on industrial manufacturing, construction, and the rapidly expanding power storage and electricity sector. Mergers and acquisitions (M&A) are a key feature, driving market consolidation and vertical integration. For instance, the manganese alloys market is often shaped by strategic alliances between mining companies and steel producers.
- Market Concentration: Dominated by a mix of large-scale mining corporations and specialized chemical producers.
- Technological Drivers: Innovations in beneficiation, hydrometallurgy, and battery materials technology.
- Regulatory Impact: Environmental regulations and international trade agreements impact production costs and market access.
- Competitive Landscape: Primarily driven by supply-demand dynamics for manganese alloys and electrolytic manganese dioxide.
- End-User Evolution: Increasing demand from the electric vehicle battery sector is a significant demographic shift.
- M&A Activity: Strategic acquisitions aimed at securing raw material supply and expanding product portfolios. Anticipated M&A deal volumes are projected to increase by 15% over the forecast period, as companies seek to strengthen their market position in the manganese market.
Manganese Market Growth Trends & Insights
The manganese market is poised for robust growth driven by escalating demand from critical sectors. The global manganese market size is estimated to reach over $15 Billion by 2025, with a projected Compound Annual Growth Rate (CAGR) of approximately 5.8% during the forecast period of 2025-2033. This expansion is fueled by the indispensable role of manganese in steel production, where it enhances strength, hardness, and wear resistance. Furthermore, the burgeoning power storage and electricity sector, particularly the production of electrolytic manganese dioxide (EMD) for batteries, is a significant growth accelerator. Adoption rates of manganese-based battery technologies are projected to surge by over 30% by 2030. Technological disruptions, such as advancements in battery chemistry and novel applications in metallurgy, are continuously reshaping the market landscape. Consumer behavior shifts towards sustainable energy solutions directly translate into increased demand for high-purity manganese. The industrial segment continues to be a cornerstone, contributing approximately 60% of the overall market revenue.
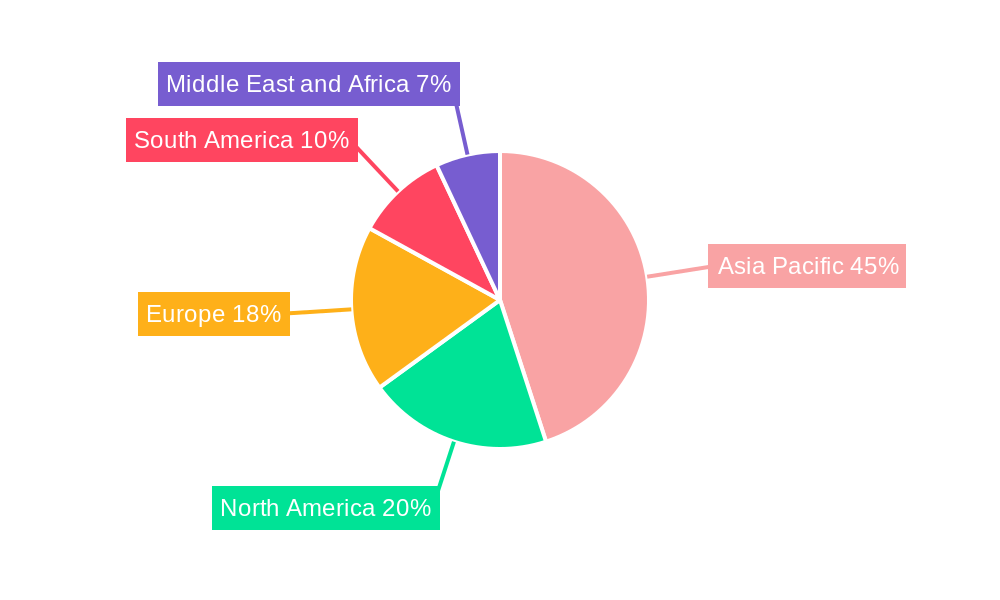
Dominant Regions, Countries, or Segments in Manganese Market
The manganese market is currently dominated by the Application: Alloys segment, which accounts for an estimated 65% of the total market value by 2025. This dominance is intrinsically linked to the global steel industry's persistent demand for manganese alloys, crucial for improving steel's mechanical properties. Geographically, Asia-Pacific stands out as the leading region, driven by the massive industrial and construction output of countries like China and India. China alone is expected to represent over 35% of the global manganese consumption by 2025.
Dominant Application: Alloys:
- Essential for ferrous metallurgy, enhancing steel strength and durability.
- A significant driver for manganese ore market demand.
- Continual innovation in alloy compositions for specialized industrial applications.
Leading Region: Asia-Pacific:
- High demand from burgeoning construction and automotive sectors.
- Government initiatives promoting infrastructure development and manufacturing.
- Presence of major steel production hubs, including China and India, significantly impacting the manganese alloys market.
Key Country: China:
- Largest consumer and producer of steel, driving substantial manganese alloy demand.
- Significant investments in battery manufacturing, boosting electrolytic manganese dioxide and electrolytic manganese metals demand.
- Favorable government policies supporting industrial growth.
Emerging Application: Power Storage and Electricity:
- Rapid growth in demand for electrolytic manganese dioxide for alkaline and lithium-ion batteries.
- Increasing adoption of electric vehicles globally.
- Potential for significant market share expansion in the forecast period.
Manganese Market Product Landscape
The manganese market's product landscape is diverse, with key offerings including manganese alloys, electrolytic manganese dioxide (EMD), and electrolytic manganese metals (EMM). Manganese alloys, such as ferromanganese and silicomanganese, are vital for the steel industry, imparting essential properties like strength and corrosion resistance. EMD is a critical component in the production of primary batteries and is gaining traction in rechargeable battery chemistries, contributing to the power storage and electricity sector's growth. EMM, with its high purity, finds applications in specialized alloys and chemical manufacturing. Continuous innovation focuses on enhancing the purity of EMD and EMM for advanced battery applications and developing more sustainable production methods for all manganese products.
Key Drivers, Barriers & Challenges in Manganese Market
Key Drivers:
- Robust Steel Industry Demand: The manganese alloys market is fundamentally driven by the global steel sector's continuous need for improved material properties.
- Growth in Battery Technology: The surge in electric vehicles and renewable energy storage solutions significantly boosts demand for electrolytic manganese dioxide (EMD).
- Infrastructure Development: Global investments in infrastructure projects fuel demand for steel and, consequently, manganese.
- Technological Advancements: Innovations in mining, processing, and the development of high-performance manganese-based materials.
Barriers & Challenges:
- Price Volatility: Fluctuations in manganese ore prices can impact profitability and investment decisions.
- Environmental Regulations: Stringent environmental standards for mining and processing can increase operational costs and compliance burdens.
- Supply Chain Disruptions: Geopolitical factors, logistical challenges, and resource nationalism can disrupt the global supply of manganese.
- Competition from Substitutes: While limited, ongoing research into alternative materials for certain applications poses a potential challenge.
- Concentration of Reserves: A significant portion of high-grade manganese reserves is concentrated in a few countries, creating potential supply dependencies.
Emerging Opportunities in Manganese Market
The manganese market is witnessing exciting emerging opportunities, particularly in the realm of advanced battery technologies. The increasing global push for electrification and sustainable energy solutions is driving substantial demand for high-purity electrolytic manganese dioxide (EMD) and electrolytic manganese metals (EMM) for both primary and secondary battery applications. Beyond traditional steelmaking, there's growing interest in manganese alloys for lightweight automotive components and aerospace applications, offering enhanced fuel efficiency. Furthermore, research into manganese-based catalysts for industrial chemical processes and its potential use in advanced materials science presents untapped markets and novel applications. The parent market for manganese is thus expanding beyond its traditional base.
Growth Accelerators in the Manganese Market Industry
Several catalysts are accelerating the growth of the manganese market industry. The relentless progress in battery technology, specifically for electric vehicles and grid-scale energy storage, represents a major growth accelerator, driving demand for specialized manganese compounds like EMD. Strategic partnerships and collaborations between mining companies, battery manufacturers, and automotive original equipment manufacturers (OEMs) are crucial for ensuring a stable supply chain and fostering innovation. Government incentives and regulations promoting renewable energy adoption and emissions reduction further bolster the demand for manganese-containing products. Moreover, advancements in recycling technologies for manganese-based materials are also contributing to a more circular economy and sustainable growth.
Key Players Shaping the Manganese Market Market
- BHP
- MOIL LIMITED
- Tata Steel
- Vale
- Carus Group Inc
- Jupiter Mines Limited
- Sibelco
- Mesa Minerals Limited
- NIPPON DENKO CO LTD
- Ningxia Tianyuan Manganese Industry Group Co Ltd
- Eramet
- Anglo American PLC
- Assore Limited (Assmang Proprietary Limited)
Notable Milestones in Manganese Market Sector
- August 2020: South32 Ltd. announced the sale of its entire stake in the manganese alloy smelter, Tasmanian Electro Metallurgical Company (TEMCO) to UK-based conglomerate GFG Alliance, enhancing GFG Alliance's position in the manganese alloys market.
In-Depth Manganese Market Market Outlook
The future outlook for the manganese market remains exceptionally positive, underpinned by persistent demand from foundational industries and significant growth potential in emerging sectors. The global manganese market is poised to benefit from continued expansion in steel production, particularly in developing economies, while the child market for battery materials is set for exponential growth. Strategic investments in research and development focused on enhancing manganese extraction efficiency and developing novel, high-performance manganese-based products will be critical. Companies that can navigate the evolving regulatory landscape, secure stable supply chains, and innovate in response to the demands of the power storage and electricity sector are well-positioned for substantial long-term success. The increasing focus on sustainability will also drive opportunities in manganese recycling and the development of eco-friendly production processes.
Manganese Market Segmentation
-
1. Application
- 1.1. Alloys
- 1.2. Electrolytic Manganese Dioxide
- 1.3. Electrolytic Manganese Metals
- 1.4. Other Applications
-
2. End-use Sector
- 2.1. Industrial
- 2.2. Construction
- 2.3. Power Storage and Electricity
- 2.4. Other End-use Sectors
Manganese Market Segmentation By Geography
-
1. Asia Pacific
- 1.1. China
- 1.2. India
- 1.3. Japan
- 1.4. South Korea
- 1.5. Rest of Asia Pacific
-
2. North America
- 2.1. United States
- 2.2. Canada
- 2.3. Mexico
-
3. Europe
- 3.1. Germany
- 3.2. United Kingdom
- 3.3. Italy
- 3.4. France
- 3.5. Rest of Europe
-
4. South America
- 4.1. Brazil
- 4.2. Argentina
- 4.3. Rest of South America
-
5. Middle East and Africa
- 5.1. Saudi Arabia
- 5.2. South Africa
- 5.3. Rest of Middle East and Africa
Manganese Market Regional Market Share
Geographic Coverage of Manganese Market
Manganese Market REPORT HIGHLIGHTS
| Aspects | Details |
|---|---|
| Study Period | 2020-2034 |
| Base Year | 2025 |
| Estimated Year | 2026 |
| Forecast Period | 2026-2034 |
| Historical Period | 2020-2025 |
| Growth Rate | CAGR of 5% from 2020-2034 |
| Segmentation |
|
Table of Contents
- 1. Introduction
- 1.1. Research Scope
- 1.2. Market Segmentation
- 1.3. Research Objective
- 1.4. Definitions and Assumptions
- 2. Executive Summary
- 2.1. Market Snapshot
- 3. Market Dynamics
- 3.1. Market Drivers
- 3.2. Market Restrains
- 3.3. Market Trends
- 3.4. Market Opportunities
- 4. Market Factor Analysis
- 4.1. Porters Five Forces
- 4.1.1. Bargaining Power of Suppliers
- 4.1.2. Bargaining Power of Buyers
- 4.1.3. Threat of New Entrants
- 4.1.4. Threat of Substitutes
- 4.1.5. Competitive Rivalry
- 4.2. PESTEL analysis
- 4.3. BCG Analysis
- 4.3.1. Stars (High Growth, High Market Share)
- 4.3.2. Cash Cows (Low Growth, High Market Share)
- 4.3.3. Question Mark (High Growth, Low Market Share)
- 4.3.4. Dogs (Low Growth, Low Market Share)
- 4.4. Ansoff Matrix Analysis
- 4.5. Supply Chain Analysis
- 4.6. Regulatory Landscape
- 4.7. Current Market Potential and Opportunity Assessment (TAM–SAM–SOM Framework)
- 4.8. NRP Analyst Note
- 4.1. Porters Five Forces
- 5. Market Analysis, Insights and Forecast 2021-2033
- 5.1. Market Analysis, Insights and Forecast - by Application
- 5.1.1. Alloys
- 5.1.2. Electrolytic Manganese Dioxide
- 5.1.3. Electrolytic Manganese Metals
- 5.1.4. Other Applications
- 5.2. Market Analysis, Insights and Forecast - by End-use Sector
- 5.2.1. Industrial
- 5.2.2. Construction
- 5.2.3. Power Storage and Electricity
- 5.2.4. Other End-use Sectors
- 5.3. Market Analysis, Insights and Forecast - by Region
- 5.3.1. Asia Pacific
- 5.3.2. North America
- 5.3.3. Europe
- 5.3.4. South America
- 5.3.5. Middle East and Africa
- 5.1. Market Analysis, Insights and Forecast - by Application
- 6. Global Manganese Market Analysis, Insights and Forecast, 2021-2033
- 6.1. Market Analysis, Insights and Forecast - by Application
- 6.1.1. Alloys
- 6.1.2. Electrolytic Manganese Dioxide
- 6.1.3. Electrolytic Manganese Metals
- 6.1.4. Other Applications
- 6.2. Market Analysis, Insights and Forecast - by End-use Sector
- 6.2.1. Industrial
- 6.2.2. Construction
- 6.2.3. Power Storage and Electricity
- 6.2.4. Other End-use Sectors
- 6.1. Market Analysis, Insights and Forecast - by Application
- 7. Asia Pacific Manganese Market Analysis, Insights and Forecast, 2020-2032
- 7.1. Market Analysis, Insights and Forecast - by Application
- 7.1.1. Alloys
- 7.1.2. Electrolytic Manganese Dioxide
- 7.1.3. Electrolytic Manganese Metals
- 7.1.4. Other Applications
- 7.2. Market Analysis, Insights and Forecast - by End-use Sector
- 7.2.1. Industrial
- 7.2.2. Construction
- 7.2.3. Power Storage and Electricity
- 7.2.4. Other End-use Sectors
- 7.1. Market Analysis, Insights and Forecast - by Application
- 8. North America Manganese Market Analysis, Insights and Forecast, 2020-2032
- 8.1. Market Analysis, Insights and Forecast - by Application
- 8.1.1. Alloys
- 8.1.2. Electrolytic Manganese Dioxide
- 8.1.3. Electrolytic Manganese Metals
- 8.1.4. Other Applications
- 8.2. Market Analysis, Insights and Forecast - by End-use Sector
- 8.2.1. Industrial
- 8.2.2. Construction
- 8.2.3. Power Storage and Electricity
- 8.2.4. Other End-use Sectors
- 8.1. Market Analysis, Insights and Forecast - by Application
- 9. Europe Manganese Market Analysis, Insights and Forecast, 2020-2032
- 9.1. Market Analysis, Insights and Forecast - by Application
- 9.1.1. Alloys
- 9.1.2. Electrolytic Manganese Dioxide
- 9.1.3. Electrolytic Manganese Metals
- 9.1.4. Other Applications
- 9.2. Market Analysis, Insights and Forecast - by End-use Sector
- 9.2.1. Industrial
- 9.2.2. Construction
- 9.2.3. Power Storage and Electricity
- 9.2.4. Other End-use Sectors
- 9.1. Market Analysis, Insights and Forecast - by Application
- 10. South America Manganese Market Analysis, Insights and Forecast, 2020-2032
- 10.1. Market Analysis, Insights and Forecast - by Application
- 10.1.1. Alloys
- 10.1.2. Electrolytic Manganese Dioxide
- 10.1.3. Electrolytic Manganese Metals
- 10.1.4. Other Applications
- 10.2. Market Analysis, Insights and Forecast - by End-use Sector
- 10.2.1. Industrial
- 10.2.2. Construction
- 10.2.3. Power Storage and Electricity
- 10.2.4. Other End-use Sectors
- 10.1. Market Analysis, Insights and Forecast - by Application
- 11. Middle East and Africa Manganese Market Analysis, Insights and Forecast, 2020-2032
- 11.1. Market Analysis, Insights and Forecast - by Application
- 11.1.1. Alloys
- 11.1.2. Electrolytic Manganese Dioxide
- 11.1.3. Electrolytic Manganese Metals
- 11.1.4. Other Applications
- 11.2. Market Analysis, Insights and Forecast - by End-use Sector
- 11.2.1. Industrial
- 11.2.2. Construction
- 11.2.3. Power Storage and Electricity
- 11.2.4. Other End-use Sectors
- 11.1. Market Analysis, Insights and Forecast - by Application
- 12. Competitive Analysis
- 12.1. Company Profiles
- 12.1.1 BHP
- 12.1.1.1. Company Overview
- 12.1.1.2. Products
- 12.1.1.3. Company Financials
- 12.1.1.4. SWOT Analysis
- 12.1.2 MOIL LIMITED
- 12.1.2.1. Company Overview
- 12.1.2.2. Products
- 12.1.2.3. Company Financials
- 12.1.2.4. SWOT Analysis
- 12.1.3 Tata Steel
- 12.1.3.1. Company Overview
- 12.1.3.2. Products
- 12.1.3.3. Company Financials
- 12.1.3.4. SWOT Analysis
- 12.1.4 Vale
- 12.1.4.1. Company Overview
- 12.1.4.2. Products
- 12.1.4.3. Company Financials
- 12.1.4.4. SWOT Analysis
- 12.1.5 Carus Group Inc
- 12.1.5.1. Company Overview
- 12.1.5.2. Products
- 12.1.5.3. Company Financials
- 12.1.5.4. SWOT Analysis
- 12.1.6 Jupiter Mines Limited
- 12.1.6.1. Company Overview
- 12.1.6.2. Products
- 12.1.6.3. Company Financials
- 12.1.6.4. SWOT Analysis
- 12.1.7 Sibelco
- 12.1.7.1. Company Overview
- 12.1.7.2. Products
- 12.1.7.3. Company Financials
- 12.1.7.4. SWOT Analysis
- 12.1.8 Mesa Minerals Limited
- 12.1.8.1. Company Overview
- 12.1.8.2. Products
- 12.1.8.3. Company Financials
- 12.1.8.4. SWOT Analysis
- 12.1.9 NIPPON DENKO CO LTD
- 12.1.9.1. Company Overview
- 12.1.9.2. Products
- 12.1.9.3. Company Financials
- 12.1.9.4. SWOT Analysis
- 12.1.10 Ningxia Tianyuan Manganese Industry Group Co Ltd
- 12.1.10.1. Company Overview
- 12.1.10.2. Products
- 12.1.10.3. Company Financials
- 12.1.10.4. SWOT Analysis
- 12.1.11 Eramet
- 12.1.11.1. Company Overview
- 12.1.11.2. Products
- 12.1.11.3. Company Financials
- 12.1.11.4. SWOT Analysis
- 12.1.12 Anglo American PLC
- 12.1.12.1. Company Overview
- 12.1.12.2. Products
- 12.1.12.3. Company Financials
- 12.1.12.4. SWOT Analysis
- 12.1.13 Assore Limited (Assmang Proprietary Limited)
- 12.1.13.1. Company Overview
- 12.1.13.2. Products
- 12.1.13.3. Company Financials
- 12.1.13.4. SWOT Analysis
- 12.1.1 BHP
- 12.2. Market Entropy
- 12.2.1 Company's Key Areas Served
- 12.2.2 Recent Developments
- 12.3. Company Market Share Analysis 2025
- 12.3.1 Top 5 Companies Market Share Analysis
- 12.3.2 Top 3 Companies Market Share Analysis
- 12.4. List of Potential Customers
- 13. Research Methodology
List of Figures
- Figure 1: Global Manganese Market Revenue Breakdown (Billion, %) by Region 2025 & 2033
- Figure 2: Global Manganese Market Volume Breakdown (K Tons, %) by Region 2025 & 2033
- Figure 3: Asia Pacific Manganese Market Revenue (Billion), by Application 2025 & 2033
- Figure 4: Asia Pacific Manganese Market Volume (K Tons), by Application 2025 & 2033
- Figure 5: Asia Pacific Manganese Market Revenue Share (%), by Application 2025 & 2033
- Figure 6: Asia Pacific Manganese Market Volume Share (%), by Application 2025 & 2033
- Figure 7: Asia Pacific Manganese Market Revenue (Billion), by End-use Sector 2025 & 2033
- Figure 8: Asia Pacific Manganese Market Volume (K Tons), by End-use Sector 2025 & 2033
- Figure 9: Asia Pacific Manganese Market Revenue Share (%), by End-use Sector 2025 & 2033
- Figure 10: Asia Pacific Manganese Market Volume Share (%), by End-use Sector 2025 & 2033
- Figure 11: Asia Pacific Manganese Market Revenue (Billion), by Country 2025 & 2033
- Figure 12: Asia Pacific Manganese Market Volume (K Tons), by Country 2025 & 2033
- Figure 13: Asia Pacific Manganese Market Revenue Share (%), by Country 2025 & 2033
- Figure 14: Asia Pacific Manganese Market Volume Share (%), by Country 2025 & 2033
- Figure 15: North America Manganese Market Revenue (Billion), by Application 2025 & 2033
- Figure 16: North America Manganese Market Volume (K Tons), by Application 2025 & 2033
- Figure 17: North America Manganese Market Revenue Share (%), by Application 2025 & 2033
- Figure 18: North America Manganese Market Volume Share (%), by Application 2025 & 2033
- Figure 19: North America Manganese Market Revenue (Billion), by End-use Sector 2025 & 2033
- Figure 20: North America Manganese Market Volume (K Tons), by End-use Sector 2025 & 2033
- Figure 21: North America Manganese Market Revenue Share (%), by End-use Sector 2025 & 2033
- Figure 22: North America Manganese Market Volume Share (%), by End-use Sector 2025 & 2033
- Figure 23: North America Manganese Market Revenue (Billion), by Country 2025 & 2033
- Figure 24: North America Manganese Market Volume (K Tons), by Country 2025 & 2033
- Figure 25: North America Manganese Market Revenue Share (%), by Country 2025 & 2033
- Figure 26: North America Manganese Market Volume Share (%), by Country 2025 & 2033
- Figure 27: Europe Manganese Market Revenue (Billion), by Application 2025 & 2033
- Figure 28: Europe Manganese Market Volume (K Tons), by Application 2025 & 2033
- Figure 29: Europe Manganese Market Revenue Share (%), by Application 2025 & 2033
- Figure 30: Europe Manganese Market Volume Share (%), by Application 2025 & 2033
- Figure 31: Europe Manganese Market Revenue (Billion), by End-use Sector 2025 & 2033
- Figure 32: Europe Manganese Market Volume (K Tons), by End-use Sector 2025 & 2033
- Figure 33: Europe Manganese Market Revenue Share (%), by End-use Sector 2025 & 2033
- Figure 34: Europe Manganese Market Volume Share (%), by End-use Sector 2025 & 2033
- Figure 35: Europe Manganese Market Revenue (Billion), by Country 2025 & 2033
- Figure 36: Europe Manganese Market Volume (K Tons), by Country 2025 & 2033
- Figure 37: Europe Manganese Market Revenue Share (%), by Country 2025 & 2033
- Figure 38: Europe Manganese Market Volume Share (%), by Country 2025 & 2033
- Figure 39: South America Manganese Market Revenue (Billion), by Application 2025 & 2033
- Figure 40: South America Manganese Market Volume (K Tons), by Application 2025 & 2033
- Figure 41: South America Manganese Market Revenue Share (%), by Application 2025 & 2033
- Figure 42: South America Manganese Market Volume Share (%), by Application 2025 & 2033
- Figure 43: South America Manganese Market Revenue (Billion), by End-use Sector 2025 & 2033
- Figure 44: South America Manganese Market Volume (K Tons), by End-use Sector 2025 & 2033
- Figure 45: South America Manganese Market Revenue Share (%), by End-use Sector 2025 & 2033
- Figure 46: South America Manganese Market Volume Share (%), by End-use Sector 2025 & 2033
- Figure 47: South America Manganese Market Revenue (Billion), by Country 2025 & 2033
- Figure 48: South America Manganese Market Volume (K Tons), by Country 2025 & 2033
- Figure 49: South America Manganese Market Revenue Share (%), by Country 2025 & 2033
- Figure 50: South America Manganese Market Volume Share (%), by Country 2025 & 2033
- Figure 51: Middle East and Africa Manganese Market Revenue (Billion), by Application 2025 & 2033
- Figure 52: Middle East and Africa Manganese Market Volume (K Tons), by Application 2025 & 2033
- Figure 53: Middle East and Africa Manganese Market Revenue Share (%), by Application 2025 & 2033
- Figure 54: Middle East and Africa Manganese Market Volume Share (%), by Application 2025 & 2033
- Figure 55: Middle East and Africa Manganese Market Revenue (Billion), by End-use Sector 2025 & 2033
- Figure 56: Middle East and Africa Manganese Market Volume (K Tons), by End-use Sector 2025 & 2033
- Figure 57: Middle East and Africa Manganese Market Revenue Share (%), by End-use Sector 2025 & 2033
- Figure 58: Middle East and Africa Manganese Market Volume Share (%), by End-use Sector 2025 & 2033
- Figure 59: Middle East and Africa Manganese Market Revenue (Billion), by Country 2025 & 2033
- Figure 60: Middle East and Africa Manganese Market Volume (K Tons), by Country 2025 & 2033
- Figure 61: Middle East and Africa Manganese Market Revenue Share (%), by Country 2025 & 2033
- Figure 62: Middle East and Africa Manganese Market Volume Share (%), by Country 2025 & 2033
List of Tables
- Table 1: Global Manganese Market Revenue Billion Forecast, by Application 2020 & 2033
- Table 2: Global Manganese Market Volume K Tons Forecast, by Application 2020 & 2033
- Table 3: Global Manganese Market Revenue Billion Forecast, by End-use Sector 2020 & 2033
- Table 4: Global Manganese Market Volume K Tons Forecast, by End-use Sector 2020 & 2033
- Table 5: Global Manganese Market Revenue Billion Forecast, by Region 2020 & 2033
- Table 6: Global Manganese Market Volume K Tons Forecast, by Region 2020 & 2033
- Table 7: Global Manganese Market Revenue Billion Forecast, by Application 2020 & 2033
- Table 8: Global Manganese Market Volume K Tons Forecast, by Application 2020 & 2033
- Table 9: Global Manganese Market Revenue Billion Forecast, by End-use Sector 2020 & 2033
- Table 10: Global Manganese Market Volume K Tons Forecast, by End-use Sector 2020 & 2033
- Table 11: Global Manganese Market Revenue Billion Forecast, by Country 2020 & 2033
- Table 12: Global Manganese Market Volume K Tons Forecast, by Country 2020 & 2033
- Table 13: China Manganese Market Revenue (Billion) Forecast, by Application 2020 & 2033
- Table 14: China Manganese Market Volume (K Tons) Forecast, by Application 2020 & 2033
- Table 15: India Manganese Market Revenue (Billion) Forecast, by Application 2020 & 2033
- Table 16: India Manganese Market Volume (K Tons) Forecast, by Application 2020 & 2033
- Table 17: Japan Manganese Market Revenue (Billion) Forecast, by Application 2020 & 2033
- Table 18: Japan Manganese Market Volume (K Tons) Forecast, by Application 2020 & 2033
- Table 19: South Korea Manganese Market Revenue (Billion) Forecast, by Application 2020 & 2033
- Table 20: South Korea Manganese Market Volume (K Tons) Forecast, by Application 2020 & 2033
- Table 21: Rest of Asia Pacific Manganese Market Revenue (Billion) Forecast, by Application 2020 & 2033
- Table 22: Rest of Asia Pacific Manganese Market Volume (K Tons) Forecast, by Application 2020 & 2033
- Table 23: Global Manganese Market Revenue Billion Forecast, by Application 2020 & 2033
- Table 24: Global Manganese Market Volume K Tons Forecast, by Application 2020 & 2033
- Table 25: Global Manganese Market Revenue Billion Forecast, by End-use Sector 2020 & 2033
- Table 26: Global Manganese Market Volume K Tons Forecast, by End-use Sector 2020 & 2033
- Table 27: Global Manganese Market Revenue Billion Forecast, by Country 2020 & 2033
- Table 28: Global Manganese Market Volume K Tons Forecast, by Country 2020 & 2033
- Table 29: United States Manganese Market Revenue (Billion) Forecast, by Application 2020 & 2033
- Table 30: United States Manganese Market Volume (K Tons) Forecast, by Application 2020 & 2033
- Table 31: Canada Manganese Market Revenue (Billion) Forecast, by Application 2020 & 2033
- Table 32: Canada Manganese Market Volume (K Tons) Forecast, by Application 2020 & 2033
- Table 33: Mexico Manganese Market Revenue (Billion) Forecast, by Application 2020 & 2033
- Table 34: Mexico Manganese Market Volume (K Tons) Forecast, by Application 2020 & 2033
- Table 35: Global Manganese Market Revenue Billion Forecast, by Application 2020 & 2033
- Table 36: Global Manganese Market Volume K Tons Forecast, by Application 2020 & 2033
- Table 37: Global Manganese Market Revenue Billion Forecast, by End-use Sector 2020 & 2033
- Table 38: Global Manganese Market Volume K Tons Forecast, by End-use Sector 2020 & 2033
- Table 39: Global Manganese Market Revenue Billion Forecast, by Country 2020 & 2033
- Table 40: Global Manganese Market Volume K Tons Forecast, by Country 2020 & 2033
- Table 41: Germany Manganese Market Revenue (Billion) Forecast, by Application 2020 & 2033
- Table 42: Germany Manganese Market Volume (K Tons) Forecast, by Application 2020 & 2033
- Table 43: United Kingdom Manganese Market Revenue (Billion) Forecast, by Application 2020 & 2033
- Table 44: United Kingdom Manganese Market Volume (K Tons) Forecast, by Application 2020 & 2033
- Table 45: Italy Manganese Market Revenue (Billion) Forecast, by Application 2020 & 2033
- Table 46: Italy Manganese Market Volume (K Tons) Forecast, by Application 2020 & 2033
- Table 47: France Manganese Market Revenue (Billion) Forecast, by Application 2020 & 2033
- Table 48: France Manganese Market Volume (K Tons) Forecast, by Application 2020 & 2033
- Table 49: Rest of Europe Manganese Market Revenue (Billion) Forecast, by Application 2020 & 2033
- Table 50: Rest of Europe Manganese Market Volume (K Tons) Forecast, by Application 2020 & 2033
- Table 51: Global Manganese Market Revenue Billion Forecast, by Application 2020 & 2033
- Table 52: Global Manganese Market Volume K Tons Forecast, by Application 2020 & 2033
- Table 53: Global Manganese Market Revenue Billion Forecast, by End-use Sector 2020 & 2033
- Table 54: Global Manganese Market Volume K Tons Forecast, by End-use Sector 2020 & 2033
- Table 55: Global Manganese Market Revenue Billion Forecast, by Country 2020 & 2033
- Table 56: Global Manganese Market Volume K Tons Forecast, by Country 2020 & 2033
- Table 57: Brazil Manganese Market Revenue (Billion) Forecast, by Application 2020 & 2033
- Table 58: Brazil Manganese Market Volume (K Tons) Forecast, by Application 2020 & 2033
- Table 59: Argentina Manganese Market Revenue (Billion) Forecast, by Application 2020 & 2033
- Table 60: Argentina Manganese Market Volume (K Tons) Forecast, by Application 2020 & 2033
- Table 61: Rest of South America Manganese Market Revenue (Billion) Forecast, by Application 2020 & 2033
- Table 62: Rest of South America Manganese Market Volume (K Tons) Forecast, by Application 2020 & 2033
- Table 63: Global Manganese Market Revenue Billion Forecast, by Application 2020 & 2033
- Table 64: Global Manganese Market Volume K Tons Forecast, by Application 2020 & 2033
- Table 65: Global Manganese Market Revenue Billion Forecast, by End-use Sector 2020 & 2033
- Table 66: Global Manganese Market Volume K Tons Forecast, by End-use Sector 2020 & 2033
- Table 67: Global Manganese Market Revenue Billion Forecast, by Country 2020 & 2033
- Table 68: Global Manganese Market Volume K Tons Forecast, by Country 2020 & 2033
- Table 69: Saudi Arabia Manganese Market Revenue (Billion) Forecast, by Application 2020 & 2033
- Table 70: Saudi Arabia Manganese Market Volume (K Tons) Forecast, by Application 2020 & 2033
- Table 71: South Africa Manganese Market Revenue (Billion) Forecast, by Application 2020 & 2033
- Table 72: South Africa Manganese Market Volume (K Tons) Forecast, by Application 2020 & 2033
- Table 73: Rest of Middle East and Africa Manganese Market Revenue (Billion) Forecast, by Application 2020 & 2033
- Table 74: Rest of Middle East and Africa Manganese Market Volume (K Tons) Forecast, by Application 2020 & 2033
Frequently Asked Questions
1. What is the projected Compound Annual Growth Rate (CAGR) of the Manganese Market?
The projected CAGR is approximately 5%.
2. Which companies are prominent players in the Manganese Market?
Key companies in the market include BHP, MOIL LIMITED, Tata Steel, Vale, Carus Group Inc, Jupiter Mines Limited, Sibelco, Mesa Minerals Limited, NIPPON DENKO CO LTD, Ningxia Tianyuan Manganese Industry Group Co Ltd, Eramet, Anglo American PLC, Assore Limited (Assmang Proprietary Limited).
3. What are the main segments of the Manganese Market?
The market segments include Application, End-use Sector.
4. Can you provide details about the market size?
The market size is estimated to be USD 24.4 Billion as of 2022.
5. What are some drivers contributing to market growth?
Increasing Demand of Electric Vehicles; Other Drivers.
6. What are the notable trends driving market growth?
Increasing Demand from Construction Sector.
7. Are there any restraints impacting market growth?
Other Restraints.
8. Can you provide examples of recent developments in the market?
In August 2020, South32 Ltd. announced that it would sell its entire stake in the manganese alloy smelter, Tasmanian Electro Metallurgical Company (TEMCO) to UK-based conglomerate GFG Alliance and thereby enhancing the business of GFG Alliance.
9. What pricing options are available for accessing the report?
Pricing options include single-user, multi-user, and enterprise licenses priced at USD 4750, USD 5250, and USD 8750 respectively.
10. Is the market size provided in terms of value or volume?
The market size is provided in terms of value, measured in Billion and volume, measured in K Tons.
11. Are there any specific market keywords associated with the report?
Yes, the market keyword associated with the report is "Manganese Market," which aids in identifying and referencing the specific market segment covered.
12. How do I determine which pricing option suits my needs best?
The pricing options vary based on user requirements and access needs. Individual users may opt for single-user licenses, while businesses requiring broader access may choose multi-user or enterprise licenses for cost-effective access to the report.
13. Are there any additional resources or data provided in the Manganese Market report?
While the report offers comprehensive insights, it's advisable to review the specific contents or supplementary materials provided to ascertain if additional resources or data are available.
14. How can I stay updated on further developments or reports in the Manganese Market?
To stay informed about further developments, trends, and reports in the Manganese Market, consider subscribing to industry newsletters, following relevant companies and organizations, or regularly checking reputable industry news sources and publications.
Methodology
Step 1 - Identification of Relevant Samples Size from Population Database


Step 2 - Approaches for Defining Global Market Size (Value, Volume* & Price*)

Note*: In applicable scenarios
Step 3 - Data Sources
Primary Research
- Web Analytics
- Survey Reports
- Research Institute
- Latest Research Reports
- Opinion Leaders
Secondary Research
- Annual Reports
- White Paper
- Latest Press Release
- Industry Association
- Paid Database
- Investor Presentations

Step 4 - Data Triangulation
Involves using different sources of information in order to increase the validity of a study
These sources are likely to be stakeholders in a program - participants, other researchers, program staff, other community members, and so on.
Then we put all data in single framework & apply various statistical tools to find out the dynamic on the market.
During the analysis stage, feedback from the stakeholder groups would be compared to determine areas of agreement as well as areas of divergence