

Key Insights
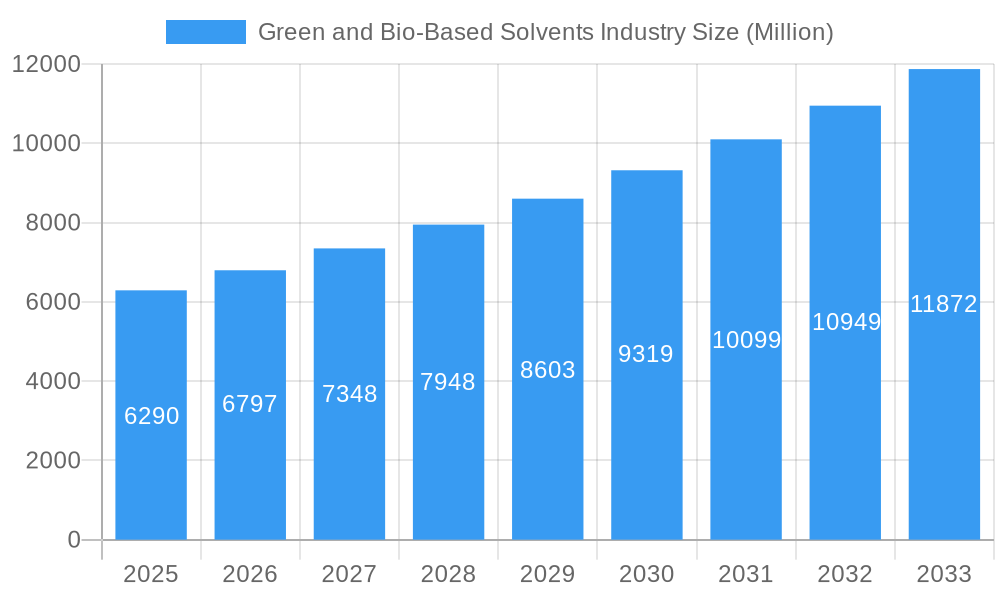
The global Green and Bio-Based Solvents market is poised for substantial growth, projected to reach an estimated USD 6.29 billion in 2025 with an impressive Compound Annual Growth Rate (CAGR) of 8.15%. This upward trajectory is driven by increasing environmental regulations, a growing consumer preference for sustainable products, and the inherent benefits of bio-based solvents, such as lower toxicity and biodegradability, compared to their petrochemical counterparts. The demand is further fueled by burgeoning industries like Paints and Coatings, Industrial and Domestic Cleaning, and Cosmetics, all actively seeking eco-friendly alternatives. Asia Pacific, with its rapidly industrializing economies and growing environmental awareness, is expected to emerge as a dominant region. The market's expansion is also supported by significant investments in research and development by key players like Cargill, ADM, and Dow, focusing on innovative bio-solvent production technologies and expanding their product portfolios to meet diverse application needs.
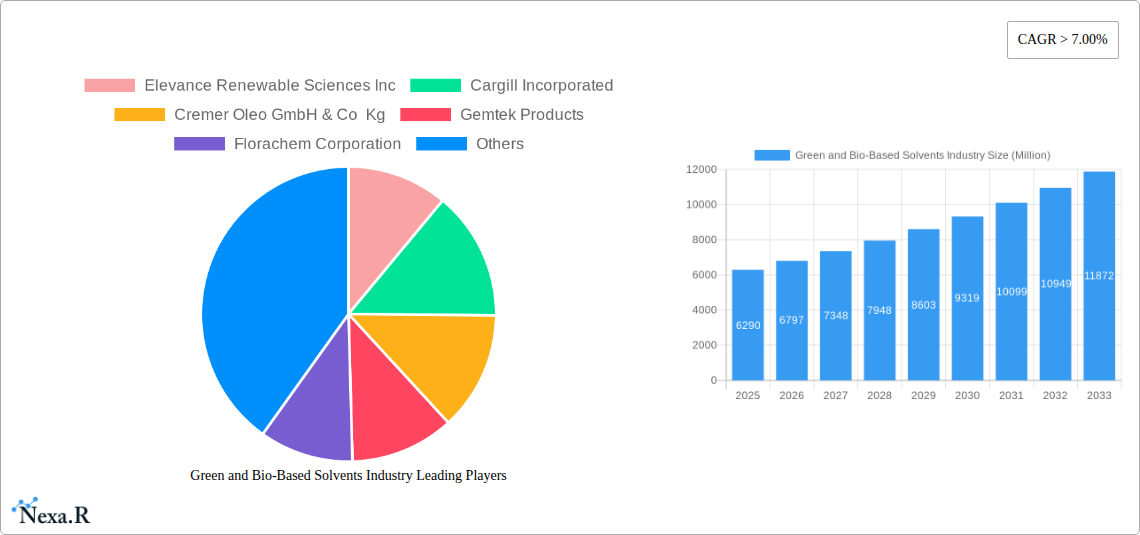
Green and Bio-Based Solvents Industry Market Size (In Billion)
The market's segmentation reveals a strong presence of Bio-alcohols, particularly bio-ethanol and bio-butanol, as well as bio-glycols, which are gaining traction due to their versatile applications. Ethyl lactate and D-limonene are also emerging as significant segments, offering unique properties for specialized uses. While growth is robust, certain restraints such as the higher initial cost of production for some bio-solvents and potential supply chain volatilities can pose challenges. However, ongoing technological advancements, increasing economies of scale, and strategic collaborations among market participants are expected to mitigate these factors. The forecast period (2025-2033) indicates continued market expansion, driven by continuous innovation in bio-derived feedstock utilization and the development of novel bio-solvent formulations to cater to an ever-wider array of industrial and consumer applications, solidifying the transition towards a greener chemical industry.
Green and Bio-Based Solvents Industry Company Market Share
This in-depth report provides a detailed analysis of the global Green and Bio-Based Solvents Industry, offering critical insights into market dynamics, growth trends, and future opportunities. Covering the period from 2019 to 2033, with a base year of 2025, this report is an essential resource for stakeholders seeking to navigate the evolving landscape of sustainable chemical solutions. We delve into parent and child market segments, offering a holistic view of market penetration and potential.
Green and Bio-Based Solvents Industry Market Dynamics & Structure
The Green and Bio-Based Solvents Market exhibits a moderately concentrated structure, with leading players like Dow, Archer Daniels Midland Company (ADM), and Corbion NV holding significant shares. Technological innovation is a primary driver, fueled by increasing R&D investments in developing novel bio-solvents with enhanced performance and reduced environmental impact. Regulatory frameworks, particularly in North America and Europe, are increasingly mandating the use of bio-based alternatives, stimulating market growth. Competitive product substitutes, such as petroleum-based solvents, pose a challenge, but advancements in bio-solvent performance are steadily closing the gap. End-user demographics are shifting towards environmentally conscious consumers and industries seeking sustainable supply chains. Mergers and acquisitions (M&A) are an active area, with companies strategically consolidating to enhance their product portfolios and market reach. Notable M&A activities in recent years have seen significant investments aimed at scaling up production and expanding geographical presence, underscoring the industry's consolidation trajectory. The market concentration, while present, is tempered by a growing number of specialized bio-solvent producers.
- Market Concentration: Moderately concentrated with a mix of large multinational corporations and specialized bio-solvent manufacturers.
- Technological Innovation Drivers: Focus on enhanced biodegradability, reduced toxicity, improved solvency power, and cost-competitiveness.
- Regulatory Frameworks: Stringent environmental regulations in developed economies promoting sustainable alternatives.
- Competitive Product Substitutes: Petroleum-based solvents are a major competitor, but performance parity and cost reduction are improving for bio-solvents.
- End-User Demographics: Growing demand from industries with strong sustainability commitments, including paints and coatings, personal care, and cleaning products.
- M&A Trends: Strategic acquisitions and partnerships to gain access to new technologies, markets, and feedstock.
Green and Bio-Based Solvents Industry Growth Trends & Insights
The Green and Bio-Based Solvents Industry is poised for robust expansion, driven by an increasing global emphasis on sustainability and circular economy principles. The market size is projected to reach $XX billion by 2033, with a Compound Annual Growth Rate (CAGR) of approximately XX% during the forecast period (2025-2033). Adoption rates are steadily rising as industries recognize the environmental and health benefits associated with bio-based alternatives, including reduced volatile organic compound (VOC) emissions and improved biodegradability. Technological disruptions are playing a crucial role, with advancements in biomass conversion and fermentation processes leading to the cost-effective production of a wider range of bio-solvents. Consumer behavior shifts towards eco-friendly products are compelling manufacturers across various sectors to incorporate sustainable ingredients, thereby accelerating the demand for green solvents. Market penetration is currently highest in developed regions with stringent environmental regulations, but emerging economies are showing significant growth potential. The transition from traditional solvents to bio-based alternatives is not just an environmental imperative but also an economic opportunity, as companies aim to enhance their brand image and comply with evolving consumer preferences. The year-on-year market growth is indicative of a significant paradigm shift in chemical manufacturing and consumption.
- Market Size Evolution: Projected to reach $XX billion by 2033, indicating substantial growth.
- Adoption Rates: Steadily increasing across diverse industries due to environmental benefits and regulatory push.
- Technological Disruptions: Innovations in bio-production methods enhancing efficiency and reducing costs.
- Consumer Behavior Shifts: Growing preference for sustainable and natural products influencing industrial choices.
- CAGR: Estimated at XX% for the forecast period, highlighting a dynamic growth trajectory.
- Market Penetration: Higher in established markets, with strong potential for expansion in developing economies.
Dominant Regions, Countries, or Segments in Green and Bio-Based Solvents Industry
The Green and Bio-Based Solvents Industry is currently dominated by Bio-alcohols, particularly Bio-ethanol and Bio-butanol, which represent a substantial market share within the parent market. North America and Europe are the leading regions, driven by stringent environmental regulations, a strong focus on R&D, and a well-established bio-economy infrastructure. The Paints and Coatings and Industrial and Domestic Cleaning application segments are significant contributors to this dominance, owing to the increasing demand for low-VOC and biodegradable formulations. Economic policies supporting bio-based industries, such as tax incentives and subsidies, coupled with government initiatives promoting sustainable procurement, are key drivers of this regional and segment leadership.
In North America, countries like the United States are at the forefront, leveraging their agricultural resources for bio-feedstock production. Europe's commitment to the circular economy and its ambitious climate targets further bolster its position. The dominance of Bio-alcohols is further amplified by their versatility as solvents and their established production pathways. Within the Type segment, Bio-alcohols' broad applicability and relatively mature production technologies make them the largest category. Similarly, for Application, the widespread use of solvents in paints, coatings, and cleaning products ensures these segments lead the market. The growth potential for these dominant segments remains high, as innovations continue to expand their utility and cost-effectiveness. Market share within these dominant segments is influenced by feedstock availability, production capacity, and the ability of manufacturers to meet specific performance requirements for diverse applications.
- Dominant Segment (Type): Bio-alcohols (Bio-ethanol, Bio-butanol)
- Key Drivers: Versatility, established production, environmental benefits, and cost-effectiveness.
- Market Share: Significant portion of the overall bio-solvents market.
- Dominant Segment (Application): Paints and Coatings, Industrial and Domestic Cleaning
- Key Drivers: Regulatory push for low-VOC, demand for eco-friendly products, and widespread industrial use.
- Market Share: Largest application segments driving demand.
- Dominant Region: North America and Europe
- Key Drivers: Strict environmental regulations, supportive government policies, robust R&D, and established bio-economy.
- Growth Potential: Continued leadership with ongoing innovation and policy support.
- Country Examples: United States (North America), Germany, France (Europe).
Green and Bio-Based Solvents Industry Product Landscape
The Green and Bio-Based Solvents Industry is characterized by a dynamic product landscape featuring innovations in both established and emerging bio-solvents. Bio-alcohols like bio-ethanol and bio-butanol offer excellent solvency and biodegradability, finding applications in paints, coatings, and printing inks. Bio-glycols, such as bio-based propylene glycol, are gaining traction in cosmetics and pharmaceuticals due to their safety profile and moisturizing properties. Ethyl lactate, derived from fermentation, is a high-performance solvent for industrial cleaning and electronics. D-limonene, extracted from citrus peels, is a popular bio-solvent for degreasing and surface cleaning, prized for its pleasant aroma and low toxicity. Methyl soyate, a derivative of soybean oil, is an effective and biodegradable solvent used in household cleaners and agricultural formulations. Unique selling propositions include reduced toxicity, lower VOC emissions, biodegradability, and a sustainable origin. Technological advancements are focused on improving extraction efficiencies, developing novel fermentation strains for higher yields, and tailoring solvent properties for specific end-use requirements.
Key Drivers, Barriers & Challenges in Green and Bio-Based Solvents Industry
Key Drivers:
- Environmental Regulations: Growing global mandates for reduced VOC emissions and hazardous substances propel the adoption of green solvents.
- Sustainability Initiatives: Corporate social responsibility and consumer demand for eco-friendly products are significant market accelerators.
- Technological Advancements: Innovations in bio-production and feedstock utilization are enhancing performance and reducing costs.
- Feedstock Availability: Abundant and diverse bio-renewable resources provide a sustainable basis for solvent production.
- Health and Safety Concerns: Lower toxicity and improved biodegradability offer safer alternatives to conventional solvents.
Barriers & Challenges:
- Cost Competitiveness: Bio-based solvents can still be more expensive than their petroleum-based counterparts, impacting widespread adoption.
- Scalability of Production: Large-scale, cost-efficient production of certain bio-solvents faces challenges in feedstock sourcing and processing.
- Performance Parity: In some niche applications, achieving the same level of performance as conventional solvents can be a hurdle.
- Supply Chain Volatility: Dependence on agricultural output can lead to fluctuations in feedstock availability and pricing.
- Consumer and Industrial Inertia: The established use of conventional solvents can create resistance to adopting new technologies.
- Regulatory Harmonization: Divergent regulations across different regions can create market access complexities.
Emerging Opportunities in Green and Bio-Based Solvents Industry
Emerging opportunities within the Green and Bio-Based Solvents Industry lie in the development of next-generation bio-solvents with superior performance characteristics and novel applications. Untapped markets in developing economies present significant growth potential as environmental awareness and regulatory frameworks evolve. The increasing demand for bio-based ingredients in the pharmaceutical and cosmetic sectors, driven by consumer preference for natural and safe products, offers a substantial avenue for expansion. Furthermore, the development of bio-solvents derived from waste biomass and agricultural by-products presents an innovative approach to sustainable sourcing and waste valorization. The focus on highly specialized, performance-driven bio-solvents tailored for niche applications, such as advanced electronics manufacturing or specialized coatings, is another promising area for innovation and market penetration.
Growth Accelerators in the Green and Bio-Based Solvents Industry Industry
Long-term growth in the Green and Bio-Based Solvents Industry will be significantly accelerated by continued breakthroughs in biotechnology, particularly in enzyme engineering and microbial fermentation, to enhance the efficiency and cost-effectiveness of bio-solvent production. Strategic partnerships between feedstock suppliers, solvent manufacturers, and end-users are crucial for establishing robust and reliable supply chains and fostering co-innovation. Market expansion strategies, including geographical diversification into rapidly developing economies and the development of novel bio-solvent blends for specific industrial needs, will further drive growth. The increasing integration of bio-solvents into circular economy models, where waste streams are utilized as feedstock, will also contribute to sustained expansion and market dominance.
Key Players Shaping the Green and Bio-Based Solvents Industry Market
- Elevance Renewable Sciences Inc
- Cargill Incorporated
- Cremer Oleo GmbH & Co Kg
- Gemtek Products
- Florachem Corporation
- Archer Daniels Midland Company (ADM)
- BioAmber Inc
- Bio Brands LLC
- Vertec BioSolvents
- Dow
- Galactic
- Florida Chemical Company
- Corbion NV
- LyondellBasell Industries Holdings BV
- Gevo
Notable Milestones in Green and Bio-Based Solvents Industry Sector
- 2023: Launch of new bio-based solvent formulations with enhanced biodegradability and reduced VOC content by leading manufacturers.
- 2022: Significant investment in bio-refinery technologies to scale up production of bio-alcohols and bio-glycols.
- 2021: Increased regulatory pressure and consumer demand led to greater adoption of ethyl lactate in industrial cleaning applications.
- 2020: Advancements in enzyme technology enabled more cost-effective conversion of biomass into bio-solvents.
- 2019: Strategic partnerships formed to secure sustainable feedstock sources for bio-solvent production.
In-Depth Green and Bio-Based Solvents Industry Market Outlook
The future outlook for the Green and Bio-Based Solvents Industry is exceptionally promising, driven by a confluence of environmental imperatives, technological innovation, and evolving market demands. Growth accelerators, including advanced bio-production technologies and strategic industry collaborations, are set to unlock new market segments and enhance cost-competitiveness. The industry is on track for substantial growth, with significant opportunities in emerging economies and specialized application areas. Companies that prioritize innovation, sustainability, and supply chain resilience will be well-positioned to capitalize on the burgeoning demand for eco-friendly chemical solutions, solidifying the industry's pivotal role in a sustainable future.
Green and Bio-Based Solvents Industry Segmentation
-
1. Type
-
1.1. Bio-alcohols
- 1.1.1. Bio-ethanol
- 1.1.2. Bio-methanol
- 1.1.3. Bio-propanol
- 1.1.4. Bio-butanol
-
1.2. Bio-glycols
- 1.2.1. Bio-based Propylene Glycol
- 1.2.2. Bio-based Ethylene Glycol
- 1.3. Bio-diols
- 1.4. Ethyl Lactate
- 1.5. D-limonene
- 1.6. Methyl Soyate
- 1.7. Other Types
-
1.1. Bio-alcohols
-
2. Application
- 2.1. Paints and Coatings
- 2.2. Industrial and Domestic Cleaning
- 2.3. Printing Inks
- 2.4. Adhesives and Sealants
- 2.5. Pharmaceutical
- 2.6. Cosmetics
- 2.7. Agriculture
- 2.8. Other Applications
Green and Bio-Based Solvents Industry Segmentation By Geography
-
1. Asia Pacific
- 1.1. China
- 1.2. India
- 1.3. Japan
- 1.4. South Korea
- 1.5. Rest of Asia Pacific
-
2. North America
- 2.1. United States
- 2.2. Canada
- 2.3. Mexico
-
3. Europe
- 3.1. Germany
- 3.2. United Kingdom
- 3.3. Italy
- 3.4. France
- 3.5. Rest of Europe
-
4. South America
- 4.1. Brazil
- 4.2. Argentina
- 4.3. Rest of South America
-
5. Middle East and Africa
- 5.1. Saudi Arabia
- 5.2. South Africa
- 5.3. Rest of Middle East and Africa
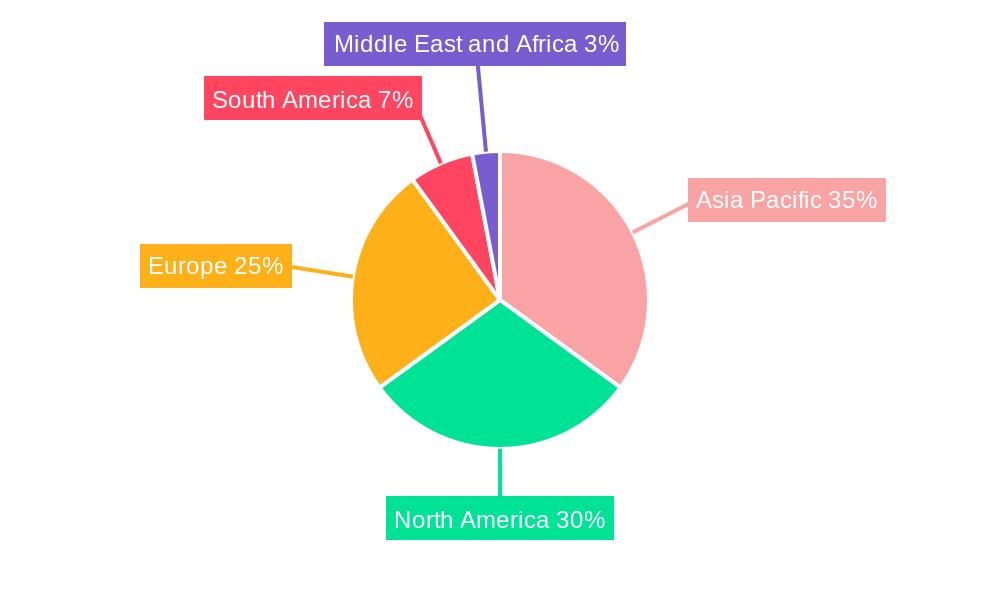
Green and Bio-Based Solvents Industry Regional Market Share
Geographic Coverage of Green and Bio-Based Solvents Industry
Green and Bio-Based Solvents Industry REPORT HIGHLIGHTS
| Aspects | Details |
|---|---|
| Study Period | 2020-2034 |
| Base Year | 2025 |
| Estimated Year | 2026 |
| Forecast Period | 2026-2034 |
| Historical Period | 2020-2025 |
| Growth Rate | CAGR of 8.15% from 2020-2034 |
| Segmentation |
|
Table of Contents
- 1. Introduction
- 1.1. Research Scope
- 1.2. Market Segmentation
- 1.3. Research Objective
- 1.4. Definitions and Assumptions
- 2. Executive Summary
- 2.1. Market Snapshot
- 3. Market Dynamics
- 3.1. Market Drivers
- 3.2. Market Restrains
- 3.3. Market Trends
- 3.4. Market Opportunities
- 4. Market Factor Analysis
- 4.1. Porters Five Forces
- 4.1.1. Bargaining Power of Suppliers
- 4.1.2. Bargaining Power of Buyers
- 4.1.3. Threat of New Entrants
- 4.1.4. Threat of Substitutes
- 4.1.5. Competitive Rivalry
- 4.2. PESTEL analysis
- 4.3. BCG Analysis
- 4.3.1. Stars (High Growth, High Market Share)
- 4.3.2. Cash Cows (Low Growth, High Market Share)
- 4.3.3. Question Mark (High Growth, Low Market Share)
- 4.3.4. Dogs (Low Growth, Low Market Share)
- 4.4. Ansoff Matrix Analysis
- 4.5. Supply Chain Analysis
- 4.6. Regulatory Landscape
- 4.7. Current Market Potential and Opportunity Assessment (TAM–SAM–SOM Framework)
- 4.8. NRP Analyst Note
- 4.1. Porters Five Forces
- 5. Market Analysis, Insights and Forecast 2021-2033
- 5.1. Market Analysis, Insights and Forecast - by Type
- 5.1.1. Bio-alcohols
- 5.1.1.1. Bio-ethanol
- 5.1.1.2. Bio-methanol
- 5.1.1.3. Bio-propanol
- 5.1.1.4. Bio-butanol
- 5.1.2. Bio-glycols
- 5.1.2.1. Bio-based Propylene Glycol
- 5.1.2.2. Bio-based Ethylene Glycol
- 5.1.3. Bio-diols
- 5.1.4. Ethyl Lactate
- 5.1.5. D-limonene
- 5.1.6. Methyl Soyate
- 5.1.7. Other Types
- 5.1.1. Bio-alcohols
- 5.2. Market Analysis, Insights and Forecast - by Application
- 5.2.1. Paints and Coatings
- 5.2.2. Industrial and Domestic Cleaning
- 5.2.3. Printing Inks
- 5.2.4. Adhesives and Sealants
- 5.2.5. Pharmaceutical
- 5.2.6. Cosmetics
- 5.2.7. Agriculture
- 5.2.8. Other Applications
- 5.3. Market Analysis, Insights and Forecast - by Region
- 5.3.1. Asia Pacific
- 5.3.2. North America
- 5.3.3. Europe
- 5.3.4. South America
- 5.3.5. Middle East and Africa
- 5.1. Market Analysis, Insights and Forecast - by Type
- 6. Global Green and Bio-Based Solvents Industry Analysis, Insights and Forecast, 2021-2033
- 6.1. Market Analysis, Insights and Forecast - by Type
- 6.1.1. Bio-alcohols
- 6.1.1.1. Bio-ethanol
- 6.1.1.2. Bio-methanol
- 6.1.1.3. Bio-propanol
- 6.1.1.4. Bio-butanol
- 6.1.2. Bio-glycols
- 6.1.2.1. Bio-based Propylene Glycol
- 6.1.2.2. Bio-based Ethylene Glycol
- 6.1.3. Bio-diols
- 6.1.4. Ethyl Lactate
- 6.1.5. D-limonene
- 6.1.6. Methyl Soyate
- 6.1.7. Other Types
- 6.1.1. Bio-alcohols
- 6.2. Market Analysis, Insights and Forecast - by Application
- 6.2.1. Paints and Coatings
- 6.2.2. Industrial and Domestic Cleaning
- 6.2.3. Printing Inks
- 6.2.4. Adhesives and Sealants
- 6.2.5. Pharmaceutical
- 6.2.6. Cosmetics
- 6.2.7. Agriculture
- 6.2.8. Other Applications
- 6.1. Market Analysis, Insights and Forecast - by Type
- 7. Asia Pacific Green and Bio-Based Solvents Industry Analysis, Insights and Forecast, 2020-2032
- 7.1. Market Analysis, Insights and Forecast - by Type
- 7.1.1. Bio-alcohols
- 7.1.1.1. Bio-ethanol
- 7.1.1.2. Bio-methanol
- 7.1.1.3. Bio-propanol
- 7.1.1.4. Bio-butanol
- 7.1.2. Bio-glycols
- 7.1.2.1. Bio-based Propylene Glycol
- 7.1.2.2. Bio-based Ethylene Glycol
- 7.1.3. Bio-diols
- 7.1.4. Ethyl Lactate
- 7.1.5. D-limonene
- 7.1.6. Methyl Soyate
- 7.1.7. Other Types
- 7.1.1. Bio-alcohols
- 7.2. Market Analysis, Insights and Forecast - by Application
- 7.2.1. Paints and Coatings
- 7.2.2. Industrial and Domestic Cleaning
- 7.2.3. Printing Inks
- 7.2.4. Adhesives and Sealants
- 7.2.5. Pharmaceutical
- 7.2.6. Cosmetics
- 7.2.7. Agriculture
- 7.2.8. Other Applications
- 7.1. Market Analysis, Insights and Forecast - by Type
- 8. North America Green and Bio-Based Solvents Industry Analysis, Insights and Forecast, 2020-2032
- 8.1. Market Analysis, Insights and Forecast - by Type
- 8.1.1. Bio-alcohols
- 8.1.1.1. Bio-ethanol
- 8.1.1.2. Bio-methanol
- 8.1.1.3. Bio-propanol
- 8.1.1.4. Bio-butanol
- 8.1.2. Bio-glycols
- 8.1.2.1. Bio-based Propylene Glycol
- 8.1.2.2. Bio-based Ethylene Glycol
- 8.1.3. Bio-diols
- 8.1.4. Ethyl Lactate
- 8.1.5. D-limonene
- 8.1.6. Methyl Soyate
- 8.1.7. Other Types
- 8.1.1. Bio-alcohols
- 8.2. Market Analysis, Insights and Forecast - by Application
- 8.2.1. Paints and Coatings
- 8.2.2. Industrial and Domestic Cleaning
- 8.2.3. Printing Inks
- 8.2.4. Adhesives and Sealants
- 8.2.5. Pharmaceutical
- 8.2.6. Cosmetics
- 8.2.7. Agriculture
- 8.2.8. Other Applications
- 8.1. Market Analysis, Insights and Forecast - by Type
- 9. Europe Green and Bio-Based Solvents Industry Analysis, Insights and Forecast, 2020-2032
- 9.1. Market Analysis, Insights and Forecast - by Type
- 9.1.1. Bio-alcohols
- 9.1.1.1. Bio-ethanol
- 9.1.1.2. Bio-methanol
- 9.1.1.3. Bio-propanol
- 9.1.1.4. Bio-butanol
- 9.1.2. Bio-glycols
- 9.1.2.1. Bio-based Propylene Glycol
- 9.1.2.2. Bio-based Ethylene Glycol
- 9.1.3. Bio-diols
- 9.1.4. Ethyl Lactate
- 9.1.5. D-limonene
- 9.1.6. Methyl Soyate
- 9.1.7. Other Types
- 9.1.1. Bio-alcohols
- 9.2. Market Analysis, Insights and Forecast - by Application
- 9.2.1. Paints and Coatings
- 9.2.2. Industrial and Domestic Cleaning
- 9.2.3. Printing Inks
- 9.2.4. Adhesives and Sealants
- 9.2.5. Pharmaceutical
- 9.2.6. Cosmetics
- 9.2.7. Agriculture
- 9.2.8. Other Applications
- 9.1. Market Analysis, Insights and Forecast - by Type
- 10. South America Green and Bio-Based Solvents Industry Analysis, Insights and Forecast, 2020-2032
- 10.1. Market Analysis, Insights and Forecast - by Type
- 10.1.1. Bio-alcohols
- 10.1.1.1. Bio-ethanol
- 10.1.1.2. Bio-methanol
- 10.1.1.3. Bio-propanol
- 10.1.1.4. Bio-butanol
- 10.1.2. Bio-glycols
- 10.1.2.1. Bio-based Propylene Glycol
- 10.1.2.2. Bio-based Ethylene Glycol
- 10.1.3. Bio-diols
- 10.1.4. Ethyl Lactate
- 10.1.5. D-limonene
- 10.1.6. Methyl Soyate
- 10.1.7. Other Types
- 10.1.1. Bio-alcohols
- 10.2. Market Analysis, Insights and Forecast - by Application
- 10.2.1. Paints and Coatings
- 10.2.2. Industrial and Domestic Cleaning
- 10.2.3. Printing Inks
- 10.2.4. Adhesives and Sealants
- 10.2.5. Pharmaceutical
- 10.2.6. Cosmetics
- 10.2.7. Agriculture
- 10.2.8. Other Applications
- 10.1. Market Analysis, Insights and Forecast - by Type
- 11. Middle East and Africa Green and Bio-Based Solvents Industry Analysis, Insights and Forecast, 2020-2032
- 11.1. Market Analysis, Insights and Forecast - by Type
- 11.1.1. Bio-alcohols
- 11.1.1.1. Bio-ethanol
- 11.1.1.2. Bio-methanol
- 11.1.1.3. Bio-propanol
- 11.1.1.4. Bio-butanol
- 11.1.2. Bio-glycols
- 11.1.2.1. Bio-based Propylene Glycol
- 11.1.2.2. Bio-based Ethylene Glycol
- 11.1.3. Bio-diols
- 11.1.4. Ethyl Lactate
- 11.1.5. D-limonene
- 11.1.6. Methyl Soyate
- 11.1.7. Other Types
- 11.1.1. Bio-alcohols
- 11.2. Market Analysis, Insights and Forecast - by Application
- 11.2.1. Paints and Coatings
- 11.2.2. Industrial and Domestic Cleaning
- 11.2.3. Printing Inks
- 11.2.4. Adhesives and Sealants
- 11.2.5. Pharmaceutical
- 11.2.6. Cosmetics
- 11.2.7. Agriculture
- 11.2.8. Other Applications
- 11.1. Market Analysis, Insights and Forecast - by Type
- 12. Competitive Analysis
- 12.1. Company Profiles
- 12.1.1 Elevance Renewable Sciences Inc
- 12.1.1.1. Company Overview
- 12.1.1.2. Products
- 12.1.1.3. Company Financials
- 12.1.1.4. SWOT Analysis
- 12.1.2 Cargill Incorporated
- 12.1.2.1. Company Overview
- 12.1.2.2. Products
- 12.1.2.3. Company Financials
- 12.1.2.4. SWOT Analysis
- 12.1.3 Cremer Oleo GmbH & Co Kg
- 12.1.3.1. Company Overview
- 12.1.3.2. Products
- 12.1.3.3. Company Financials
- 12.1.3.4. SWOT Analysis
- 12.1.4 Gemtek Products
- 12.1.4.1. Company Overview
- 12.1.4.2. Products
- 12.1.4.3. Company Financials
- 12.1.4.4. SWOT Analysis
- 12.1.5 Florachem Corporation
- 12.1.5.1. Company Overview
- 12.1.5.2. Products
- 12.1.5.3. Company Financials
- 12.1.5.4. SWOT Analysis
- 12.1.6 Archer Daniels Midland Company (ADM)
- 12.1.6.1. Company Overview
- 12.1.6.2. Products
- 12.1.6.3. Company Financials
- 12.1.6.4. SWOT Analysis
- 12.1.7 BioAmber Inc
- 12.1.7.1. Company Overview
- 12.1.7.2. Products
- 12.1.7.3. Company Financials
- 12.1.7.4. SWOT Analysis
- 12.1.8 Bio Brands LLC
- 12.1.8.1. Company Overview
- 12.1.8.2. Products
- 12.1.8.3. Company Financials
- 12.1.8.4. SWOT Analysis
- 12.1.9 Vertec BioSolvents
- 12.1.9.1. Company Overview
- 12.1.9.2. Products
- 12.1.9.3. Company Financials
- 12.1.9.4. SWOT Analysis
- 12.1.10 Dow
- 12.1.10.1. Company Overview
- 12.1.10.2. Products
- 12.1.10.3. Company Financials
- 12.1.10.4. SWOT Analysis
- 12.1.11 Galactic
- 12.1.11.1. Company Overview
- 12.1.11.2. Products
- 12.1.11.3. Company Financials
- 12.1.11.4. SWOT Analysis
- 12.1.12 Florida Chemical Company
- 12.1.12.1. Company Overview
- 12.1.12.2. Products
- 12.1.12.3. Company Financials
- 12.1.12.4. SWOT Analysis
- 12.1.13 Corbion NV
- 12.1.13.1. Company Overview
- 12.1.13.2. Products
- 12.1.13.3. Company Financials
- 12.1.13.4. SWOT Analysis
- 12.1.14 LyondellBasell Industries Holdings BV
- 12.1.14.1. Company Overview
- 12.1.14.2. Products
- 12.1.14.3. Company Financials
- 12.1.14.4. SWOT Analysis
- 12.1.15 Gevo
- 12.1.15.1. Company Overview
- 12.1.15.2. Products
- 12.1.15.3. Company Financials
- 12.1.15.4. SWOT Analysis
- 12.1.1 Elevance Renewable Sciences Inc
- 12.2. Market Entropy
- 12.2.1 Company's Key Areas Served
- 12.2.2 Recent Developments
- 12.3. Company Market Share Analysis 2025
- 12.3.1 Top 5 Companies Market Share Analysis
- 12.3.2 Top 3 Companies Market Share Analysis
- 12.4. List of Potential Customers
- 13. Research Methodology
List of Figures
- Figure 1: Global Green and Bio-Based Solvents Industry Revenue Breakdown (undefined, %) by Region 2025 & 2033
- Figure 2: Global Green and Bio-Based Solvents Industry Volume Breakdown (K Tons, %) by Region 2025 & 2033
- Figure 3: Asia Pacific Green and Bio-Based Solvents Industry Revenue (undefined), by Type 2025 & 2033
- Figure 4: Asia Pacific Green and Bio-Based Solvents Industry Volume (K Tons), by Type 2025 & 2033
- Figure 5: Asia Pacific Green and Bio-Based Solvents Industry Revenue Share (%), by Type 2025 & 2033
- Figure 6: Asia Pacific Green and Bio-Based Solvents Industry Volume Share (%), by Type 2025 & 2033
- Figure 7: Asia Pacific Green and Bio-Based Solvents Industry Revenue (undefined), by Application 2025 & 2033
- Figure 8: Asia Pacific Green and Bio-Based Solvents Industry Volume (K Tons), by Application 2025 & 2033
- Figure 9: Asia Pacific Green and Bio-Based Solvents Industry Revenue Share (%), by Application 2025 & 2033
- Figure 10: Asia Pacific Green and Bio-Based Solvents Industry Volume Share (%), by Application 2025 & 2033
- Figure 11: Asia Pacific Green and Bio-Based Solvents Industry Revenue (undefined), by Country 2025 & 2033
- Figure 12: Asia Pacific Green and Bio-Based Solvents Industry Volume (K Tons), by Country 2025 & 2033
- Figure 13: Asia Pacific Green and Bio-Based Solvents Industry Revenue Share (%), by Country 2025 & 2033
- Figure 14: Asia Pacific Green and Bio-Based Solvents Industry Volume Share (%), by Country 2025 & 2033
- Figure 15: North America Green and Bio-Based Solvents Industry Revenue (undefined), by Type 2025 & 2033
- Figure 16: North America Green and Bio-Based Solvents Industry Volume (K Tons), by Type 2025 & 2033
- Figure 17: North America Green and Bio-Based Solvents Industry Revenue Share (%), by Type 2025 & 2033
- Figure 18: North America Green and Bio-Based Solvents Industry Volume Share (%), by Type 2025 & 2033
- Figure 19: North America Green and Bio-Based Solvents Industry Revenue (undefined), by Application 2025 & 2033
- Figure 20: North America Green and Bio-Based Solvents Industry Volume (K Tons), by Application 2025 & 2033
- Figure 21: North America Green and Bio-Based Solvents Industry Revenue Share (%), by Application 2025 & 2033
- Figure 22: North America Green and Bio-Based Solvents Industry Volume Share (%), by Application 2025 & 2033
- Figure 23: North America Green and Bio-Based Solvents Industry Revenue (undefined), by Country 2025 & 2033
- Figure 24: North America Green and Bio-Based Solvents Industry Volume (K Tons), by Country 2025 & 2033
- Figure 25: North America Green and Bio-Based Solvents Industry Revenue Share (%), by Country 2025 & 2033
- Figure 26: North America Green and Bio-Based Solvents Industry Volume Share (%), by Country 2025 & 2033
- Figure 27: Europe Green and Bio-Based Solvents Industry Revenue (undefined), by Type 2025 & 2033
- Figure 28: Europe Green and Bio-Based Solvents Industry Volume (K Tons), by Type 2025 & 2033
- Figure 29: Europe Green and Bio-Based Solvents Industry Revenue Share (%), by Type 2025 & 2033
- Figure 30: Europe Green and Bio-Based Solvents Industry Volume Share (%), by Type 2025 & 2033
- Figure 31: Europe Green and Bio-Based Solvents Industry Revenue (undefined), by Application 2025 & 2033
- Figure 32: Europe Green and Bio-Based Solvents Industry Volume (K Tons), by Application 2025 & 2033
- Figure 33: Europe Green and Bio-Based Solvents Industry Revenue Share (%), by Application 2025 & 2033
- Figure 34: Europe Green and Bio-Based Solvents Industry Volume Share (%), by Application 2025 & 2033
- Figure 35: Europe Green and Bio-Based Solvents Industry Revenue (undefined), by Country 2025 & 2033
- Figure 36: Europe Green and Bio-Based Solvents Industry Volume (K Tons), by Country 2025 & 2033
- Figure 37: Europe Green and Bio-Based Solvents Industry Revenue Share (%), by Country 2025 & 2033
- Figure 38: Europe Green and Bio-Based Solvents Industry Volume Share (%), by Country 2025 & 2033
- Figure 39: South America Green and Bio-Based Solvents Industry Revenue (undefined), by Type 2025 & 2033
- Figure 40: South America Green and Bio-Based Solvents Industry Volume (K Tons), by Type 2025 & 2033
- Figure 41: South America Green and Bio-Based Solvents Industry Revenue Share (%), by Type 2025 & 2033
- Figure 42: South America Green and Bio-Based Solvents Industry Volume Share (%), by Type 2025 & 2033
- Figure 43: South America Green and Bio-Based Solvents Industry Revenue (undefined), by Application 2025 & 2033
- Figure 44: South America Green and Bio-Based Solvents Industry Volume (K Tons), by Application 2025 & 2033
- Figure 45: South America Green and Bio-Based Solvents Industry Revenue Share (%), by Application 2025 & 2033
- Figure 46: South America Green and Bio-Based Solvents Industry Volume Share (%), by Application 2025 & 2033
- Figure 47: South America Green and Bio-Based Solvents Industry Revenue (undefined), by Country 2025 & 2033
- Figure 48: South America Green and Bio-Based Solvents Industry Volume (K Tons), by Country 2025 & 2033
- Figure 49: South America Green and Bio-Based Solvents Industry Revenue Share (%), by Country 2025 & 2033
- Figure 50: South America Green and Bio-Based Solvents Industry Volume Share (%), by Country 2025 & 2033
- Figure 51: Middle East and Africa Green and Bio-Based Solvents Industry Revenue (undefined), by Type 2025 & 2033
- Figure 52: Middle East and Africa Green and Bio-Based Solvents Industry Volume (K Tons), by Type 2025 & 2033
- Figure 53: Middle East and Africa Green and Bio-Based Solvents Industry Revenue Share (%), by Type 2025 & 2033
- Figure 54: Middle East and Africa Green and Bio-Based Solvents Industry Volume Share (%), by Type 2025 & 2033
- Figure 55: Middle East and Africa Green and Bio-Based Solvents Industry Revenue (undefined), by Application 2025 & 2033
- Figure 56: Middle East and Africa Green and Bio-Based Solvents Industry Volume (K Tons), by Application 2025 & 2033
- Figure 57: Middle East and Africa Green and Bio-Based Solvents Industry Revenue Share (%), by Application 2025 & 2033
- Figure 58: Middle East and Africa Green and Bio-Based Solvents Industry Volume Share (%), by Application 2025 & 2033
- Figure 59: Middle East and Africa Green and Bio-Based Solvents Industry Revenue (undefined), by Country 2025 & 2033
- Figure 60: Middle East and Africa Green and Bio-Based Solvents Industry Volume (K Tons), by Country 2025 & 2033
- Figure 61: Middle East and Africa Green and Bio-Based Solvents Industry Revenue Share (%), by Country 2025 & 2033
- Figure 62: Middle East and Africa Green and Bio-Based Solvents Industry Volume Share (%), by Country 2025 & 2033
List of Tables
- Table 1: Global Green and Bio-Based Solvents Industry Revenue undefined Forecast, by Type 2020 & 2033
- Table 2: Global Green and Bio-Based Solvents Industry Volume K Tons Forecast, by Type 2020 & 2033
- Table 3: Global Green and Bio-Based Solvents Industry Revenue undefined Forecast, by Application 2020 & 2033
- Table 4: Global Green and Bio-Based Solvents Industry Volume K Tons Forecast, by Application 2020 & 2033
- Table 5: Global Green and Bio-Based Solvents Industry Revenue undefined Forecast, by Region 2020 & 2033
- Table 6: Global Green and Bio-Based Solvents Industry Volume K Tons Forecast, by Region 2020 & 2033
- Table 7: Global Green and Bio-Based Solvents Industry Revenue undefined Forecast, by Type 2020 & 2033
- Table 8: Global Green and Bio-Based Solvents Industry Volume K Tons Forecast, by Type 2020 & 2033
- Table 9: Global Green and Bio-Based Solvents Industry Revenue undefined Forecast, by Application 2020 & 2033
- Table 10: Global Green and Bio-Based Solvents Industry Volume K Tons Forecast, by Application 2020 & 2033
- Table 11: Global Green and Bio-Based Solvents Industry Revenue undefined Forecast, by Country 2020 & 2033
- Table 12: Global Green and Bio-Based Solvents Industry Volume K Tons Forecast, by Country 2020 & 2033
- Table 13: China Green and Bio-Based Solvents Industry Revenue (undefined) Forecast, by Application 2020 & 2033
- Table 14: China Green and Bio-Based Solvents Industry Volume (K Tons) Forecast, by Application 2020 & 2033
- Table 15: India Green and Bio-Based Solvents Industry Revenue (undefined) Forecast, by Application 2020 & 2033
- Table 16: India Green and Bio-Based Solvents Industry Volume (K Tons) Forecast, by Application 2020 & 2033
- Table 17: Japan Green and Bio-Based Solvents Industry Revenue (undefined) Forecast, by Application 2020 & 2033
- Table 18: Japan Green and Bio-Based Solvents Industry Volume (K Tons) Forecast, by Application 2020 & 2033
- Table 19: South Korea Green and Bio-Based Solvents Industry Revenue (undefined) Forecast, by Application 2020 & 2033
- Table 20: South Korea Green and Bio-Based Solvents Industry Volume (K Tons) Forecast, by Application 2020 & 2033
- Table 21: Rest of Asia Pacific Green and Bio-Based Solvents Industry Revenue (undefined) Forecast, by Application 2020 & 2033
- Table 22: Rest of Asia Pacific Green and Bio-Based Solvents Industry Volume (K Tons) Forecast, by Application 2020 & 2033
- Table 23: Global Green and Bio-Based Solvents Industry Revenue undefined Forecast, by Type 2020 & 2033
- Table 24: Global Green and Bio-Based Solvents Industry Volume K Tons Forecast, by Type 2020 & 2033
- Table 25: Global Green and Bio-Based Solvents Industry Revenue undefined Forecast, by Application 2020 & 2033
- Table 26: Global Green and Bio-Based Solvents Industry Volume K Tons Forecast, by Application 2020 & 2033
- Table 27: Global Green and Bio-Based Solvents Industry Revenue undefined Forecast, by Country 2020 & 2033
- Table 28: Global Green and Bio-Based Solvents Industry Volume K Tons Forecast, by Country 2020 & 2033
- Table 29: United States Green and Bio-Based Solvents Industry Revenue (undefined) Forecast, by Application 2020 & 2033
- Table 30: United States Green and Bio-Based Solvents Industry Volume (K Tons) Forecast, by Application 2020 & 2033
- Table 31: Canada Green and Bio-Based Solvents Industry Revenue (undefined) Forecast, by Application 2020 & 2033
- Table 32: Canada Green and Bio-Based Solvents Industry Volume (K Tons) Forecast, by Application 2020 & 2033
- Table 33: Mexico Green and Bio-Based Solvents Industry Revenue (undefined) Forecast, by Application 2020 & 2033
- Table 34: Mexico Green and Bio-Based Solvents Industry Volume (K Tons) Forecast, by Application 2020 & 2033
- Table 35: Global Green and Bio-Based Solvents Industry Revenue undefined Forecast, by Type 2020 & 2033
- Table 36: Global Green and Bio-Based Solvents Industry Volume K Tons Forecast, by Type 2020 & 2033
- Table 37: Global Green and Bio-Based Solvents Industry Revenue undefined Forecast, by Application 2020 & 2033
- Table 38: Global Green and Bio-Based Solvents Industry Volume K Tons Forecast, by Application 2020 & 2033
- Table 39: Global Green and Bio-Based Solvents Industry Revenue undefined Forecast, by Country 2020 & 2033
- Table 40: Global Green and Bio-Based Solvents Industry Volume K Tons Forecast, by Country 2020 & 2033
- Table 41: Germany Green and Bio-Based Solvents Industry Revenue (undefined) Forecast, by Application 2020 & 2033
- Table 42: Germany Green and Bio-Based Solvents Industry Volume (K Tons) Forecast, by Application 2020 & 2033
- Table 43: United Kingdom Green and Bio-Based Solvents Industry Revenue (undefined) Forecast, by Application 2020 & 2033
- Table 44: United Kingdom Green and Bio-Based Solvents Industry Volume (K Tons) Forecast, by Application 2020 & 2033
- Table 45: Italy Green and Bio-Based Solvents Industry Revenue (undefined) Forecast, by Application 2020 & 2033
- Table 46: Italy Green and Bio-Based Solvents Industry Volume (K Tons) Forecast, by Application 2020 & 2033
- Table 47: France Green and Bio-Based Solvents Industry Revenue (undefined) Forecast, by Application 2020 & 2033
- Table 48: France Green and Bio-Based Solvents Industry Volume (K Tons) Forecast, by Application 2020 & 2033
- Table 49: Rest of Europe Green and Bio-Based Solvents Industry Revenue (undefined) Forecast, by Application 2020 & 2033
- Table 50: Rest of Europe Green and Bio-Based Solvents Industry Volume (K Tons) Forecast, by Application 2020 & 2033
- Table 51: Global Green and Bio-Based Solvents Industry Revenue undefined Forecast, by Type 2020 & 2033
- Table 52: Global Green and Bio-Based Solvents Industry Volume K Tons Forecast, by Type 2020 & 2033
- Table 53: Global Green and Bio-Based Solvents Industry Revenue undefined Forecast, by Application 2020 & 2033
- Table 54: Global Green and Bio-Based Solvents Industry Volume K Tons Forecast, by Application 2020 & 2033
- Table 55: Global Green and Bio-Based Solvents Industry Revenue undefined Forecast, by Country 2020 & 2033
- Table 56: Global Green and Bio-Based Solvents Industry Volume K Tons Forecast, by Country 2020 & 2033
- Table 57: Brazil Green and Bio-Based Solvents Industry Revenue (undefined) Forecast, by Application 2020 & 2033
- Table 58: Brazil Green and Bio-Based Solvents Industry Volume (K Tons) Forecast, by Application 2020 & 2033
- Table 59: Argentina Green and Bio-Based Solvents Industry Revenue (undefined) Forecast, by Application 2020 & 2033
- Table 60: Argentina Green and Bio-Based Solvents Industry Volume (K Tons) Forecast, by Application 2020 & 2033
- Table 61: Rest of South America Green and Bio-Based Solvents Industry Revenue (undefined) Forecast, by Application 2020 & 2033
- Table 62: Rest of South America Green and Bio-Based Solvents Industry Volume (K Tons) Forecast, by Application 2020 & 2033
- Table 63: Global Green and Bio-Based Solvents Industry Revenue undefined Forecast, by Type 2020 & 2033
- Table 64: Global Green and Bio-Based Solvents Industry Volume K Tons Forecast, by Type 2020 & 2033
- Table 65: Global Green and Bio-Based Solvents Industry Revenue undefined Forecast, by Application 2020 & 2033
- Table 66: Global Green and Bio-Based Solvents Industry Volume K Tons Forecast, by Application 2020 & 2033
- Table 67: Global Green and Bio-Based Solvents Industry Revenue undefined Forecast, by Country 2020 & 2033
- Table 68: Global Green and Bio-Based Solvents Industry Volume K Tons Forecast, by Country 2020 & 2033
- Table 69: Saudi Arabia Green and Bio-Based Solvents Industry Revenue (undefined) Forecast, by Application 2020 & 2033
- Table 70: Saudi Arabia Green and Bio-Based Solvents Industry Volume (K Tons) Forecast, by Application 2020 & 2033
- Table 71: South Africa Green and Bio-Based Solvents Industry Revenue (undefined) Forecast, by Application 2020 & 2033
- Table 72: South Africa Green and Bio-Based Solvents Industry Volume (K Tons) Forecast, by Application 2020 & 2033
- Table 73: Rest of Middle East and Africa Green and Bio-Based Solvents Industry Revenue (undefined) Forecast, by Application 2020 & 2033
- Table 74: Rest of Middle East and Africa Green and Bio-Based Solvents Industry Volume (K Tons) Forecast, by Application 2020 & 2033
Frequently Asked Questions
1. What is the projected Compound Annual Growth Rate (CAGR) of the Green and Bio-Based Solvents Industry?
The projected CAGR is approximately 8.15%.
2. Which companies are prominent players in the Green and Bio-Based Solvents Industry?
Key companies in the market include Elevance Renewable Sciences Inc, Cargill Incorporated, Cremer Oleo GmbH & Co Kg, Gemtek Products, Florachem Corporation, Archer Daniels Midland Company (ADM), BioAmber Inc, Bio Brands LLC, Vertec BioSolvents, Dow, Galactic, Florida Chemical Company, Corbion NV, LyondellBasell Industries Holdings BV, Gevo.
3. What are the main segments of the Green and Bio-Based Solvents Industry?
The market segments include Type, Application.
4. Can you provide details about the market size?
The market size is estimated to be USD XXX N/A as of 2022.
5. What are some drivers contributing to market growth?
; Stringent Regulation on VOC Emissions and Other Hazardous Air Pollutants; Increasing Market Penetration of Bio-based and Green Solvents in Asia-Pacific.
6. What are the notable trends driving market growth?
Paints and Coatings Segment to Dominate the Market.
7. Are there any restraints impacting market growth?
; Cost and Availability of New Technologies; High Production Cost and Uncertainty Regarding Feedstock Supplies.
8. Can you provide examples of recent developments in the market?
N/A
9. What pricing options are available for accessing the report?
Pricing options include single-user, multi-user, and enterprise licenses priced at USD 4750, USD 5250, and USD 8750 respectively.
10. Is the market size provided in terms of value or volume?
The market size is provided in terms of value, measured in N/A and volume, measured in K Tons.
11. Are there any specific market keywords associated with the report?
Yes, the market keyword associated with the report is "Green and Bio-Based Solvents Industry," which aids in identifying and referencing the specific market segment covered.
12. How do I determine which pricing option suits my needs best?
The pricing options vary based on user requirements and access needs. Individual users may opt for single-user licenses, while businesses requiring broader access may choose multi-user or enterprise licenses for cost-effective access to the report.
13. Are there any additional resources or data provided in the Green and Bio-Based Solvents Industry report?
While the report offers comprehensive insights, it's advisable to review the specific contents or supplementary materials provided to ascertain if additional resources or data are available.
14. How can I stay updated on further developments or reports in the Green and Bio-Based Solvents Industry?
To stay informed about further developments, trends, and reports in the Green and Bio-Based Solvents Industry, consider subscribing to industry newsletters, following relevant companies and organizations, or regularly checking reputable industry news sources and publications.
Methodology
Step 1 - Identification of Relevant Samples Size from Population Database


Step 2 - Approaches for Defining Global Market Size (Value, Volume* & Price*)

Note*: In applicable scenarios
Step 3 - Data Sources
Primary Research
- Web Analytics
- Survey Reports
- Research Institute
- Latest Research Reports
- Opinion Leaders
Secondary Research
- Annual Reports
- White Paper
- Latest Press Release
- Industry Association
- Paid Database
- Investor Presentations

Step 4 - Data Triangulation
Involves using different sources of information in order to increase the validity of a study
These sources are likely to be stakeholders in a program - participants, other researchers, program staff, other community members, and so on.
Then we put all data in single framework & apply various statistical tools to find out the dynamic on the market.
During the analysis stage, feedback from the stakeholder groups would be compared to determine areas of agreement as well as areas of divergence