

Key Insights
The US material handling industry, a cornerstone of efficient logistics and supply chain management, is experiencing robust growth, fueled by the burgeoning e-commerce sector and the increasing automation of warehouses and distribution centers. The market, valued at an estimated $XX million in 2025, is projected to maintain a Compound Annual Growth Rate (CAGR) of 9.31% from 2025 to 2033. This growth is driven by several key factors: the rising demand for faster delivery times, increasing labor costs necessitating automation, and the adoption of advanced technologies like robotics and artificial intelligence to optimize warehouse operations. Specific segments like Automated Guided Vehicles (AGVs) and Autonomous Mobile Robots (AMRs) are experiencing particularly rapid expansion, driven by their ability to enhance efficiency and reduce operational costs. The automotive, food and beverage, and retail/warehousing sectors are significant end-users, contributing substantially to overall market growth. However, challenges remain, including the high initial investment costs associated with advanced automation technologies and the need for skilled labor to operate and maintain these systems. Nevertheless, the long-term outlook for the US material handling industry remains positive, with continued growth anticipated across various segments and end-user verticals.
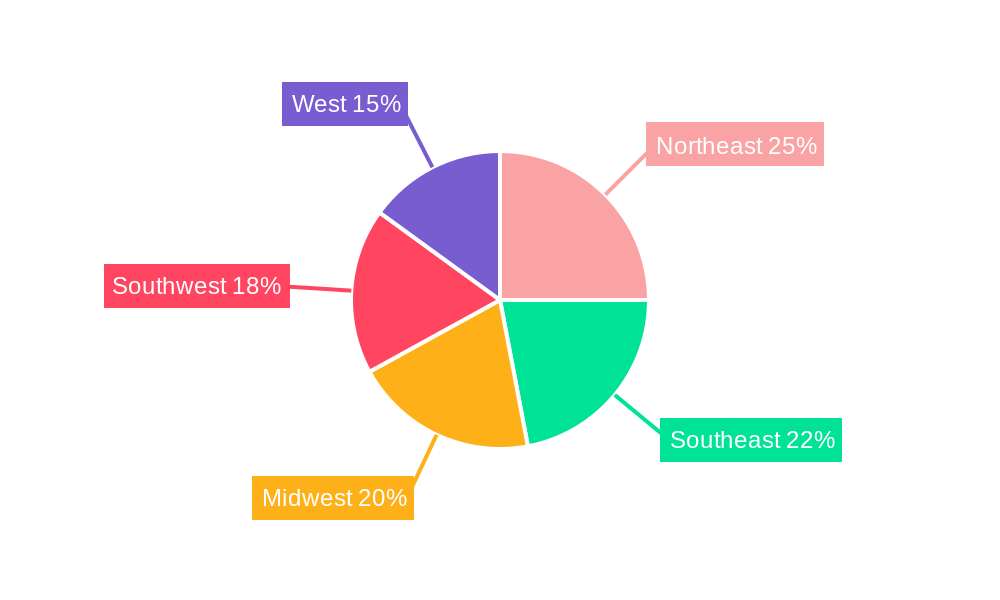
The regional breakdown within the US reveals significant market activity across all regions (Northeast, Southeast, Midwest, Southwest, and West). While precise regional market share data is not provided, it's reasonable to expect a concentration in regions with high population density and established logistics hubs. Further segmentation by product type (hardware, software, services) indicates a diverse market landscape, with software and services increasingly gaining importance alongside the hardware components. Leading companies like Oceaneering International Inc, Westfalia Technologies Inc, and Honeywell Intelligrated are actively shaping the market through innovation and strategic partnerships. The continued evolution of technology, coupled with the ongoing need for efficient supply chain management, suggests a dynamic and expanding future for the US material handling industry. The integration of advanced analytics and data-driven decision-making will further enhance the sector's growth trajectory.
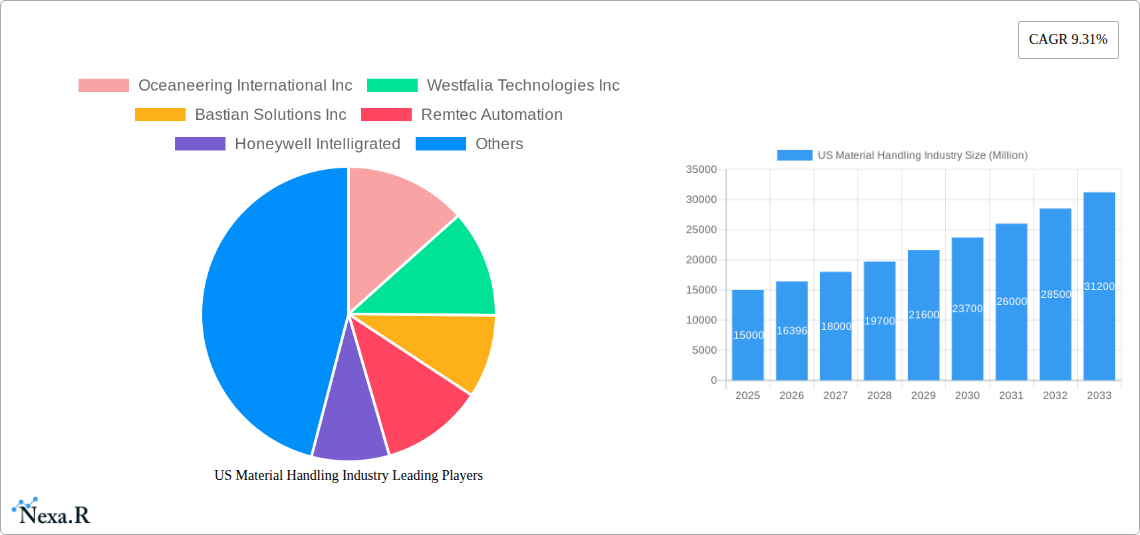
US Material Handling Industry Market Report: 2019-2033
This comprehensive report provides an in-depth analysis of the US material handling industry, offering invaluable insights for businesses, investors, and industry professionals. With a study period spanning 2019-2033, a base year of 2025, and a forecast period of 2025-2033, this report delivers critical data on market size, growth trends, and future projections. The report segments the market by product type (hardware, software, services), equipment type (AGVs, AMRs, ASRS, conveyors, palletizers, sortation systems), and end-user vertical (airport, automotive, food & beverage, retail/warehousing, manufacturing, pharmaceuticals, post & parcel, others), offering a granular understanding of this dynamic sector. Key players like Oceaneering International Inc, Westfalia Technologies Inc, Bastian Solutions Inc, and others are analyzed to reveal market share and competitive dynamics.
US Material Handling Industry Market Dynamics & Structure
The US material handling industry is characterized by a moderately consolidated market structure with a few large players and numerous smaller, specialized firms. Market concentration is influenced by technological advancements, particularly in automation, and the prevalence of mergers and acquisitions (M&A) activity. The regulatory environment, encompassing safety standards and environmental regulations, plays a significant role. The industry faces competitive pressure from product substitutes, particularly in areas where traditional methods are being challenged by innovative automation solutions. End-user demographics, including the rise of e-commerce and changing consumer expectations, are also key drivers.
- Market Concentration: The top 5 players hold an estimated xx% market share in 2025.
- Technological Innovation: Robotics, AI, and IoT are major drivers, but high upfront investment acts as a barrier to entry for some companies.
- M&A Activity: An average of xx M&A deals per year were observed during the historical period (2019-2024). This trend is projected to continue, driven by consolidation and technological acquisition.
- Regulatory Framework: Compliance with OSHA and EPA regulations influences market dynamics and operational costs.
- Competitive Substitutes: Manual handling systems still compete in certain niche areas, but automation is steadily gaining market share.
- End-User Demographics: The growth of e-commerce and the demand for faster delivery times are significant drivers of industry growth.
US Material Handling Industry Growth Trends & Insights
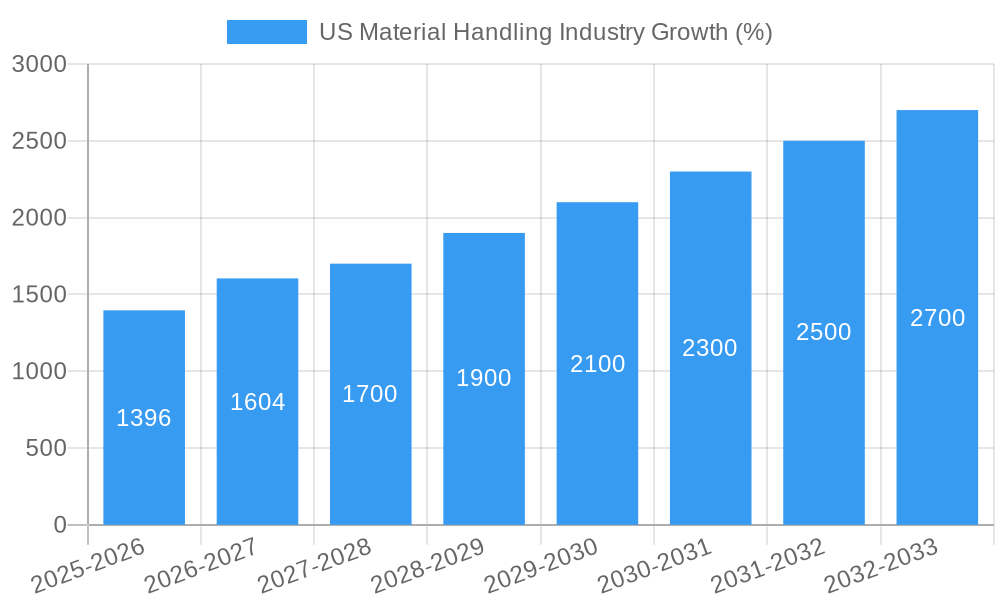
The US material handling market experienced robust growth during the historical period (2019-2024), driven by factors such as increased industrial automation, e-commerce expansion, and infrastructure development. The market size is projected to reach xx million units by 2025, with a CAGR of xx% during the forecast period (2025-2033). This growth reflects increasing adoption rates of advanced technologies, such as AMRs and ASRS, across various end-user verticals. Technological disruptions, including the emergence of cloud-based solutions and AI-powered systems, are accelerating efficiency gains and optimizing supply chain operations. Consumer behavior shifts towards faster delivery and personalized experiences further fuel the demand for advanced material handling solutions.
Dominant Regions, Countries, or Segments in US Material Handling Industry
The US material handling market is geographically diverse, with significant growth potential across various regions. However, certain segments exhibit stronger dominance than others. The retail/warehousing/distribution center segment is a primary growth driver, fueled by e-commerce expansion and the need for efficient order fulfillment. Within product types, the hardware segment holds the largest market share, reflecting the fundamental importance of physical equipment. Automated Guided Vehicles (AGVs) and Automated Storage and Retrieval Systems (ASRS) lead the equipment segment, reflecting industry trends toward automation.
- Key Drivers: Strong economic growth, robust e-commerce expansion, favorable government policies promoting automation, and significant investments in infrastructure.
- Dominant Segments: Retail/Warehousing/Distribution Centers, Hardware, AGVs, and ASRS are leading segments in terms of market share and growth potential.
- Regional Dominance: The concentration of manufacturing and logistics hubs influence regional variations in market growth. California, Texas, and other key industrial states demonstrate high growth potential.
US Material Handling Industry Product Landscape
The US material handling product landscape is constantly evolving, with a focus on improving efficiency, safety, and flexibility. Innovations encompass advanced robotics, AI-powered systems, and cloud-based software solutions that offer real-time tracking and optimization. Key features such as improved ergonomics, enhanced safety features, and integration with existing systems are critical selling points. Technological advancements enable greater precision, higher throughput, and reduced operational costs. The trend towards modular and customizable solutions allows for greater flexibility and adaptability to meet specific business needs.
Key Drivers, Barriers & Challenges in US Material Handling Industry
Key Drivers: Increased automation adoption, rising e-commerce, expansion of supply chains, and government initiatives promoting logistics modernization. For instance, the growth of e-commerce has significantly boosted demand for faster, more efficient fulfillment solutions.
Key Challenges & Restraints: High initial investment costs for automation, skilled labor shortages, and supply chain disruptions pose significant obstacles. The COVID-19 pandemic highlighted the fragility of supply chains, impacting the availability of components and increasing lead times. Furthermore, regulatory compliance and the need for robust cybersecurity measures add to the operational complexities. The quantifiable impact of supply chain issues in 2022 resulted in an estimated xx million units loss in production.
Emerging Opportunities in US Material Handling Industry
Emerging opportunities lie in the adoption of cutting-edge technologies like autonomous mobile robots (AMRs), AI-powered warehouse management systems (WMS), and the integration of IoT sensors for real-time tracking and analytics. Untapped markets include small and medium-sized enterprises (SMEs) that are increasingly adopting automation to enhance their competitiveness. Evolving consumer preferences for faster delivery times and personalized experiences are driving demand for flexible and agile material handling solutions.
Growth Accelerators in the US Material Handling Industry
Long-term growth is fueled by ongoing technological advancements, strategic partnerships between technology providers and end-users, and the expansion of e-commerce and global supply chains. Breakthroughs in robotics, AI, and data analytics are continuously optimizing efficiency and productivity. Strategic alliances enable faster innovation and deployment of integrated solutions, while the burgeoning e-commerce sector provides a sustained driver of growth.
Key Players Shaping the US Material Handling Industry Market
- Oceaneering International Inc
- Westfalia Technologies Inc
- Bastian Solutions Inc
- Remtec Automation
- Honeywell Intelligrated
- Daifuku Co Ltd
- Vanderlande Industries B V
- Siggins Company
- Kion Group AG
- Dorner Manufacturing Corporation
- Aethon Inc
- DMW&H
- Cornerstone Automation Systems LLC
Notable Milestones in US Material Handling Industry Sector
- February 2021: Urban Outfitters partnered with TGW to implement an automated fulfillment center solution using TGW's FlashPick system.
- January 2021: W. M. Kelley Co. Inc. acquired Lauyans & Co. Inc., expanding its overhead conveyor and permanent magnet solutions capabilities.
In-Depth US Material Handling Industry Market Outlook
The US material handling industry is poised for sustained growth, driven by technological innovation, expanding e-commerce, and the need for efficient supply chains. Strategic investments in automation, particularly in robotics and AI, will enhance productivity and optimize logistics operations. The focus on sustainability and the adoption of green technologies will also shape the future of the industry, opening up new market opportunities for environmentally friendly material handling solutions. The long-term outlook remains positive, with ample room for growth and innovation.
US Material Handling Industry Segmentation
-
1. Product Type
- 1.1. Hardware
- 1.2. Software
- 1.3. Services
-
2. Equipment Type
-
2.1. Automated Guided Vehicle (AGV)
- 2.1.1. Automated Forklift
- 2.1.2. Automated Tow/Tractor/Tug
- 2.1.3. Unit Load
- 2.1.4. Assembly Line
- 2.1.5. Special Purpose
- 2.2. Autonomous Mobile Robots (AMR)
- 2.3. Laser Guided Vehicle
-
2.4. Automated Storage and Retrieval System (ASRS)
- 2.4.1. Fixed Aisle (Stacker Crane + Shuttle System)
- 2.4.2. Carousel (Horizontal Carousel + Vertical Carousel)
- 2.4.3. Vertical Lift Module
-
2.5. Automated Conveyor
- 2.5.1. Belt
- 2.5.2. Roller
- 2.5.3. Pallet
- 2.5.4. Overhead
-
2.6. Palletizer
- 2.6.1. Conventional (High Level + Low Level)
- 2.6.2. Robotic
- 2.7. Sortation System
-
2.1. Automated Guided Vehicle (AGV)
-
3. End-user Vertical
- 3.1. Airport
- 3.2. Automotive
- 3.3. Food and Beverage
- 3.4. Retail/W
- 3.5. General Manufacturing
- 3.6. Pharmaceuticals
- 3.7. Post and Parcel
- 3.8. Other End-Users
US Material Handling Industry Segmentation By Geography
-
1. North America
- 1.1. United States
- 1.2. Canada
- 1.3. Mexico
-
2. South America
- 2.1. Brazil
- 2.2. Argentina
- 2.3. Rest of South America
-
3. Europe
- 3.1. United Kingdom
- 3.2. Germany
- 3.3. France
- 3.4. Italy
- 3.5. Spain
- 3.6. Russia
- 3.7. Benelux
- 3.8. Nordics
- 3.9. Rest of Europe
-
4. Middle East & Africa
- 4.1. Turkey
- 4.2. Israel
- 4.3. GCC
- 4.4. North Africa
- 4.5. South Africa
- 4.6. Rest of Middle East & Africa
-
5. Asia Pacific
- 5.1. China
- 5.2. India
- 5.3. Japan
- 5.4. South Korea
- 5.5. ASEAN
- 5.6. Oceania
- 5.7. Rest of Asia Pacific
US Material Handling Industry REPORT HIGHLIGHTS
| Aspects | Details |
|---|---|
| Study Period | 2019-2033 |
| Base Year | 2024 |
| Estimated Year | 2025 |
| Forecast Period | 2025-2033 |
| Historical Period | 2019-2024 |
| Growth Rate | CAGR of 9.31% from 2019-2033 |
| Segmentation |
|
Table of Contents
- 1. Introduction
- 1.1. Research Scope
- 1.2. Market Segmentation
- 1.3. Research Methodology
- 1.4. Definitions and Assumptions
- 2. Executive Summary
- 2.1. Introduction
- 3. Market Dynamics
- 3.1. Introduction
- 3.2. Market Drivers
- 3.2.1. Increasing Manufacturing Complexity and Technology Availability; Increasing Demand for Improving Order Accuracy and SKU Proliferation; Emergence of Smart City Logistics and Wide Adoption of Robotics in Warehouse Applications
- 3.3. Market Restrains
- 3.3.1. Gap in Supply Chain Skills and Workforce Shortage; High initial costs
- 3.4. Market Trends
- 3.4.1. Autonomous Mobile Robots (AMR) is Expected to Hold Significant Market Share
- 4. Market Factor Analysis
- 4.1. Porters Five Forces
- 4.2. Supply/Value Chain
- 4.3. PESTEL analysis
- 4.4. Market Entropy
- 4.5. Patent/Trademark Analysis
- 5. Global US Material Handling Industry Analysis, Insights and Forecast, 2019-2031
- 5.1. Market Analysis, Insights and Forecast - by Product Type
- 5.1.1. Hardware
- 5.1.2. Software
- 5.1.3. Services
- 5.2. Market Analysis, Insights and Forecast - by Equipment Type
- 5.2.1. Automated Guided Vehicle (AGV)
- 5.2.1.1. Automated Forklift
- 5.2.1.2. Automated Tow/Tractor/Tug
- 5.2.1.3. Unit Load
- 5.2.1.4. Assembly Line
- 5.2.1.5. Special Purpose
- 5.2.2. Autonomous Mobile Robots (AMR)
- 5.2.3. Laser Guided Vehicle
- 5.2.4. Automated Storage and Retrieval System (ASRS)
- 5.2.4.1. Fixed Aisle (Stacker Crane + Shuttle System)
- 5.2.4.2. Carousel (Horizontal Carousel + Vertical Carousel)
- 5.2.4.3. Vertical Lift Module
- 5.2.5. Automated Conveyor
- 5.2.5.1. Belt
- 5.2.5.2. Roller
- 5.2.5.3. Pallet
- 5.2.5.4. Overhead
- 5.2.6. Palletizer
- 5.2.6.1. Conventional (High Level + Low Level)
- 5.2.6.2. Robotic
- 5.2.7. Sortation System
- 5.2.1. Automated Guided Vehicle (AGV)
- 5.3. Market Analysis, Insights and Forecast - by End-user Vertical
- 5.3.1. Airport
- 5.3.2. Automotive
- 5.3.3. Food and Beverage
- 5.3.4. Retail/W
- 5.3.5. General Manufacturing
- 5.3.6. Pharmaceuticals
- 5.3.7. Post and Parcel
- 5.3.8. Other End-Users
- 5.4. Market Analysis, Insights and Forecast - by Region
- 5.4.1. North America
- 5.4.2. South America
- 5.4.3. Europe
- 5.4.4. Middle East & Africa
- 5.4.5. Asia Pacific
- 5.1. Market Analysis, Insights and Forecast - by Product Type
- 6. North America US Material Handling Industry Analysis, Insights and Forecast, 2019-2031
- 6.1. Market Analysis, Insights and Forecast - by Product Type
- 6.1.1. Hardware
- 6.1.2. Software
- 6.1.3. Services
- 6.2. Market Analysis, Insights and Forecast - by Equipment Type
- 6.2.1. Automated Guided Vehicle (AGV)
- 6.2.1.1. Automated Forklift
- 6.2.1.2. Automated Tow/Tractor/Tug
- 6.2.1.3. Unit Load
- 6.2.1.4. Assembly Line
- 6.2.1.5. Special Purpose
- 6.2.2. Autonomous Mobile Robots (AMR)
- 6.2.3. Laser Guided Vehicle
- 6.2.4. Automated Storage and Retrieval System (ASRS)
- 6.2.4.1. Fixed Aisle (Stacker Crane + Shuttle System)
- 6.2.4.2. Carousel (Horizontal Carousel + Vertical Carousel)
- 6.2.4.3. Vertical Lift Module
- 6.2.5. Automated Conveyor
- 6.2.5.1. Belt
- 6.2.5.2. Roller
- 6.2.5.3. Pallet
- 6.2.5.4. Overhead
- 6.2.6. Palletizer
- 6.2.6.1. Conventional (High Level + Low Level)
- 6.2.6.2. Robotic
- 6.2.7. Sortation System
- 6.2.1. Automated Guided Vehicle (AGV)
- 6.3. Market Analysis, Insights and Forecast - by End-user Vertical
- 6.3.1. Airport
- 6.3.2. Automotive
- 6.3.3. Food and Beverage
- 6.3.4. Retail/W
- 6.3.5. General Manufacturing
- 6.3.6. Pharmaceuticals
- 6.3.7. Post and Parcel
- 6.3.8. Other End-Users
- 6.1. Market Analysis, Insights and Forecast - by Product Type
- 7. South America US Material Handling Industry Analysis, Insights and Forecast, 2019-2031
- 7.1. Market Analysis, Insights and Forecast - by Product Type
- 7.1.1. Hardware
- 7.1.2. Software
- 7.1.3. Services
- 7.2. Market Analysis, Insights and Forecast - by Equipment Type
- 7.2.1. Automated Guided Vehicle (AGV)
- 7.2.1.1. Automated Forklift
- 7.2.1.2. Automated Tow/Tractor/Tug
- 7.2.1.3. Unit Load
- 7.2.1.4. Assembly Line
- 7.2.1.5. Special Purpose
- 7.2.2. Autonomous Mobile Robots (AMR)
- 7.2.3. Laser Guided Vehicle
- 7.2.4. Automated Storage and Retrieval System (ASRS)
- 7.2.4.1. Fixed Aisle (Stacker Crane + Shuttle System)
- 7.2.4.2. Carousel (Horizontal Carousel + Vertical Carousel)
- 7.2.4.3. Vertical Lift Module
- 7.2.5. Automated Conveyor
- 7.2.5.1. Belt
- 7.2.5.2. Roller
- 7.2.5.3. Pallet
- 7.2.5.4. Overhead
- 7.2.6. Palletizer
- 7.2.6.1. Conventional (High Level + Low Level)
- 7.2.6.2. Robotic
- 7.2.7. Sortation System
- 7.2.1. Automated Guided Vehicle (AGV)
- 7.3. Market Analysis, Insights and Forecast - by End-user Vertical
- 7.3.1. Airport
- 7.3.2. Automotive
- 7.3.3. Food and Beverage
- 7.3.4. Retail/W
- 7.3.5. General Manufacturing
- 7.3.6. Pharmaceuticals
- 7.3.7. Post and Parcel
- 7.3.8. Other End-Users
- 7.1. Market Analysis, Insights and Forecast - by Product Type
- 8. Europe US Material Handling Industry Analysis, Insights and Forecast, 2019-2031
- 8.1. Market Analysis, Insights and Forecast - by Product Type
- 8.1.1. Hardware
- 8.1.2. Software
- 8.1.3. Services
- 8.2. Market Analysis, Insights and Forecast - by Equipment Type
- 8.2.1. Automated Guided Vehicle (AGV)
- 8.2.1.1. Automated Forklift
- 8.2.1.2. Automated Tow/Tractor/Tug
- 8.2.1.3. Unit Load
- 8.2.1.4. Assembly Line
- 8.2.1.5. Special Purpose
- 8.2.2. Autonomous Mobile Robots (AMR)
- 8.2.3. Laser Guided Vehicle
- 8.2.4. Automated Storage and Retrieval System (ASRS)
- 8.2.4.1. Fixed Aisle (Stacker Crane + Shuttle System)
- 8.2.4.2. Carousel (Horizontal Carousel + Vertical Carousel)
- 8.2.4.3. Vertical Lift Module
- 8.2.5. Automated Conveyor
- 8.2.5.1. Belt
- 8.2.5.2. Roller
- 8.2.5.3. Pallet
- 8.2.5.4. Overhead
- 8.2.6. Palletizer
- 8.2.6.1. Conventional (High Level + Low Level)
- 8.2.6.2. Robotic
- 8.2.7. Sortation System
- 8.2.1. Automated Guided Vehicle (AGV)
- 8.3. Market Analysis, Insights and Forecast - by End-user Vertical
- 8.3.1. Airport
- 8.3.2. Automotive
- 8.3.3. Food and Beverage
- 8.3.4. Retail/W
- 8.3.5. General Manufacturing
- 8.3.6. Pharmaceuticals
- 8.3.7. Post and Parcel
- 8.3.8. Other End-Users
- 8.1. Market Analysis, Insights and Forecast - by Product Type
- 9. Middle East & Africa US Material Handling Industry Analysis, Insights and Forecast, 2019-2031
- 9.1. Market Analysis, Insights and Forecast - by Product Type
- 9.1.1. Hardware
- 9.1.2. Software
- 9.1.3. Services
- 9.2. Market Analysis, Insights and Forecast - by Equipment Type
- 9.2.1. Automated Guided Vehicle (AGV)
- 9.2.1.1. Automated Forklift
- 9.2.1.2. Automated Tow/Tractor/Tug
- 9.2.1.3. Unit Load
- 9.2.1.4. Assembly Line
- 9.2.1.5. Special Purpose
- 9.2.2. Autonomous Mobile Robots (AMR)
- 9.2.3. Laser Guided Vehicle
- 9.2.4. Automated Storage and Retrieval System (ASRS)
- 9.2.4.1. Fixed Aisle (Stacker Crane + Shuttle System)
- 9.2.4.2. Carousel (Horizontal Carousel + Vertical Carousel)
- 9.2.4.3. Vertical Lift Module
- 9.2.5. Automated Conveyor
- 9.2.5.1. Belt
- 9.2.5.2. Roller
- 9.2.5.3. Pallet
- 9.2.5.4. Overhead
- 9.2.6. Palletizer
- 9.2.6.1. Conventional (High Level + Low Level)
- 9.2.6.2. Robotic
- 9.2.7. Sortation System
- 9.2.1. Automated Guided Vehicle (AGV)
- 9.3. Market Analysis, Insights and Forecast - by End-user Vertical
- 9.3.1. Airport
- 9.3.2. Automotive
- 9.3.3. Food and Beverage
- 9.3.4. Retail/W
- 9.3.5. General Manufacturing
- 9.3.6. Pharmaceuticals
- 9.3.7. Post and Parcel
- 9.3.8. Other End-Users
- 9.1. Market Analysis, Insights and Forecast - by Product Type
- 10. Asia Pacific US Material Handling Industry Analysis, Insights and Forecast, 2019-2031
- 10.1. Market Analysis, Insights and Forecast - by Product Type
- 10.1.1. Hardware
- 10.1.2. Software
- 10.1.3. Services
- 10.2. Market Analysis, Insights and Forecast - by Equipment Type
- 10.2.1. Automated Guided Vehicle (AGV)
- 10.2.1.1. Automated Forklift
- 10.2.1.2. Automated Tow/Tractor/Tug
- 10.2.1.3. Unit Load
- 10.2.1.4. Assembly Line
- 10.2.1.5. Special Purpose
- 10.2.2. Autonomous Mobile Robots (AMR)
- 10.2.3. Laser Guided Vehicle
- 10.2.4. Automated Storage and Retrieval System (ASRS)
- 10.2.4.1. Fixed Aisle (Stacker Crane + Shuttle System)
- 10.2.4.2. Carousel (Horizontal Carousel + Vertical Carousel)
- 10.2.4.3. Vertical Lift Module
- 10.2.5. Automated Conveyor
- 10.2.5.1. Belt
- 10.2.5.2. Roller
- 10.2.5.3. Pallet
- 10.2.5.4. Overhead
- 10.2.6. Palletizer
- 10.2.6.1. Conventional (High Level + Low Level)
- 10.2.6.2. Robotic
- 10.2.7. Sortation System
- 10.2.1. Automated Guided Vehicle (AGV)
- 10.3. Market Analysis, Insights and Forecast - by End-user Vertical
- 10.3.1. Airport
- 10.3.2. Automotive
- 10.3.3. Food and Beverage
- 10.3.4. Retail/W
- 10.3.5. General Manufacturing
- 10.3.6. Pharmaceuticals
- 10.3.7. Post and Parcel
- 10.3.8. Other End-Users
- 10.1. Market Analysis, Insights and Forecast - by Product Type
- 11. Northeast US Material Handling Industry Analysis, Insights and Forecast, 2019-2031
- 12. Southeast US Material Handling Industry Analysis, Insights and Forecast, 2019-2031
- 13. Midwest US Material Handling Industry Analysis, Insights and Forecast, 2019-2031
- 14. Southwest US Material Handling Industry Analysis, Insights and Forecast, 2019-2031
- 15. West US Material Handling Industry Analysis, Insights and Forecast, 2019-2031
- 16. Competitive Analysis
- 16.1. Global Market Share Analysis 2024
- 16.2. Company Profiles
- 16.2.1 Oceaneering International Inc
- 16.2.1.1. Overview
- 16.2.1.2. Products
- 16.2.1.3. SWOT Analysis
- 16.2.1.4. Recent Developments
- 16.2.1.5. Financials (Based on Availability)
- 16.2.2 Westfalia Technologies Inc
- 16.2.2.1. Overview
- 16.2.2.2. Products
- 16.2.2.3. SWOT Analysis
- 16.2.2.4. Recent Developments
- 16.2.2.5. Financials (Based on Availability)
- 16.2.3 Bastian Solutions Inc
- 16.2.3.1. Overview
- 16.2.3.2. Products
- 16.2.3.3. SWOT Analysis
- 16.2.3.4. Recent Developments
- 16.2.3.5. Financials (Based on Availability)
- 16.2.4 Remtec Automation
- 16.2.4.1. Overview
- 16.2.4.2. Products
- 16.2.4.3. SWOT Analysis
- 16.2.4.4. Recent Developments
- 16.2.4.5. Financials (Based on Availability)
- 16.2.5 Honeywell Intelligrated
- 16.2.5.1. Overview
- 16.2.5.2. Products
- 16.2.5.3. SWOT Analysis
- 16.2.5.4. Recent Developments
- 16.2.5.5. Financials (Based on Availability)
- 16.2.6 Daifuku Co Ltd
- 16.2.6.1. Overview
- 16.2.6.2. Products
- 16.2.6.3. SWOT Analysis
- 16.2.6.4. Recent Developments
- 16.2.6.5. Financials (Based on Availability)
- 16.2.7 Vanderlande Industries B V *List Not Exhaustive
- 16.2.7.1. Overview
- 16.2.7.2. Products
- 16.2.7.3. SWOT Analysis
- 16.2.7.4. Recent Developments
- 16.2.7.5. Financials (Based on Availability)
- 16.2.8 Siggins Company
- 16.2.8.1. Overview
- 16.2.8.2. Products
- 16.2.8.3. SWOT Analysis
- 16.2.8.4. Recent Developments
- 16.2.8.5. Financials (Based on Availability)
- 16.2.9 Kion Group AG
- 16.2.9.1. Overview
- 16.2.9.2. Products
- 16.2.9.3. SWOT Analysis
- 16.2.9.4. Recent Developments
- 16.2.9.5. Financials (Based on Availability)
- 16.2.10 Dorner Manufacturing Corporation
- 16.2.10.1. Overview
- 16.2.10.2. Products
- 16.2.10.3. SWOT Analysis
- 16.2.10.4. Recent Developments
- 16.2.10.5. Financials (Based on Availability)
- 16.2.11 Aethon Inc
- 16.2.11.1. Overview
- 16.2.11.2. Products
- 16.2.11.3. SWOT Analysis
- 16.2.11.4. Recent Developments
- 16.2.11.5. Financials (Based on Availability)
- 16.2.12 DMW&H
- 16.2.12.1. Overview
- 16.2.12.2. Products
- 16.2.12.3. SWOT Analysis
- 16.2.12.4. Recent Developments
- 16.2.12.5. Financials (Based on Availability)
- 16.2.13 Cornerstone Automation Systems LLC
- 16.2.13.1. Overview
- 16.2.13.2. Products
- 16.2.13.3. SWOT Analysis
- 16.2.13.4. Recent Developments
- 16.2.13.5. Financials (Based on Availability)
- 16.2.1 Oceaneering International Inc
List of Figures
- Figure 1: Global US Material Handling Industry Revenue Breakdown (Million, %) by Region 2024 & 2032
- Figure 2: United states US Material Handling Industry Revenue (Million), by Country 2024 & 2032
- Figure 3: United states US Material Handling Industry Revenue Share (%), by Country 2024 & 2032
- Figure 4: North America US Material Handling Industry Revenue (Million), by Product Type 2024 & 2032
- Figure 5: North America US Material Handling Industry Revenue Share (%), by Product Type 2024 & 2032
- Figure 6: North America US Material Handling Industry Revenue (Million), by Equipment Type 2024 & 2032
- Figure 7: North America US Material Handling Industry Revenue Share (%), by Equipment Type 2024 & 2032
- Figure 8: North America US Material Handling Industry Revenue (Million), by End-user Vertical 2024 & 2032
- Figure 9: North America US Material Handling Industry Revenue Share (%), by End-user Vertical 2024 & 2032
- Figure 10: North America US Material Handling Industry Revenue (Million), by Country 2024 & 2032
- Figure 11: North America US Material Handling Industry Revenue Share (%), by Country 2024 & 2032
- Figure 12: South America US Material Handling Industry Revenue (Million), by Product Type 2024 & 2032
- Figure 13: South America US Material Handling Industry Revenue Share (%), by Product Type 2024 & 2032
- Figure 14: South America US Material Handling Industry Revenue (Million), by Equipment Type 2024 & 2032
- Figure 15: South America US Material Handling Industry Revenue Share (%), by Equipment Type 2024 & 2032
- Figure 16: South America US Material Handling Industry Revenue (Million), by End-user Vertical 2024 & 2032
- Figure 17: South America US Material Handling Industry Revenue Share (%), by End-user Vertical 2024 & 2032
- Figure 18: South America US Material Handling Industry Revenue (Million), by Country 2024 & 2032
- Figure 19: South America US Material Handling Industry Revenue Share (%), by Country 2024 & 2032
- Figure 20: Europe US Material Handling Industry Revenue (Million), by Product Type 2024 & 2032
- Figure 21: Europe US Material Handling Industry Revenue Share (%), by Product Type 2024 & 2032
- Figure 22: Europe US Material Handling Industry Revenue (Million), by Equipment Type 2024 & 2032
- Figure 23: Europe US Material Handling Industry Revenue Share (%), by Equipment Type 2024 & 2032
- Figure 24: Europe US Material Handling Industry Revenue (Million), by End-user Vertical 2024 & 2032
- Figure 25: Europe US Material Handling Industry Revenue Share (%), by End-user Vertical 2024 & 2032
- Figure 26: Europe US Material Handling Industry Revenue (Million), by Country 2024 & 2032
- Figure 27: Europe US Material Handling Industry Revenue Share (%), by Country 2024 & 2032
- Figure 28: Middle East & Africa US Material Handling Industry Revenue (Million), by Product Type 2024 & 2032
- Figure 29: Middle East & Africa US Material Handling Industry Revenue Share (%), by Product Type 2024 & 2032
- Figure 30: Middle East & Africa US Material Handling Industry Revenue (Million), by Equipment Type 2024 & 2032
- Figure 31: Middle East & Africa US Material Handling Industry Revenue Share (%), by Equipment Type 2024 & 2032
- Figure 32: Middle East & Africa US Material Handling Industry Revenue (Million), by End-user Vertical 2024 & 2032
- Figure 33: Middle East & Africa US Material Handling Industry Revenue Share (%), by End-user Vertical 2024 & 2032
- Figure 34: Middle East & Africa US Material Handling Industry Revenue (Million), by Country 2024 & 2032
- Figure 35: Middle East & Africa US Material Handling Industry Revenue Share (%), by Country 2024 & 2032
- Figure 36: Asia Pacific US Material Handling Industry Revenue (Million), by Product Type 2024 & 2032
- Figure 37: Asia Pacific US Material Handling Industry Revenue Share (%), by Product Type 2024 & 2032
- Figure 38: Asia Pacific US Material Handling Industry Revenue (Million), by Equipment Type 2024 & 2032
- Figure 39: Asia Pacific US Material Handling Industry Revenue Share (%), by Equipment Type 2024 & 2032
- Figure 40: Asia Pacific US Material Handling Industry Revenue (Million), by End-user Vertical 2024 & 2032
- Figure 41: Asia Pacific US Material Handling Industry Revenue Share (%), by End-user Vertical 2024 & 2032
- Figure 42: Asia Pacific US Material Handling Industry Revenue (Million), by Country 2024 & 2032
- Figure 43: Asia Pacific US Material Handling Industry Revenue Share (%), by Country 2024 & 2032
List of Tables
- Table 1: Global US Material Handling Industry Revenue Million Forecast, by Region 2019 & 2032
- Table 2: Global US Material Handling Industry Revenue Million Forecast, by Product Type 2019 & 2032
- Table 3: Global US Material Handling Industry Revenue Million Forecast, by Equipment Type 2019 & 2032
- Table 4: Global US Material Handling Industry Revenue Million Forecast, by End-user Vertical 2019 & 2032
- Table 5: Global US Material Handling Industry Revenue Million Forecast, by Region 2019 & 2032
- Table 6: Global US Material Handling Industry Revenue Million Forecast, by Country 2019 & 2032
- Table 7: Northeast US Material Handling Industry Revenue (Million) Forecast, by Application 2019 & 2032
- Table 8: Southeast US Material Handling Industry Revenue (Million) Forecast, by Application 2019 & 2032
- Table 9: Midwest US Material Handling Industry Revenue (Million) Forecast, by Application 2019 & 2032
- Table 10: Southwest US Material Handling Industry Revenue (Million) Forecast, by Application 2019 & 2032
- Table 11: West US Material Handling Industry Revenue (Million) Forecast, by Application 2019 & 2032
- Table 12: Global US Material Handling Industry Revenue Million Forecast, by Product Type 2019 & 2032
- Table 13: Global US Material Handling Industry Revenue Million Forecast, by Equipment Type 2019 & 2032
- Table 14: Global US Material Handling Industry Revenue Million Forecast, by End-user Vertical 2019 & 2032
- Table 15: Global US Material Handling Industry Revenue Million Forecast, by Country 2019 & 2032
- Table 16: United States US Material Handling Industry Revenue (Million) Forecast, by Application 2019 & 2032
- Table 17: Canada US Material Handling Industry Revenue (Million) Forecast, by Application 2019 & 2032
- Table 18: Mexico US Material Handling Industry Revenue (Million) Forecast, by Application 2019 & 2032
- Table 19: Global US Material Handling Industry Revenue Million Forecast, by Product Type 2019 & 2032
- Table 20: Global US Material Handling Industry Revenue Million Forecast, by Equipment Type 2019 & 2032
- Table 21: Global US Material Handling Industry Revenue Million Forecast, by End-user Vertical 2019 & 2032
- Table 22: Global US Material Handling Industry Revenue Million Forecast, by Country 2019 & 2032
- Table 23: Brazil US Material Handling Industry Revenue (Million) Forecast, by Application 2019 & 2032
- Table 24: Argentina US Material Handling Industry Revenue (Million) Forecast, by Application 2019 & 2032
- Table 25: Rest of South America US Material Handling Industry Revenue (Million) Forecast, by Application 2019 & 2032
- Table 26: Global US Material Handling Industry Revenue Million Forecast, by Product Type 2019 & 2032
- Table 27: Global US Material Handling Industry Revenue Million Forecast, by Equipment Type 2019 & 2032
- Table 28: Global US Material Handling Industry Revenue Million Forecast, by End-user Vertical 2019 & 2032
- Table 29: Global US Material Handling Industry Revenue Million Forecast, by Country 2019 & 2032
- Table 30: United Kingdom US Material Handling Industry Revenue (Million) Forecast, by Application 2019 & 2032
- Table 31: Germany US Material Handling Industry Revenue (Million) Forecast, by Application 2019 & 2032
- Table 32: France US Material Handling Industry Revenue (Million) Forecast, by Application 2019 & 2032
- Table 33: Italy US Material Handling Industry Revenue (Million) Forecast, by Application 2019 & 2032
- Table 34: Spain US Material Handling Industry Revenue (Million) Forecast, by Application 2019 & 2032
- Table 35: Russia US Material Handling Industry Revenue (Million) Forecast, by Application 2019 & 2032
- Table 36: Benelux US Material Handling Industry Revenue (Million) Forecast, by Application 2019 & 2032
- Table 37: Nordics US Material Handling Industry Revenue (Million) Forecast, by Application 2019 & 2032
- Table 38: Rest of Europe US Material Handling Industry Revenue (Million) Forecast, by Application 2019 & 2032
- Table 39: Global US Material Handling Industry Revenue Million Forecast, by Product Type 2019 & 2032
- Table 40: Global US Material Handling Industry Revenue Million Forecast, by Equipment Type 2019 & 2032
- Table 41: Global US Material Handling Industry Revenue Million Forecast, by End-user Vertical 2019 & 2032
- Table 42: Global US Material Handling Industry Revenue Million Forecast, by Country 2019 & 2032
- Table 43: Turkey US Material Handling Industry Revenue (Million) Forecast, by Application 2019 & 2032
- Table 44: Israel US Material Handling Industry Revenue (Million) Forecast, by Application 2019 & 2032
- Table 45: GCC US Material Handling Industry Revenue (Million) Forecast, by Application 2019 & 2032
- Table 46: North Africa US Material Handling Industry Revenue (Million) Forecast, by Application 2019 & 2032
- Table 47: South Africa US Material Handling Industry Revenue (Million) Forecast, by Application 2019 & 2032
- Table 48: Rest of Middle East & Africa US Material Handling Industry Revenue (Million) Forecast, by Application 2019 & 2032
- Table 49: Global US Material Handling Industry Revenue Million Forecast, by Product Type 2019 & 2032
- Table 50: Global US Material Handling Industry Revenue Million Forecast, by Equipment Type 2019 & 2032
- Table 51: Global US Material Handling Industry Revenue Million Forecast, by End-user Vertical 2019 & 2032
- Table 52: Global US Material Handling Industry Revenue Million Forecast, by Country 2019 & 2032
- Table 53: China US Material Handling Industry Revenue (Million) Forecast, by Application 2019 & 2032
- Table 54: India US Material Handling Industry Revenue (Million) Forecast, by Application 2019 & 2032
- Table 55: Japan US Material Handling Industry Revenue (Million) Forecast, by Application 2019 & 2032
- Table 56: South Korea US Material Handling Industry Revenue (Million) Forecast, by Application 2019 & 2032
- Table 57: ASEAN US Material Handling Industry Revenue (Million) Forecast, by Application 2019 & 2032
- Table 58: Oceania US Material Handling Industry Revenue (Million) Forecast, by Application 2019 & 2032
- Table 59: Rest of Asia Pacific US Material Handling Industry Revenue (Million) Forecast, by Application 2019 & 2032
Frequently Asked Questions
1. What is the projected Compound Annual Growth Rate (CAGR) of the US Material Handling Industry?
The projected CAGR is approximately 9.31%.
2. Which companies are prominent players in the US Material Handling Industry?
Key companies in the market include Oceaneering International Inc, Westfalia Technologies Inc, Bastian Solutions Inc, Remtec Automation, Honeywell Intelligrated, Daifuku Co Ltd, Vanderlande Industries B V *List Not Exhaustive, Siggins Company, Kion Group AG, Dorner Manufacturing Corporation, Aethon Inc, DMW&H, Cornerstone Automation Systems LLC.
3. What are the main segments of the US Material Handling Industry?
The market segments include Product Type, Equipment Type, End-user Vertical.
4. Can you provide details about the market size?
The market size is estimated to be USD XX Million as of 2022.
5. What are some drivers contributing to market growth?
Increasing Manufacturing Complexity and Technology Availability; Increasing Demand for Improving Order Accuracy and SKU Proliferation; Emergence of Smart City Logistics and Wide Adoption of Robotics in Warehouse Applications.
6. What are the notable trends driving market growth?
Autonomous Mobile Robots (AMR) is Expected to Hold Significant Market Share.
7. Are there any restraints impacting market growth?
Gap in Supply Chain Skills and Workforce Shortage; High initial costs.
8. Can you provide examples of recent developments in the market?
February 2021- Urban Outfitters Inc. (URBN), one of the providers of lifestyle products and services companies, that operates a portfolio of global consumer brands comprised of Anthropologie, BHLDN, Free People, Terrain, Urban Outfitters, Nuuly, and a Food and Beverage division partnered with TGW to design and implement an automation solution for a new fulfillment center in Kansas City, in the US. The company's FlashPick system is provided as a solution as the product picks orders fully automatically and ensures the next phase of picking is being addressed.
9. What pricing options are available for accessing the report?
Pricing options include single-user, multi-user, and enterprise licenses priced at USD 3800, USD 4500, and USD 5800 respectively.
10. Is the market size provided in terms of value or volume?
The market size is provided in terms of value, measured in Million.
11. Are there any specific market keywords associated with the report?
Yes, the market keyword associated with the report is "US Material Handling Industry," which aids in identifying and referencing the specific market segment covered.
12. How do I determine which pricing option suits my needs best?
The pricing options vary based on user requirements and access needs. Individual users may opt for single-user licenses, while businesses requiring broader access may choose multi-user or enterprise licenses for cost-effective access to the report.
13. Are there any additional resources or data provided in the US Material Handling Industry report?
While the report offers comprehensive insights, it's advisable to review the specific contents or supplementary materials provided to ascertain if additional resources or data are available.
14. How can I stay updated on further developments or reports in the US Material Handling Industry?
To stay informed about further developments, trends, and reports in the US Material Handling Industry, consider subscribing to industry newsletters, following relevant companies and organizations, or regularly checking reputable industry news sources and publications.
Methodology
Step 1 - Identification of Relevant Samples Size from Population Database


Step 2 - Approaches for Defining Global Market Size (Value, Volume* & Price*)

Note*: In applicable scenarios
Step 3 - Data Sources
Primary Research
- Web Analytics
- Survey Reports
- Research Institute
- Latest Research Reports
- Opinion Leaders
Secondary Research
- Annual Reports
- White Paper
- Latest Press Release
- Industry Association
- Paid Database
- Investor Presentations

Step 4 - Data Triangulation
Involves using different sources of information in order to increase the validity of a study
These sources are likely to be stakeholders in a program - participants, other researchers, program staff, other community members, and so on.
Then we put all data in single framework & apply various statistical tools to find out the dynamic on the market.
During the analysis stage, feedback from the stakeholder groups would be compared to determine areas of agreement as well as areas of divergence
