

Key Insights
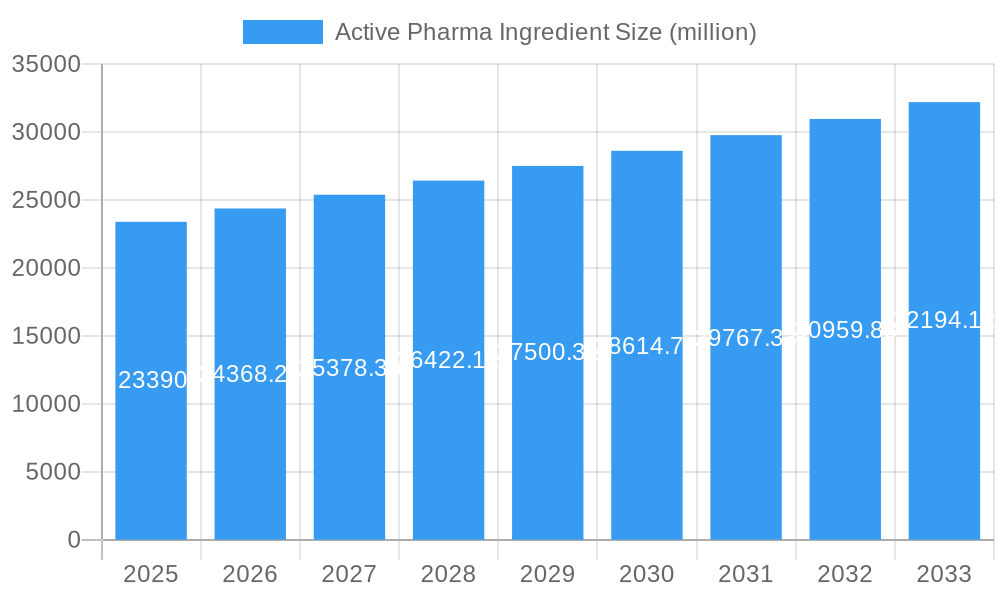
The Active Pharmaceutical Ingredient (API) market, valued at $23,390 million in 2025, is projected to experience robust growth, driven by a compound annual growth rate (CAGR) of 3.9% from 2025 to 2033. This expansion is fueled by several key factors. The increasing prevalence of chronic diseases globally necessitates a higher demand for pharmaceutical drugs, directly impacting API consumption. Furthermore, the ongoing research and development efforts in the pharmaceutical sector, leading to the introduction of novel drugs and innovative treatment modalities, contribute significantly to market growth. The rise in generic drug consumption, coupled with expanding healthcare infrastructure in emerging economies, also presents substantial opportunities for API manufacturers. However, stringent regulatory approvals and the potential for price erosion due to increased competition from generic drug producers pose challenges to market expansion. The diverse range of APIs, catering to various therapeutic areas, further shapes market dynamics. Major players like Teva, Novartis, Pfizer, and Johnson & Johnson dominate the landscape, leveraging their extensive research capabilities and global distribution networks. The competitive landscape also includes several prominent players from India and China, contributing significantly to the API supply chain.
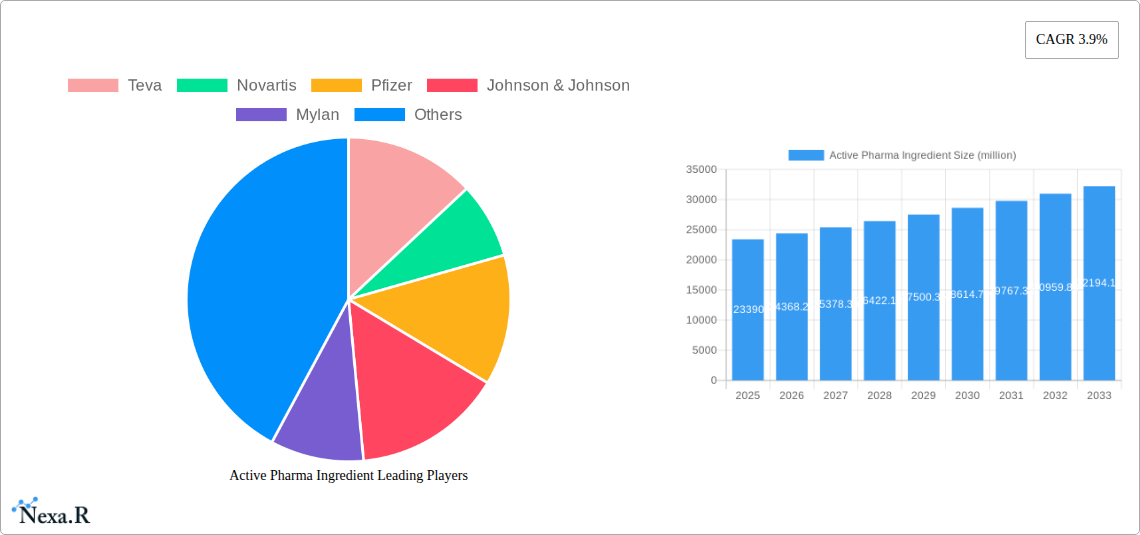
Active Pharma Ingredient Market Size (In Billion)
The market segmentation, while not explicitly detailed, likely includes various API types categorized by therapeutic application (e.g., cardiovascular, oncology, anti-infectives). Regional variations in market size and growth rate are expected, with developed regions such as North America and Europe potentially showing slower growth compared to rapidly developing economies in Asia and Latin America. The forecast period (2025-2033) will likely witness a shift in market share among companies, with both established players and emerging companies striving for leadership. Strategic partnerships, mergers, and acquisitions will play a pivotal role in shaping the competitive landscape and driving innovation within the API market. The continuous advancements in manufacturing technologies, focusing on efficiency and sustainability, will further influence the market's trajectory in the coming years.
Active Pharma Ingredient Company Market Share
Active Pharmaceutical Ingredient (API) Market Report: 2019-2033
This comprehensive report provides an in-depth analysis of the Active Pharmaceutical Ingredient (API) market, encompassing market dynamics, growth trends, regional insights, competitive landscape, and future outlook. The report covers the period from 2019 to 2033, with a focus on the 2025-2033 forecast period. The base year for this analysis is 2025. This crucial report serves as an indispensable resource for pharmaceutical companies, investors, researchers, and regulatory bodies seeking a thorough understanding of this vital sector. The report utilizes data measured in million units.
Active Pharma Ingredient Market Dynamics & Structure
The global API market is characterized by high concentration among leading players, significant technological advancements, stringent regulatory frameworks, and increasing presence of biosimilars. Market consolidation through mergers and acquisitions (M&A) is a prevalent trend. The parent market is the pharmaceutical industry while the child market is API manufacturing and supply. The report analyzes market share distribution among key players, illustrating the competitive intensity. The impact of innovative technologies like continuous manufacturing and process analytical technologies (PAT) is examined alongside their challenges in implementation.
- Market Concentration: Top 10 companies hold xx% market share in 2025 (estimated).
- M&A Activity: A total of xx M&A deals were recorded between 2019 and 2024, with a total value of xx million units.
- Regulatory Landscape: Stringent regulatory requirements like GMP and increasing emphasis on supply chain security heavily influence market dynamics.
- Technological Innovation: Adoption of advanced technologies (e.g., continuous manufacturing, AI-powered process optimization) is expected to increase efficiency but faces challenges in terms of capital investment and skilled workforce availability.
- Competitive Landscape: Intense competition exists between established players and emerging players. Biosimilars are significantly impacting the market share of originator drugs.
- End-User Demographics: Growing geriatric population and rising prevalence of chronic diseases are key drivers.
Active Pharma Ingredient Growth Trends & Insights
The global API market is experiencing robust growth, driven by factors including increased pharmaceutical R&D expenditure, rising demand for generic drugs, and a growing focus on outsourcing API manufacturing. The report presents a detailed analysis of market size evolution, adoption rates of new technologies, and evolving consumer behavior in the pharmaceutical industry, impacting API demand and supply chains.
- Market Size: The global API market size reached xx million units in 2024 and is projected to reach xx million units by 2033, exhibiting a CAGR of xx% during the forecast period.
- Adoption Rates: The adoption rate of continuous manufacturing is projected to increase from xx% in 2024 to xx% by 2033.
- Technological Disruptions: Advancements in synthetic chemistry and biotechnology are constantly reshaping the API landscape.
- Consumer Behavior Shifts: Increased demand for affordable, high-quality medicines is driving growth in the generic API segment.
Dominant Regions, Countries, or Segments in Active Pharma Ingredient
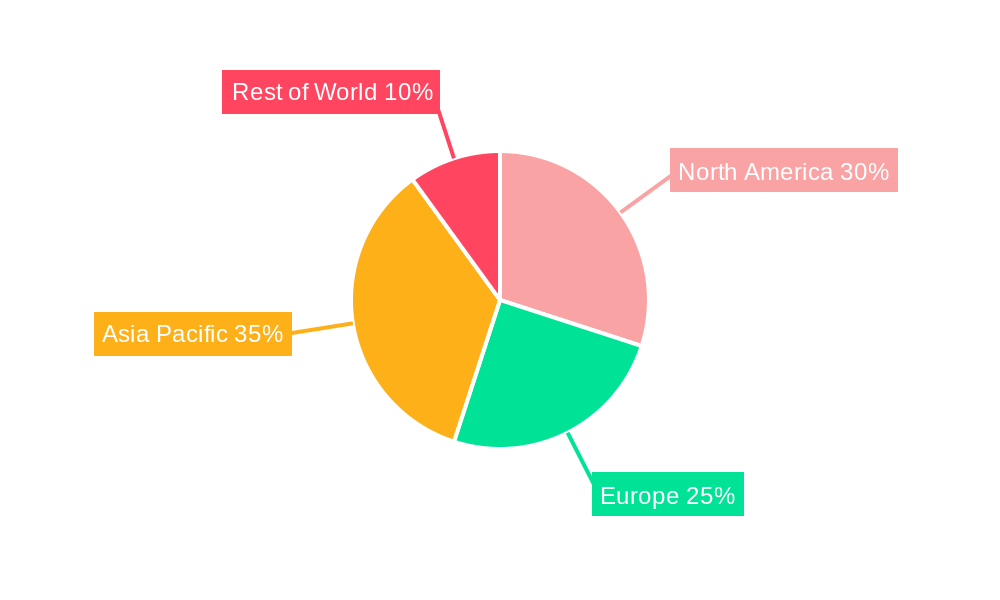
The Asia-Pacific region, particularly India and China, dominates the API market, owing to cost-effective manufacturing, a large talent pool, and supportive government policies. North America and Europe also hold significant market shares, driven by strong R&D investment and established pharmaceutical industries.
- Key Drivers in Asia-Pacific: Lower manufacturing costs, abundant skilled labor, and government incentives fostering pharmaceutical manufacturing.
- Key Drivers in North America and Europe: Robust pharmaceutical R&D, stringent regulatory frameworks ensuring quality, and high demand for innovative APIs.
- Market Share: Asia-Pacific holds an estimated xx% market share in 2025, followed by North America with xx% and Europe with xx%.
- Growth Potential: Africa and Latin America present significant untapped potential for API market growth due to rising healthcare spending and increasing prevalence of chronic diseases.
Active Pharma Ingredient Product Landscape
The API market encompasses a wide range of products, categorized by chemical structure, therapeutic application, and manufacturing process. Innovations include advanced formulations, targeted drug delivery systems, and APIs for novel therapies like biologics and cell therapies. These advancements translate into enhanced efficacy, reduced side effects, and improved patient compliance.
Key Drivers, Barriers & Challenges in Active Pharma Ingredient
Key Drivers:
- Rising prevalence of chronic diseases globally.
- Increasing demand for generic drugs.
- Growing R&D investment in the pharmaceutical sector.
- Government initiatives supporting pharmaceutical manufacturing.
Challenges & Restraints:
- Stringent regulatory compliance.
- Supply chain disruptions and vulnerabilities.
- Intense competition among API manufacturers.
- Price erosion in the generic API segment.
- xx% of API manufacturing facilities face challenges in meeting stringent quality standards leading to production delays and increased costs.
Emerging Opportunities in Active Pharma Ingredient
- Growing demand for APIs for novel drug delivery systems (e.g., nanoparticles, liposomes).
- Expansion of contract manufacturing organizations (CMOs) servicing API needs.
- Increased investment in biosimilars and biogenerics.
- Focus on sustainable and green chemistry methods in API manufacturing.
Growth Accelerators in the Active Pharma Ingredient Industry
Technological advancements such as continuous manufacturing, AI-powered process optimization, and the development of new synthetic routes are significantly accelerating API industry growth. Strategic partnerships and collaborations between API manufacturers and pharmaceutical companies are also boosting innovation and efficiency. Expanding into emerging markets and developing new therapeutic areas are crucial for long-term growth.
Key Players Shaping the Active Pharma Ingredient Market
- Teva Pharmaceutical Industries Ltd. Teva
- Novartis
- Pfizer
- Johnson & Johnson
- Mylan N.V.
- North China Pharmaceutical Group
- Dr. Reddy's Laboratories
- Roche
- Aurobindo Pharma
- Sun Pharmaceutical Industries Ltd.
- Boehringer Ingelheim GmbH
- Bayer
- BASF
- DSM
- Zhejiang Medicine Co., Ltd.
- Biocon
- Johnson Matthey
- Hisun Pharmaceutical
- Cambrex
- Shandong Xinhua Pharmaceutical
- Lonza Group Ltd.
- Huahai Pharmaceutical
- Harbin Pharmaceutical Group
- Cipla
- Tianjin Tianyao Pharmaceutical Co., Ltd.
- Lupin
- Northeast Pharmaceutical Group
- Albemarle Corporation
- Shandong Lukang Pharmaceutical
- Jiangsu Hengrui Medicine
Notable Milestones in Active Pharma Ingredient Sector
- 2020: Increased investment in continuous manufacturing technologies.
- 2021: Several significant M&A deals reshaped the API market landscape.
- 2022: Growing adoption of PAT technologies for enhanced process control.
- 2023: Launch of several novel APIs for emerging therapeutic areas.
- 2024: Increased regulatory scrutiny on API supply chain security.
In-Depth Active Pharma Ingredient Market Outlook
The API market is poised for sustained growth, driven by continued innovation, increasing demand for high-quality medicines, and the expansion of the global pharmaceutical industry. Strategic partnerships, investments in advanced technologies, and expansion into emerging markets will be key factors determining future success in this dynamic sector. The market is expected to benefit significantly from the ongoing efforts to improve supply chain resilience and the increasing adoption of sustainable manufacturing practices.
Active Pharma Ingredient Segmentation
-
1. Application
- 1.1. Oncology
- 1.2. Cardiovascular Disease
- 1.3. Diabetes
- 1.4. Central Nervous System and Neurological Disorders
- 1.5. Endocrinology
- 1.6. Other Therapeutic Applications
-
2. Types
- 2.1. Innovative Active Pharmaceutical Ingredients
- 2.2. Generic Active Pharmaceutical Ingredients
Active Pharma Ingredient Segmentation By Geography
-
1. North America
- 1.1. United States
- 1.2. Canada
- 1.3. Mexico
-
2. South America
- 2.1. Brazil
- 2.2. Argentina
- 2.3. Rest of South America
-
3. Europe
- 3.1. United Kingdom
- 3.2. Germany
- 3.3. France
- 3.4. Italy
- 3.5. Spain
- 3.6. Russia
- 3.7. Benelux
- 3.8. Nordics
- 3.9. Rest of Europe
-
4. Middle East & Africa
- 4.1. Turkey
- 4.2. Israel
- 4.3. GCC
- 4.4. North Africa
- 4.5. South Africa
- 4.6. Rest of Middle East & Africa
-
5. Asia Pacific
- 5.1. China
- 5.2. India
- 5.3. Japan
- 5.4. South Korea
- 5.5. ASEAN
- 5.6. Oceania
- 5.7. Rest of Asia Pacific
Active Pharma Ingredient Regional Market Share
Geographic Coverage of Active Pharma Ingredient
Active Pharma Ingredient REPORT HIGHLIGHTS
| Aspects | Details |
|---|---|
| Study Period | 2020-2034 |
| Base Year | 2025 |
| Estimated Year | 2026 |
| Forecast Period | 2026-2034 |
| Historical Period | 2020-2025 |
| Growth Rate | CAGR of 3.9% from 2020-2034 |
| Segmentation |
|
Table of Contents
- 1. Introduction
- 1.1. Research Scope
- 1.2. Market Segmentation
- 1.3. Research Methodology
- 1.4. Definitions and Assumptions
- 2. Executive Summary
- 2.1. Introduction
- 3. Market Dynamics
- 3.1. Introduction
- 3.2. Market Drivers
- 3.3. Market Restrains
- 3.4. Market Trends
- 4. Market Factor Analysis
- 4.1. Porters Five Forces
- 4.2. Supply/Value Chain
- 4.3. PESTEL analysis
- 4.4. Market Entropy
- 4.5. Patent/Trademark Analysis
- 5. Global Active Pharma Ingredient Analysis, Insights and Forecast, 2020-2032
- 5.1. Market Analysis, Insights and Forecast - by Application
- 5.1.1. Oncology
- 5.1.2. Cardiovascular Disease
- 5.1.3. Diabetes
- 5.1.4. Central Nervous System and Neurological Disorders
- 5.1.5. Endocrinology
- 5.1.6. Other Therapeutic Applications
- 5.2. Market Analysis, Insights and Forecast - by Types
- 5.2.1. Innovative Active Pharmaceutical Ingredients
- 5.2.2. Generic Active Pharmaceutical Ingredients
- 5.3. Market Analysis, Insights and Forecast - by Region
- 5.3.1. North America
- 5.3.2. South America
- 5.3.3. Europe
- 5.3.4. Middle East & Africa
- 5.3.5. Asia Pacific
- 5.1. Market Analysis, Insights and Forecast - by Application
- 6. North America Active Pharma Ingredient Analysis, Insights and Forecast, 2020-2032
- 6.1. Market Analysis, Insights and Forecast - by Application
- 6.1.1. Oncology
- 6.1.2. Cardiovascular Disease
- 6.1.3. Diabetes
- 6.1.4. Central Nervous System and Neurological Disorders
- 6.1.5. Endocrinology
- 6.1.6. Other Therapeutic Applications
- 6.2. Market Analysis, Insights and Forecast - by Types
- 6.2.1. Innovative Active Pharmaceutical Ingredients
- 6.2.2. Generic Active Pharmaceutical Ingredients
- 6.1. Market Analysis, Insights and Forecast - by Application
- 7. South America Active Pharma Ingredient Analysis, Insights and Forecast, 2020-2032
- 7.1. Market Analysis, Insights and Forecast - by Application
- 7.1.1. Oncology
- 7.1.2. Cardiovascular Disease
- 7.1.3. Diabetes
- 7.1.4. Central Nervous System and Neurological Disorders
- 7.1.5. Endocrinology
- 7.1.6. Other Therapeutic Applications
- 7.2. Market Analysis, Insights and Forecast - by Types
- 7.2.1. Innovative Active Pharmaceutical Ingredients
- 7.2.2. Generic Active Pharmaceutical Ingredients
- 7.1. Market Analysis, Insights and Forecast - by Application
- 8. Europe Active Pharma Ingredient Analysis, Insights and Forecast, 2020-2032
- 8.1. Market Analysis, Insights and Forecast - by Application
- 8.1.1. Oncology
- 8.1.2. Cardiovascular Disease
- 8.1.3. Diabetes
- 8.1.4. Central Nervous System and Neurological Disorders
- 8.1.5. Endocrinology
- 8.1.6. Other Therapeutic Applications
- 8.2. Market Analysis, Insights and Forecast - by Types
- 8.2.1. Innovative Active Pharmaceutical Ingredients
- 8.2.2. Generic Active Pharmaceutical Ingredients
- 8.1. Market Analysis, Insights and Forecast - by Application
- 9. Middle East & Africa Active Pharma Ingredient Analysis, Insights and Forecast, 2020-2032
- 9.1. Market Analysis, Insights and Forecast - by Application
- 9.1.1. Oncology
- 9.1.2. Cardiovascular Disease
- 9.1.3. Diabetes
- 9.1.4. Central Nervous System and Neurological Disorders
- 9.1.5. Endocrinology
- 9.1.6. Other Therapeutic Applications
- 9.2. Market Analysis, Insights and Forecast - by Types
- 9.2.1. Innovative Active Pharmaceutical Ingredients
- 9.2.2. Generic Active Pharmaceutical Ingredients
- 9.1. Market Analysis, Insights and Forecast - by Application
- 10. Asia Pacific Active Pharma Ingredient Analysis, Insights and Forecast, 2020-2032
- 10.1. Market Analysis, Insights and Forecast - by Application
- 10.1.1. Oncology
- 10.1.2. Cardiovascular Disease
- 10.1.3. Diabetes
- 10.1.4. Central Nervous System and Neurological Disorders
- 10.1.5. Endocrinology
- 10.1.6. Other Therapeutic Applications
- 10.2. Market Analysis, Insights and Forecast - by Types
- 10.2.1. Innovative Active Pharmaceutical Ingredients
- 10.2.2. Generic Active Pharmaceutical Ingredients
- 10.1. Market Analysis, Insights and Forecast - by Application
- 11. Competitive Analysis
- 11.1. Global Market Share Analysis 2025
- 11.2. Company Profiles
- 11.2.1 Teva
- 11.2.1.1. Overview
- 11.2.1.2. Products
- 11.2.1.3. SWOT Analysis
- 11.2.1.4. Recent Developments
- 11.2.1.5. Financials (Based on Availability)
- 11.2.2 Novartis
- 11.2.2.1. Overview
- 11.2.2.2. Products
- 11.2.2.3. SWOT Analysis
- 11.2.2.4. Recent Developments
- 11.2.2.5. Financials (Based on Availability)
- 11.2.3 Pfizer
- 11.2.3.1. Overview
- 11.2.3.2. Products
- 11.2.3.3. SWOT Analysis
- 11.2.3.4. Recent Developments
- 11.2.3.5. Financials (Based on Availability)
- 11.2.4 Johnson & Johnson
- 11.2.4.1. Overview
- 11.2.4.2. Products
- 11.2.4.3. SWOT Analysis
- 11.2.4.4. Recent Developments
- 11.2.4.5. Financials (Based on Availability)
- 11.2.5 Mylan
- 11.2.5.1. Overview
- 11.2.5.2. Products
- 11.2.5.3. SWOT Analysis
- 11.2.5.4. Recent Developments
- 11.2.5.5. Financials (Based on Availability)
- 11.2.6 North China Pharmaceutical Group
- 11.2.6.1. Overview
- 11.2.6.2. Products
- 11.2.6.3. SWOT Analysis
- 11.2.6.4. Recent Developments
- 11.2.6.5. Financials (Based on Availability)
- 11.2.7 Dr. Reddy’s Laboratories
- 11.2.7.1. Overview
- 11.2.7.2. Products
- 11.2.7.3. SWOT Analysis
- 11.2.7.4. Recent Developments
- 11.2.7.5. Financials (Based on Availability)
- 11.2.8 Roche
- 11.2.8.1. Overview
- 11.2.8.2. Products
- 11.2.8.3. SWOT Analysis
- 11.2.8.4. Recent Developments
- 11.2.8.5. Financials (Based on Availability)
- 11.2.9 Aurobindo pharma
- 11.2.9.1. Overview
- 11.2.9.2. Products
- 11.2.9.3. SWOT Analysis
- 11.2.9.4. Recent Developments
- 11.2.9.5. Financials (Based on Availability)
- 11.2.10 Sun Pharmaceutical Industries
- 11.2.10.1. Overview
- 11.2.10.2. Products
- 11.2.10.3. SWOT Analysis
- 11.2.10.4. Recent Developments
- 11.2.10.5. Financials (Based on Availability)
- 11.2.11 Boehringer Ingelheim GmbH
- 11.2.11.1. Overview
- 11.2.11.2. Products
- 11.2.11.3. SWOT Analysis
- 11.2.11.4. Recent Developments
- 11.2.11.5. Financials (Based on Availability)
- 11.2.12 Bayer
- 11.2.12.1. Overview
- 11.2.12.2. Products
- 11.2.12.3. SWOT Analysis
- 11.2.12.4. Recent Developments
- 11.2.12.5. Financials (Based on Availability)
- 11.2.13 BASF
- 11.2.13.1. Overview
- 11.2.13.2. Products
- 11.2.13.3. SWOT Analysis
- 11.2.13.4. Recent Developments
- 11.2.13.5. Financials (Based on Availability)
- 11.2.14 DSM
- 11.2.14.1. Overview
- 11.2.14.2. Products
- 11.2.14.3. SWOT Analysis
- 11.2.14.4. Recent Developments
- 11.2.14.5. Financials (Based on Availability)
- 11.2.15 Zhejiang Medicine
- 11.2.15.1. Overview
- 11.2.15.2. Products
- 11.2.15.3. SWOT Analysis
- 11.2.15.4. Recent Developments
- 11.2.15.5. Financials (Based on Availability)
- 11.2.16 Biocon
- 11.2.16.1. Overview
- 11.2.16.2. Products
- 11.2.16.3. SWOT Analysis
- 11.2.16.4. Recent Developments
- 11.2.16.5. Financials (Based on Availability)
- 11.2.17 Johnson Matthey
- 11.2.17.1. Overview
- 11.2.17.2. Products
- 11.2.17.3. SWOT Analysis
- 11.2.17.4. Recent Developments
- 11.2.17.5. Financials (Based on Availability)
- 11.2.18 Hisun Pharmacy
- 11.2.18.1. Overview
- 11.2.18.2. Products
- 11.2.18.3. SWOT Analysis
- 11.2.18.4. Recent Developments
- 11.2.18.5. Financials (Based on Availability)
- 11.2.19 Cambrex
- 11.2.19.1. Overview
- 11.2.19.2. Products
- 11.2.19.3. SWOT Analysis
- 11.2.19.4. Recent Developments
- 11.2.19.5. Financials (Based on Availability)
- 11.2.20 Shandong Xinhua Pharmaceutical
- 11.2.20.1. Overview
- 11.2.20.2. Products
- 11.2.20.3. SWOT Analysis
- 11.2.20.4. Recent Developments
- 11.2.20.5. Financials (Based on Availability)
- 11.2.21 Lonza group
- 11.2.21.1. Overview
- 11.2.21.2. Products
- 11.2.21.3. SWOT Analysis
- 11.2.21.4. Recent Developments
- 11.2.21.5. Financials (Based on Availability)
- 11.2.22 Huahai Pharmaceutical
- 11.2.22.1. Overview
- 11.2.22.2. Products
- 11.2.22.3. SWOT Analysis
- 11.2.22.4. Recent Developments
- 11.2.22.5. Financials (Based on Availability)
- 11.2.23 Haerbin Pharmaceutical Group
- 11.2.23.1. Overview
- 11.2.23.2. Products
- 11.2.23.3. SWOT Analysis
- 11.2.23.4. Recent Developments
- 11.2.23.5. Financials (Based on Availability)
- 11.2.24 Cipla
- 11.2.24.1. Overview
- 11.2.24.2. Products
- 11.2.24.3. SWOT Analysis
- 11.2.24.4. Recent Developments
- 11.2.24.5. Financials (Based on Availability)
- 11.2.25 Tian Yao
- 11.2.25.1. Overview
- 11.2.25.2. Products
- 11.2.25.3. SWOT Analysis
- 11.2.25.4. Recent Developments
- 11.2.25.5. Financials (Based on Availability)
- 11.2.26 Lupin
- 11.2.26.1. Overview
- 11.2.26.2. Products
- 11.2.26.3. SWOT Analysis
- 11.2.26.4. Recent Developments
- 11.2.26.5. Financials (Based on Availability)
- 11.2.27 North East Pharmaceutical
- 11.2.27.1. Overview
- 11.2.27.2. Products
- 11.2.27.3. SWOT Analysis
- 11.2.27.4. Recent Developments
- 11.2.27.5. Financials (Based on Availability)
- 11.2.28 Albemarle
- 11.2.28.1. Overview
- 11.2.28.2. Products
- 11.2.28.3. SWOT Analysis
- 11.2.28.4. Recent Developments
- 11.2.28.5. Financials (Based on Availability)
- 11.2.29 Shandong Lukang Pharmaceutical
- 11.2.29.1. Overview
- 11.2.29.2. Products
- 11.2.29.3. SWOT Analysis
- 11.2.29.4. Recent Developments
- 11.2.29.5. Financials (Based on Availability)
- 11.2.30 Jiangsu Hengrui Medicine
- 11.2.30.1. Overview
- 11.2.30.2. Products
- 11.2.30.3. SWOT Analysis
- 11.2.30.4. Recent Developments
- 11.2.30.5. Financials (Based on Availability)
- 11.2.1 Teva
List of Figures
- Figure 1: Global Active Pharma Ingredient Revenue Breakdown (million, %) by Region 2025 & 2033
- Figure 2: Global Active Pharma Ingredient Volume Breakdown (K, %) by Region 2025 & 2033
- Figure 3: North America Active Pharma Ingredient Revenue (million), by Application 2025 & 2033
- Figure 4: North America Active Pharma Ingredient Volume (K), by Application 2025 & 2033
- Figure 5: North America Active Pharma Ingredient Revenue Share (%), by Application 2025 & 2033
- Figure 6: North America Active Pharma Ingredient Volume Share (%), by Application 2025 & 2033
- Figure 7: North America Active Pharma Ingredient Revenue (million), by Types 2025 & 2033
- Figure 8: North America Active Pharma Ingredient Volume (K), by Types 2025 & 2033
- Figure 9: North America Active Pharma Ingredient Revenue Share (%), by Types 2025 & 2033
- Figure 10: North America Active Pharma Ingredient Volume Share (%), by Types 2025 & 2033
- Figure 11: North America Active Pharma Ingredient Revenue (million), by Country 2025 & 2033
- Figure 12: North America Active Pharma Ingredient Volume (K), by Country 2025 & 2033
- Figure 13: North America Active Pharma Ingredient Revenue Share (%), by Country 2025 & 2033
- Figure 14: North America Active Pharma Ingredient Volume Share (%), by Country 2025 & 2033
- Figure 15: South America Active Pharma Ingredient Revenue (million), by Application 2025 & 2033
- Figure 16: South America Active Pharma Ingredient Volume (K), by Application 2025 & 2033
- Figure 17: South America Active Pharma Ingredient Revenue Share (%), by Application 2025 & 2033
- Figure 18: South America Active Pharma Ingredient Volume Share (%), by Application 2025 & 2033
- Figure 19: South America Active Pharma Ingredient Revenue (million), by Types 2025 & 2033
- Figure 20: South America Active Pharma Ingredient Volume (K), by Types 2025 & 2033
- Figure 21: South America Active Pharma Ingredient Revenue Share (%), by Types 2025 & 2033
- Figure 22: South America Active Pharma Ingredient Volume Share (%), by Types 2025 & 2033
- Figure 23: South America Active Pharma Ingredient Revenue (million), by Country 2025 & 2033
- Figure 24: South America Active Pharma Ingredient Volume (K), by Country 2025 & 2033
- Figure 25: South America Active Pharma Ingredient Revenue Share (%), by Country 2025 & 2033
- Figure 26: South America Active Pharma Ingredient Volume Share (%), by Country 2025 & 2033
- Figure 27: Europe Active Pharma Ingredient Revenue (million), by Application 2025 & 2033
- Figure 28: Europe Active Pharma Ingredient Volume (K), by Application 2025 & 2033
- Figure 29: Europe Active Pharma Ingredient Revenue Share (%), by Application 2025 & 2033
- Figure 30: Europe Active Pharma Ingredient Volume Share (%), by Application 2025 & 2033
- Figure 31: Europe Active Pharma Ingredient Revenue (million), by Types 2025 & 2033
- Figure 32: Europe Active Pharma Ingredient Volume (K), by Types 2025 & 2033
- Figure 33: Europe Active Pharma Ingredient Revenue Share (%), by Types 2025 & 2033
- Figure 34: Europe Active Pharma Ingredient Volume Share (%), by Types 2025 & 2033
- Figure 35: Europe Active Pharma Ingredient Revenue (million), by Country 2025 & 2033
- Figure 36: Europe Active Pharma Ingredient Volume (K), by Country 2025 & 2033
- Figure 37: Europe Active Pharma Ingredient Revenue Share (%), by Country 2025 & 2033
- Figure 38: Europe Active Pharma Ingredient Volume Share (%), by Country 2025 & 2033
- Figure 39: Middle East & Africa Active Pharma Ingredient Revenue (million), by Application 2025 & 2033
- Figure 40: Middle East & Africa Active Pharma Ingredient Volume (K), by Application 2025 & 2033
- Figure 41: Middle East & Africa Active Pharma Ingredient Revenue Share (%), by Application 2025 & 2033
- Figure 42: Middle East & Africa Active Pharma Ingredient Volume Share (%), by Application 2025 & 2033
- Figure 43: Middle East & Africa Active Pharma Ingredient Revenue (million), by Types 2025 & 2033
- Figure 44: Middle East & Africa Active Pharma Ingredient Volume (K), by Types 2025 & 2033
- Figure 45: Middle East & Africa Active Pharma Ingredient Revenue Share (%), by Types 2025 & 2033
- Figure 46: Middle East & Africa Active Pharma Ingredient Volume Share (%), by Types 2025 & 2033
- Figure 47: Middle East & Africa Active Pharma Ingredient Revenue (million), by Country 2025 & 2033
- Figure 48: Middle East & Africa Active Pharma Ingredient Volume (K), by Country 2025 & 2033
- Figure 49: Middle East & Africa Active Pharma Ingredient Revenue Share (%), by Country 2025 & 2033
- Figure 50: Middle East & Africa Active Pharma Ingredient Volume Share (%), by Country 2025 & 2033
- Figure 51: Asia Pacific Active Pharma Ingredient Revenue (million), by Application 2025 & 2033
- Figure 52: Asia Pacific Active Pharma Ingredient Volume (K), by Application 2025 & 2033
- Figure 53: Asia Pacific Active Pharma Ingredient Revenue Share (%), by Application 2025 & 2033
- Figure 54: Asia Pacific Active Pharma Ingredient Volume Share (%), by Application 2025 & 2033
- Figure 55: Asia Pacific Active Pharma Ingredient Revenue (million), by Types 2025 & 2033
- Figure 56: Asia Pacific Active Pharma Ingredient Volume (K), by Types 2025 & 2033
- Figure 57: Asia Pacific Active Pharma Ingredient Revenue Share (%), by Types 2025 & 2033
- Figure 58: Asia Pacific Active Pharma Ingredient Volume Share (%), by Types 2025 & 2033
- Figure 59: Asia Pacific Active Pharma Ingredient Revenue (million), by Country 2025 & 2033
- Figure 60: Asia Pacific Active Pharma Ingredient Volume (K), by Country 2025 & 2033
- Figure 61: Asia Pacific Active Pharma Ingredient Revenue Share (%), by Country 2025 & 2033
- Figure 62: Asia Pacific Active Pharma Ingredient Volume Share (%), by Country 2025 & 2033
List of Tables
- Table 1: Global Active Pharma Ingredient Revenue million Forecast, by Application 2020 & 2033
- Table 2: Global Active Pharma Ingredient Volume K Forecast, by Application 2020 & 2033
- Table 3: Global Active Pharma Ingredient Revenue million Forecast, by Types 2020 & 2033
- Table 4: Global Active Pharma Ingredient Volume K Forecast, by Types 2020 & 2033
- Table 5: Global Active Pharma Ingredient Revenue million Forecast, by Region 2020 & 2033
- Table 6: Global Active Pharma Ingredient Volume K Forecast, by Region 2020 & 2033
- Table 7: Global Active Pharma Ingredient Revenue million Forecast, by Application 2020 & 2033
- Table 8: Global Active Pharma Ingredient Volume K Forecast, by Application 2020 & 2033
- Table 9: Global Active Pharma Ingredient Revenue million Forecast, by Types 2020 & 2033
- Table 10: Global Active Pharma Ingredient Volume K Forecast, by Types 2020 & 2033
- Table 11: Global Active Pharma Ingredient Revenue million Forecast, by Country 2020 & 2033
- Table 12: Global Active Pharma Ingredient Volume K Forecast, by Country 2020 & 2033
- Table 13: United States Active Pharma Ingredient Revenue (million) Forecast, by Application 2020 & 2033
- Table 14: United States Active Pharma Ingredient Volume (K) Forecast, by Application 2020 & 2033
- Table 15: Canada Active Pharma Ingredient Revenue (million) Forecast, by Application 2020 & 2033
- Table 16: Canada Active Pharma Ingredient Volume (K) Forecast, by Application 2020 & 2033
- Table 17: Mexico Active Pharma Ingredient Revenue (million) Forecast, by Application 2020 & 2033
- Table 18: Mexico Active Pharma Ingredient Volume (K) Forecast, by Application 2020 & 2033
- Table 19: Global Active Pharma Ingredient Revenue million Forecast, by Application 2020 & 2033
- Table 20: Global Active Pharma Ingredient Volume K Forecast, by Application 2020 & 2033
- Table 21: Global Active Pharma Ingredient Revenue million Forecast, by Types 2020 & 2033
- Table 22: Global Active Pharma Ingredient Volume K Forecast, by Types 2020 & 2033
- Table 23: Global Active Pharma Ingredient Revenue million Forecast, by Country 2020 & 2033
- Table 24: Global Active Pharma Ingredient Volume K Forecast, by Country 2020 & 2033
- Table 25: Brazil Active Pharma Ingredient Revenue (million) Forecast, by Application 2020 & 2033
- Table 26: Brazil Active Pharma Ingredient Volume (K) Forecast, by Application 2020 & 2033
- Table 27: Argentina Active Pharma Ingredient Revenue (million) Forecast, by Application 2020 & 2033
- Table 28: Argentina Active Pharma Ingredient Volume (K) Forecast, by Application 2020 & 2033
- Table 29: Rest of South America Active Pharma Ingredient Revenue (million) Forecast, by Application 2020 & 2033
- Table 30: Rest of South America Active Pharma Ingredient Volume (K) Forecast, by Application 2020 & 2033
- Table 31: Global Active Pharma Ingredient Revenue million Forecast, by Application 2020 & 2033
- Table 32: Global Active Pharma Ingredient Volume K Forecast, by Application 2020 & 2033
- Table 33: Global Active Pharma Ingredient Revenue million Forecast, by Types 2020 & 2033
- Table 34: Global Active Pharma Ingredient Volume K Forecast, by Types 2020 & 2033
- Table 35: Global Active Pharma Ingredient Revenue million Forecast, by Country 2020 & 2033
- Table 36: Global Active Pharma Ingredient Volume K Forecast, by Country 2020 & 2033
- Table 37: United Kingdom Active Pharma Ingredient Revenue (million) Forecast, by Application 2020 & 2033
- Table 38: United Kingdom Active Pharma Ingredient Volume (K) Forecast, by Application 2020 & 2033
- Table 39: Germany Active Pharma Ingredient Revenue (million) Forecast, by Application 2020 & 2033
- Table 40: Germany Active Pharma Ingredient Volume (K) Forecast, by Application 2020 & 2033
- Table 41: France Active Pharma Ingredient Revenue (million) Forecast, by Application 2020 & 2033
- Table 42: France Active Pharma Ingredient Volume (K) Forecast, by Application 2020 & 2033
- Table 43: Italy Active Pharma Ingredient Revenue (million) Forecast, by Application 2020 & 2033
- Table 44: Italy Active Pharma Ingredient Volume (K) Forecast, by Application 2020 & 2033
- Table 45: Spain Active Pharma Ingredient Revenue (million) Forecast, by Application 2020 & 2033
- Table 46: Spain Active Pharma Ingredient Volume (K) Forecast, by Application 2020 & 2033
- Table 47: Russia Active Pharma Ingredient Revenue (million) Forecast, by Application 2020 & 2033
- Table 48: Russia Active Pharma Ingredient Volume (K) Forecast, by Application 2020 & 2033
- Table 49: Benelux Active Pharma Ingredient Revenue (million) Forecast, by Application 2020 & 2033
- Table 50: Benelux Active Pharma Ingredient Volume (K) Forecast, by Application 2020 & 2033
- Table 51: Nordics Active Pharma Ingredient Revenue (million) Forecast, by Application 2020 & 2033
- Table 52: Nordics Active Pharma Ingredient Volume (K) Forecast, by Application 2020 & 2033
- Table 53: Rest of Europe Active Pharma Ingredient Revenue (million) Forecast, by Application 2020 & 2033
- Table 54: Rest of Europe Active Pharma Ingredient Volume (K) Forecast, by Application 2020 & 2033
- Table 55: Global Active Pharma Ingredient Revenue million Forecast, by Application 2020 & 2033
- Table 56: Global Active Pharma Ingredient Volume K Forecast, by Application 2020 & 2033
- Table 57: Global Active Pharma Ingredient Revenue million Forecast, by Types 2020 & 2033
- Table 58: Global Active Pharma Ingredient Volume K Forecast, by Types 2020 & 2033
- Table 59: Global Active Pharma Ingredient Revenue million Forecast, by Country 2020 & 2033
- Table 60: Global Active Pharma Ingredient Volume K Forecast, by Country 2020 & 2033
- Table 61: Turkey Active Pharma Ingredient Revenue (million) Forecast, by Application 2020 & 2033
- Table 62: Turkey Active Pharma Ingredient Volume (K) Forecast, by Application 2020 & 2033
- Table 63: Israel Active Pharma Ingredient Revenue (million) Forecast, by Application 2020 & 2033
- Table 64: Israel Active Pharma Ingredient Volume (K) Forecast, by Application 2020 & 2033
- Table 65: GCC Active Pharma Ingredient Revenue (million) Forecast, by Application 2020 & 2033
- Table 66: GCC Active Pharma Ingredient Volume (K) Forecast, by Application 2020 & 2033
- Table 67: North Africa Active Pharma Ingredient Revenue (million) Forecast, by Application 2020 & 2033
- Table 68: North Africa Active Pharma Ingredient Volume (K) Forecast, by Application 2020 & 2033
- Table 69: South Africa Active Pharma Ingredient Revenue (million) Forecast, by Application 2020 & 2033
- Table 70: South Africa Active Pharma Ingredient Volume (K) Forecast, by Application 2020 & 2033
- Table 71: Rest of Middle East & Africa Active Pharma Ingredient Revenue (million) Forecast, by Application 2020 & 2033
- Table 72: Rest of Middle East & Africa Active Pharma Ingredient Volume (K) Forecast, by Application 2020 & 2033
- Table 73: Global Active Pharma Ingredient Revenue million Forecast, by Application 2020 & 2033
- Table 74: Global Active Pharma Ingredient Volume K Forecast, by Application 2020 & 2033
- Table 75: Global Active Pharma Ingredient Revenue million Forecast, by Types 2020 & 2033
- Table 76: Global Active Pharma Ingredient Volume K Forecast, by Types 2020 & 2033
- Table 77: Global Active Pharma Ingredient Revenue million Forecast, by Country 2020 & 2033
- Table 78: Global Active Pharma Ingredient Volume K Forecast, by Country 2020 & 2033
- Table 79: China Active Pharma Ingredient Revenue (million) Forecast, by Application 2020 & 2033
- Table 80: China Active Pharma Ingredient Volume (K) Forecast, by Application 2020 & 2033
- Table 81: India Active Pharma Ingredient Revenue (million) Forecast, by Application 2020 & 2033
- Table 82: India Active Pharma Ingredient Volume (K) Forecast, by Application 2020 & 2033
- Table 83: Japan Active Pharma Ingredient Revenue (million) Forecast, by Application 2020 & 2033
- Table 84: Japan Active Pharma Ingredient Volume (K) Forecast, by Application 2020 & 2033
- Table 85: South Korea Active Pharma Ingredient Revenue (million) Forecast, by Application 2020 & 2033
- Table 86: South Korea Active Pharma Ingredient Volume (K) Forecast, by Application 2020 & 2033
- Table 87: ASEAN Active Pharma Ingredient Revenue (million) Forecast, by Application 2020 & 2033
- Table 88: ASEAN Active Pharma Ingredient Volume (K) Forecast, by Application 2020 & 2033
- Table 89: Oceania Active Pharma Ingredient Revenue (million) Forecast, by Application 2020 & 2033
- Table 90: Oceania Active Pharma Ingredient Volume (K) Forecast, by Application 2020 & 2033
- Table 91: Rest of Asia Pacific Active Pharma Ingredient Revenue (million) Forecast, by Application 2020 & 2033
- Table 92: Rest of Asia Pacific Active Pharma Ingredient Volume (K) Forecast, by Application 2020 & 2033
Frequently Asked Questions
1. What is the projected Compound Annual Growth Rate (CAGR) of the Active Pharma Ingredient?
The projected CAGR is approximately 3.9%.
2. Which companies are prominent players in the Active Pharma Ingredient?
Key companies in the market include Teva, Novartis, Pfizer, Johnson & Johnson, Mylan, North China Pharmaceutical Group, Dr. Reddy’s Laboratories, Roche, Aurobindo pharma, Sun Pharmaceutical Industries, Boehringer Ingelheim GmbH, Bayer, BASF, DSM, Zhejiang Medicine, Biocon, Johnson Matthey, Hisun Pharmacy, Cambrex, Shandong Xinhua Pharmaceutical, Lonza group, Huahai Pharmaceutical, Haerbin Pharmaceutical Group, Cipla, Tian Yao, Lupin, North East Pharmaceutical, Albemarle, Shandong Lukang Pharmaceutical, Jiangsu Hengrui Medicine.
3. What are the main segments of the Active Pharma Ingredient?
The market segments include Application, Types.
4. Can you provide details about the market size?
The market size is estimated to be USD 23390 million as of 2022.
5. What are some drivers contributing to market growth?
N/A
6. What are the notable trends driving market growth?
N/A
7. Are there any restraints impacting market growth?
N/A
8. Can you provide examples of recent developments in the market?
N/A
9. What pricing options are available for accessing the report?
Pricing options include single-user, multi-user, and enterprise licenses priced at USD 3350.00, USD 5025.00, and USD 6700.00 respectively.
10. Is the market size provided in terms of value or volume?
The market size is provided in terms of value, measured in million and volume, measured in K.
11. Are there any specific market keywords associated with the report?
Yes, the market keyword associated with the report is "Active Pharma Ingredient," which aids in identifying and referencing the specific market segment covered.
12. How do I determine which pricing option suits my needs best?
The pricing options vary based on user requirements and access needs. Individual users may opt for single-user licenses, while businesses requiring broader access may choose multi-user or enterprise licenses for cost-effective access to the report.
13. Are there any additional resources or data provided in the Active Pharma Ingredient report?
While the report offers comprehensive insights, it's advisable to review the specific contents or supplementary materials provided to ascertain if additional resources or data are available.
14. How can I stay updated on further developments or reports in the Active Pharma Ingredient?
To stay informed about further developments, trends, and reports in the Active Pharma Ingredient, consider subscribing to industry newsletters, following relevant companies and organizations, or regularly checking reputable industry news sources and publications.
Methodology
Step 1 - Identification of Relevant Samples Size from Population Database


Step 2 - Approaches for Defining Global Market Size (Value, Volume* & Price*)

Note*: In applicable scenarios
Step 3 - Data Sources
Primary Research
- Web Analytics
- Survey Reports
- Research Institute
- Latest Research Reports
- Opinion Leaders
Secondary Research
- Annual Reports
- White Paper
- Latest Press Release
- Industry Association
- Paid Database
- Investor Presentations

Step 4 - Data Triangulation
Involves using different sources of information in order to increase the validity of a study
These sources are likely to be stakeholders in a program - participants, other researchers, program staff, other community members, and so on.
Then we put all data in single framework & apply various statistical tools to find out the dynamic on the market.
During the analysis stage, feedback from the stakeholder groups would be compared to determine areas of agreement as well as areas of divergence