

Key Insights
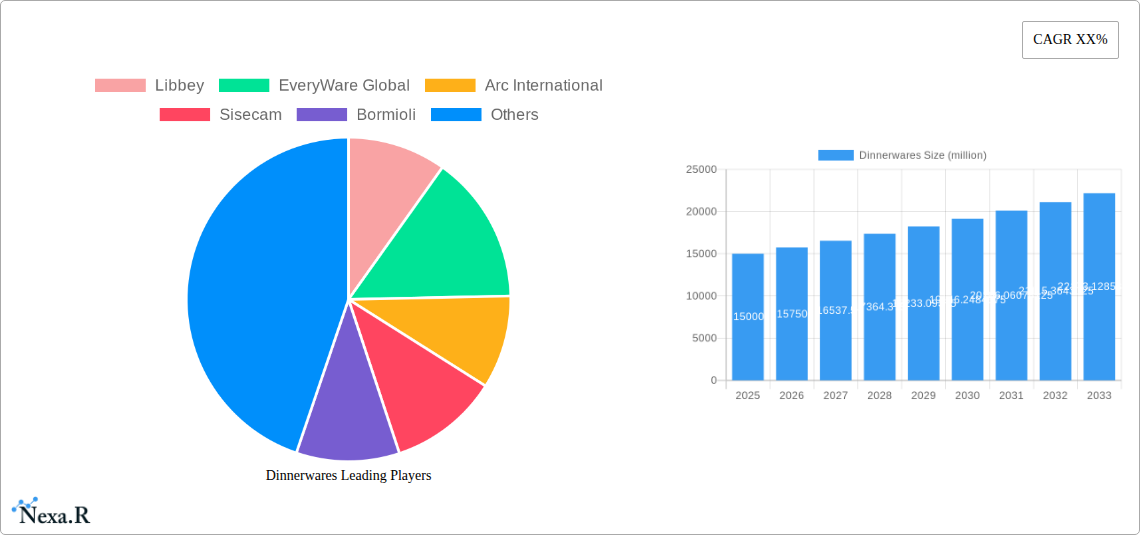
The global dinnerware market, a significant segment within the broader tableware industry, is experiencing steady growth fueled by several key factors. Rising disposable incomes, particularly in developing economies, are driving increased consumer spending on premium dinnerware sets. Furthermore, evolving lifestyle trends, such as a renewed focus on home entertaining and dining experiences, are boosting demand. The market is segmented by material (porcelain, ceramic, stoneware, etc.), style (formal, casual, rustic, etc.), price point (luxury, mid-range, budget), and distribution channel (online, retail stores, specialty stores). Key players, including Libbey, EveryWare Global, Arc International, and others, are strategically focusing on product innovation, expanding their product portfolios to cater to evolving consumer preferences, and leveraging online channels for increased reach. The market also witnesses strong growth from the increasing popularity of themed dinner sets or collections reflecting specific lifestyle trends. The competitive landscape is characterized by a mix of established global brands and regional players, with a focus on branding, design, and efficient supply chains. While challenges such as fluctuations in raw material prices and economic downturns can impact market growth, the overall outlook remains positive, driven by consumer demand and industry innovation.
Despite some potential headwinds such as supply chain disruptions and material cost fluctuations, the long-term projection for the dinnerware market remains optimistic. The increasing adoption of online shopping channels provides significant opportunities for growth, particularly for direct-to-consumer brands. Furthermore, the market is witnessing a shift towards sustainable and ethically sourced materials, influencing purchasing decisions and shaping manufacturing processes. We anticipate continued consolidation within the industry as larger players acquire smaller companies to achieve economies of scale and expand their market share. Regional variations in growth rates will be influenced by factors like cultural preferences, economic conditions, and government regulations. However, a robust growth trajectory is anticipated across all major regions, with significant opportunities in emerging markets, where disposable incomes and awareness of premium dining experiences are rising. Innovative designs, collaborations with influencers, and targeted marketing strategies will further propel market expansion.
Dinnerware Market Report: 2019-2033
This comprehensive report provides a detailed analysis of the global dinnerware market, encompassing historical data (2019-2024), current estimations (2025), and future forecasts (2025-2033). The study delves into market dynamics, growth trends, regional performance, product landscape, competitive analysis, and future opportunities within the parent market of Home Furnishings and the child market of Tableware. The report leverages extensive primary and secondary research to offer actionable insights for industry professionals, investors, and stakeholders. The market size is presented in million units.
Dinnerwares Market Dynamics & Structure
The global dinnerware market exhibits a moderately consolidated structure, with key players holding significant market share. Technological innovations, particularly in materials and manufacturing processes, are driving growth. Stringent regulatory frameworks concerning material safety and environmental impact influence production practices. Competition from substitute products like disposable tableware impacts market share. End-user demographics, particularly shifts in consumer preferences and lifestyle trends, significantly influence demand. The historical period (2019-2024) witnessed several notable mergers and acquisitions (M&A) deals, with xx million units in total deal volume, consolidating market power among leading players.
- Market Concentration: Moderately consolidated, with top 5 players holding approximately xx% market share in 2025.
- Technological Innovation: Focus on sustainable materials (e.g., recycled glass, eco-friendly ceramics), automated manufacturing, and innovative designs.
- Regulatory Frameworks: Stringent food safety regulations and environmental standards impact material sourcing and production.
- Competitive Substitutes: Disposable tableware and alternative serving solutions pose a competitive challenge.
- End-User Demographics: Growing demand from millennials and Gen Z, focusing on sustainable and aesthetically pleasing products.
- M&A Trends: Consolidation through strategic acquisitions to expand product portfolios and geographic reach.
Dinnerwares Growth Trends & Insights
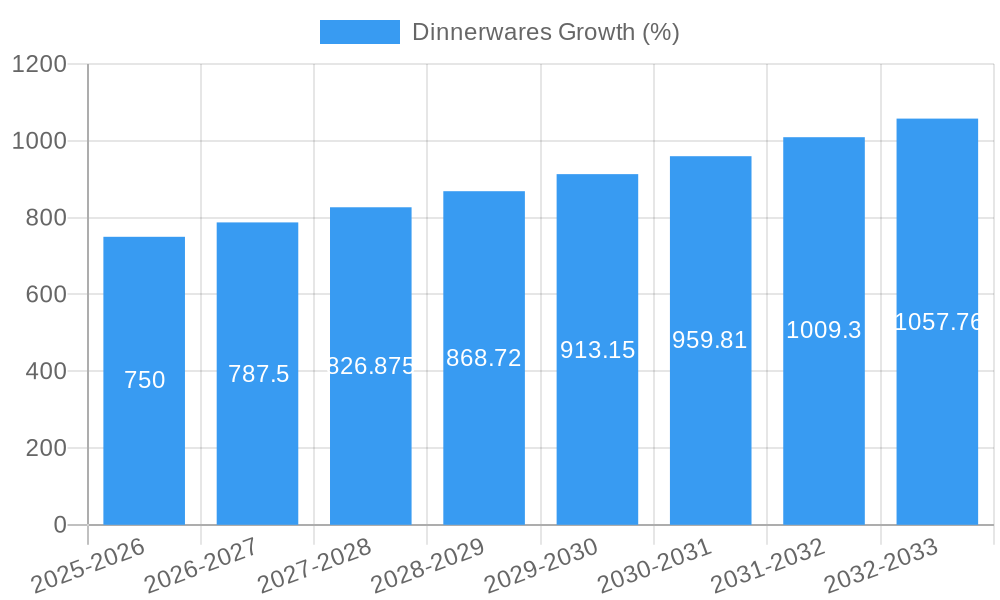
The global dinnerware market experienced a compound annual growth rate (CAGR) of xx% during the historical period (2019-2024), reaching xx million units in 2024. Market penetration in key regions is high, with saturation observed in mature markets. However, emerging markets offer significant growth potential. Technological disruptions, such as the introduction of 3D-printed dinnerware, are reshaping the product landscape. Shifts in consumer behavior, emphasizing sustainability and personalized experiences, are shaping product design and marketing strategies. The forecast period (2025-2033) projects a CAGR of xx%, driven by increasing disposable incomes and changing lifestyle trends. Market size is expected to reach xx million units by 2033.
Dominant Regions, Countries, or Segments in Dinnerwares
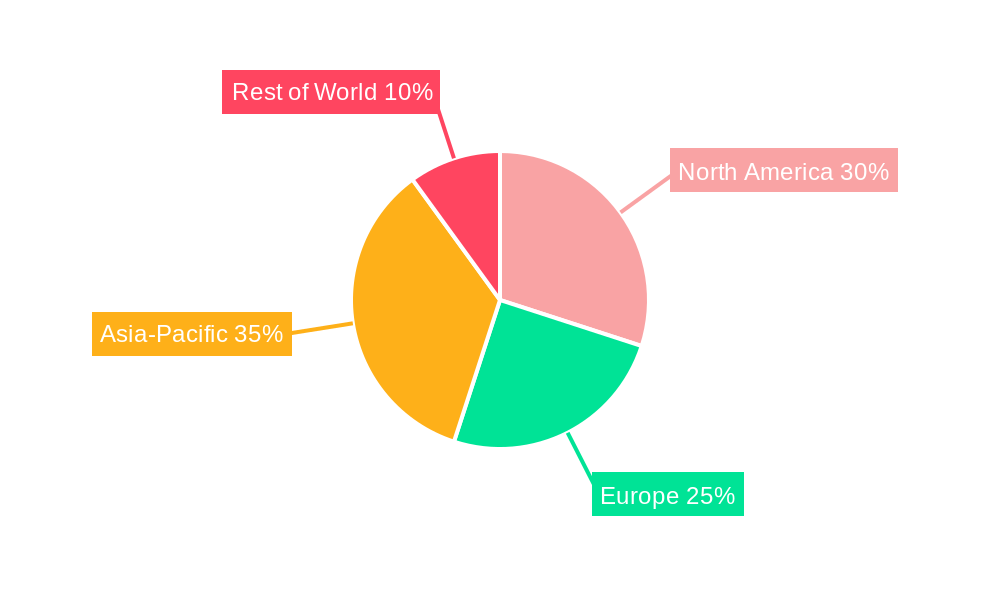
North America and Europe currently dominate the global dinnerware market, accounting for approximately xx% of the total market share in 2025. Strong consumer spending, well-established distribution networks, and a preference for high-quality dinnerware contribute to this dominance. However, Asia-Pacific is emerging as a significant growth region, fueled by rapid urbanization, rising disposable incomes, and a growing middle class.
- North America: High per capita consumption, established retail infrastructure, and preference for premium products.
- Europe: Mature market with strong demand for traditional and innovative dinnerware designs.
- Asia-Pacific: Rapid economic growth, rising disposable incomes, and increasing demand for western-style dining experiences driving significant growth.
- Other Regions: Moderate growth driven by localized preferences and emerging market expansion.
Dinnerwares Product Landscape
The dinnerware market offers a wide range of products, from traditional ceramic and porcelain sets to innovative materials like melamine and bamboo. Product innovations focus on durability, functionality, and aesthetic appeal. Performance metrics emphasize chip resistance, microwave and dishwasher safety, and overall longevity. Unique selling propositions include eco-friendly materials, customized designs, and advanced manufacturing techniques.
Key Drivers, Barriers & Challenges in Dinnerwares
Key Drivers: Rising disposable incomes in developing economies, increasing consumer preference for aesthetically pleasing and high-quality tableware, growing popularity of home-cooked meals and entertaining, and technological advancements in manufacturing processes.
Challenges: Fluctuating raw material prices, intense competition, and the growing popularity of disposable tableware pose significant challenges. Supply chain disruptions, particularly concerning raw material sourcing, can impact production and delivery. Regulatory hurdles related to material safety and environmental concerns further complicate the market dynamics.
Emerging Opportunities in Dinnerwares
Emerging opportunities lie in developing sustainable and eco-friendly dinnerware options, exploring personalized and customizable designs, and tapping into untapped markets in developing economies. Expanding into online retail channels and offering subscription services for replacement or upgrade programs represent further avenues for growth.
Growth Accelerators in the Dinnerwares Industry
Technological advancements, strategic partnerships to expand distribution networks, and expansion into new markets, particularly in developing economies, will be crucial catalysts for long-term growth. Developing innovative product designs that cater to evolving consumer preferences will also be key to success.
Key Players Shaping the Dinnerwares Market
- Libbey
- EveryWare Global
- Arc International
- Sisecam
- Bormioli
- Villeroy and Boch
- Rosenthal GmbH
- Meissen
- KAHLA/Thüringen Porzellan GmbH
- Seltmann Weiden
- Schönwald
- WMF
- Fiskars Group
- Lenox
- Portmeirion Group PLC
- The Oneida Group
- Homer Laughlin China
- Noritake
- Narumi
- Churchill China
- Tata Ceramics
- Songfa Ceramics
- Hualian China
- Sitong Group
- The Great Wall
Notable Milestones in Dinnerwares Sector
- 2020: Increased adoption of sustainable materials by major players.
- 2021: Launch of several innovative dinnerware designs incorporating new technologies.
- 2022: Significant M&A activity leading to market consolidation.
- 2023: Growing trend of personalized and customizable dinnerware options.
- 2024: Increased focus on direct-to-consumer sales channels.
In-Depth Dinnerwares Market Outlook
The global dinnerware market is poised for continued growth, driven by evolving consumer preferences and technological advancements. Strategic investments in research and development, expanding into new markets, and focusing on sustainable practices will be crucial for companies seeking to thrive in this competitive landscape. The forecast period presents significant opportunities for companies to capitalize on emerging trends and enhance their market position.
Dinnerwares Segmentation
-
1. Application
- 1.1. Commercial Use
- 1.2. Residential Use
-
2. Types
- 2.1. Glass
- 2.2. Stainless Steel
- 2.3. Plastic
- 2.4. Ceramics
- 2.5. Others
Dinnerwares Segmentation By Geography
-
1. North America
- 1.1. United States
- 1.2. Canada
- 1.3. Mexico
-
2. South America
- 2.1. Brazil
- 2.2. Argentina
- 2.3. Rest of South America
-
3. Europe
- 3.1. United Kingdom
- 3.2. Germany
- 3.3. France
- 3.4. Italy
- 3.5. Spain
- 3.6. Russia
- 3.7. Benelux
- 3.8. Nordics
- 3.9. Rest of Europe
-
4. Middle East & Africa
- 4.1. Turkey
- 4.2. Israel
- 4.3. GCC
- 4.4. North Africa
- 4.5. South Africa
- 4.6. Rest of Middle East & Africa
-
5. Asia Pacific
- 5.1. China
- 5.2. India
- 5.3. Japan
- 5.4. South Korea
- 5.5. ASEAN
- 5.6. Oceania
- 5.7. Rest of Asia Pacific
Dinnerwares REPORT HIGHLIGHTS
| Aspects | Details |
|---|---|
| Study Period | 2019-2033 |
| Base Year | 2024 |
| Estimated Year | 2025 |
| Forecast Period | 2025-2033 |
| Historical Period | 2019-2024 |
| Growth Rate | CAGR of XX% from 2019-2033 |
| Segmentation |
|
Table of Contents
- 1. Introduction
- 1.1. Research Scope
- 1.2. Market Segmentation
- 1.3. Research Methodology
- 1.4. Definitions and Assumptions
- 2. Executive Summary
- 2.1. Introduction
- 3. Market Dynamics
- 3.1. Introduction
- 3.2. Market Drivers
- 3.3. Market Restrains
- 3.4. Market Trends
- 4. Market Factor Analysis
- 4.1. Porters Five Forces
- 4.2. Supply/Value Chain
- 4.3. PESTEL analysis
- 4.4. Market Entropy
- 4.5. Patent/Trademark Analysis
- 5. Global Dinnerwares Analysis, Insights and Forecast, 2019-2031
- 5.1. Market Analysis, Insights and Forecast - by Application
- 5.1.1. Commercial Use
- 5.1.2. Residential Use
- 5.2. Market Analysis, Insights and Forecast - by Types
- 5.2.1. Glass
- 5.2.2. Stainless Steel
- 5.2.3. Plastic
- 5.2.4. Ceramics
- 5.2.5. Others
- 5.3. Market Analysis, Insights and Forecast - by Region
- 5.3.1. North America
- 5.3.2. South America
- 5.3.3. Europe
- 5.3.4. Middle East & Africa
- 5.3.5. Asia Pacific
- 5.1. Market Analysis, Insights and Forecast - by Application
- 6. North America Dinnerwares Analysis, Insights and Forecast, 2019-2031
- 6.1. Market Analysis, Insights and Forecast - by Application
- 6.1.1. Commercial Use
- 6.1.2. Residential Use
- 6.2. Market Analysis, Insights and Forecast - by Types
- 6.2.1. Glass
- 6.2.2. Stainless Steel
- 6.2.3. Plastic
- 6.2.4. Ceramics
- 6.2.5. Others
- 6.1. Market Analysis, Insights and Forecast - by Application
- 7. South America Dinnerwares Analysis, Insights and Forecast, 2019-2031
- 7.1. Market Analysis, Insights and Forecast - by Application
- 7.1.1. Commercial Use
- 7.1.2. Residential Use
- 7.2. Market Analysis, Insights and Forecast - by Types
- 7.2.1. Glass
- 7.2.2. Stainless Steel
- 7.2.3. Plastic
- 7.2.4. Ceramics
- 7.2.5. Others
- 7.1. Market Analysis, Insights and Forecast - by Application
- 8. Europe Dinnerwares Analysis, Insights and Forecast, 2019-2031
- 8.1. Market Analysis, Insights and Forecast - by Application
- 8.1.1. Commercial Use
- 8.1.2. Residential Use
- 8.2. Market Analysis, Insights and Forecast - by Types
- 8.2.1. Glass
- 8.2.2. Stainless Steel
- 8.2.3. Plastic
- 8.2.4. Ceramics
- 8.2.5. Others
- 8.1. Market Analysis, Insights and Forecast - by Application
- 9. Middle East & Africa Dinnerwares Analysis, Insights and Forecast, 2019-2031
- 9.1. Market Analysis, Insights and Forecast - by Application
- 9.1.1. Commercial Use
- 9.1.2. Residential Use
- 9.2. Market Analysis, Insights and Forecast - by Types
- 9.2.1. Glass
- 9.2.2. Stainless Steel
- 9.2.3. Plastic
- 9.2.4. Ceramics
- 9.2.5. Others
- 9.1. Market Analysis, Insights and Forecast - by Application
- 10. Asia Pacific Dinnerwares Analysis, Insights and Forecast, 2019-2031
- 10.1. Market Analysis, Insights and Forecast - by Application
- 10.1.1. Commercial Use
- 10.1.2. Residential Use
- 10.2. Market Analysis, Insights and Forecast - by Types
- 10.2.1. Glass
- 10.2.2. Stainless Steel
- 10.2.3. Plastic
- 10.2.4. Ceramics
- 10.2.5. Others
- 10.1. Market Analysis, Insights and Forecast - by Application
- 11. Competitive Analysis
- 11.1. Global Market Share Analysis 2024
- 11.2. Company Profiles
- 11.2.1 Libbey
- 11.2.1.1. Overview
- 11.2.1.2. Products
- 11.2.1.3. SWOT Analysis
- 11.2.1.4. Recent Developments
- 11.2.1.5. Financials (Based on Availability)
- 11.2.2 EveryWare Global
- 11.2.2.1. Overview
- 11.2.2.2. Products
- 11.2.2.3. SWOT Analysis
- 11.2.2.4. Recent Developments
- 11.2.2.5. Financials (Based on Availability)
- 11.2.3 Arc International
- 11.2.3.1. Overview
- 11.2.3.2. Products
- 11.2.3.3. SWOT Analysis
- 11.2.3.4. Recent Developments
- 11.2.3.5. Financials (Based on Availability)
- 11.2.4 Sisecam
- 11.2.4.1. Overview
- 11.2.4.2. Products
- 11.2.4.3. SWOT Analysis
- 11.2.4.4. Recent Developments
- 11.2.4.5. Financials (Based on Availability)
- 11.2.5 Bormioli
- 11.2.5.1. Overview
- 11.2.5.2. Products
- 11.2.5.3. SWOT Analysis
- 11.2.5.4. Recent Developments
- 11.2.5.5. Financials (Based on Availability)
- 11.2.6 Villeroy and Boch
- 11.2.6.1. Overview
- 11.2.6.2. Products
- 11.2.6.3. SWOT Analysis
- 11.2.6.4. Recent Developments
- 11.2.6.5. Financials (Based on Availability)
- 11.2.7 Rosenthal GmbH
- 11.2.7.1. Overview
- 11.2.7.2. Products
- 11.2.7.3. SWOT Analysis
- 11.2.7.4. Recent Developments
- 11.2.7.5. Financials (Based on Availability)
- 11.2.8 Meissen
- 11.2.8.1. Overview
- 11.2.8.2. Products
- 11.2.8.3. SWOT Analysis
- 11.2.8.4. Recent Developments
- 11.2.8.5. Financials (Based on Availability)
- 11.2.9 KAHLA/Thüringen Porzellan GmbH
- 11.2.9.1. Overview
- 11.2.9.2. Products
- 11.2.9.3. SWOT Analysis
- 11.2.9.4. Recent Developments
- 11.2.9.5. Financials (Based on Availability)
- 11.2.10 Seltmann Weiden
- 11.2.10.1. Overview
- 11.2.10.2. Products
- 11.2.10.3. SWOT Analysis
- 11.2.10.4. Recent Developments
- 11.2.10.5. Financials (Based on Availability)
- 11.2.11 Schönwald
- 11.2.11.1. Overview
- 11.2.11.2. Products
- 11.2.11.3. SWOT Analysis
- 11.2.11.4. Recent Developments
- 11.2.11.5. Financials (Based on Availability)
- 11.2.12 WMF
- 11.2.12.1. Overview
- 11.2.12.2. Products
- 11.2.12.3. SWOT Analysis
- 11.2.12.4. Recent Developments
- 11.2.12.5. Financials (Based on Availability)
- 11.2.13 Fiskars Group
- 11.2.13.1. Overview
- 11.2.13.2. Products
- 11.2.13.3. SWOT Analysis
- 11.2.13.4. Recent Developments
- 11.2.13.5. Financials (Based on Availability)
- 11.2.14 Lenox
- 11.2.14.1. Overview
- 11.2.14.2. Products
- 11.2.14.3. SWOT Analysis
- 11.2.14.4. Recent Developments
- 11.2.14.5. Financials (Based on Availability)
- 11.2.15 Portmeirion Group PLC
- 11.2.15.1. Overview
- 11.2.15.2. Products
- 11.2.15.3. SWOT Analysis
- 11.2.15.4. Recent Developments
- 11.2.15.5. Financials (Based on Availability)
- 11.2.16 The Oneida Group
- 11.2.16.1. Overview
- 11.2.16.2. Products
- 11.2.16.3. SWOT Analysis
- 11.2.16.4. Recent Developments
- 11.2.16.5. Financials (Based on Availability)
- 11.2.17 Homer Laughlin China
- 11.2.17.1. Overview
- 11.2.17.2. Products
- 11.2.17.3. SWOT Analysis
- 11.2.17.4. Recent Developments
- 11.2.17.5. Financials (Based on Availability)
- 11.2.18 Noritake
- 11.2.18.1. Overview
- 11.2.18.2. Products
- 11.2.18.3. SWOT Analysis
- 11.2.18.4. Recent Developments
- 11.2.18.5. Financials (Based on Availability)
- 11.2.19 Narumi
- 11.2.19.1. Overview
- 11.2.19.2. Products
- 11.2.19.3. SWOT Analysis
- 11.2.19.4. Recent Developments
- 11.2.19.5. Financials (Based on Availability)
- 11.2.20 Churchill China
- 11.2.20.1. Overview
- 11.2.20.2. Products
- 11.2.20.3. SWOT Analysis
- 11.2.20.4. Recent Developments
- 11.2.20.5. Financials (Based on Availability)
- 11.2.21 Tata Ceramics
- 11.2.21.1. Overview
- 11.2.21.2. Products
- 11.2.21.3. SWOT Analysis
- 11.2.21.4. Recent Developments
- 11.2.21.5. Financials (Based on Availability)
- 11.2.22 Songfa Ceramics
- 11.2.22.1. Overview
- 11.2.22.2. Products
- 11.2.22.3. SWOT Analysis
- 11.2.22.4. Recent Developments
- 11.2.22.5. Financials (Based on Availability)
- 11.2.23 Hualian China
- 11.2.23.1. Overview
- 11.2.23.2. Products
- 11.2.23.3. SWOT Analysis
- 11.2.23.4. Recent Developments
- 11.2.23.5. Financials (Based on Availability)
- 11.2.24 Sitong Group
- 11.2.24.1. Overview
- 11.2.24.2. Products
- 11.2.24.3. SWOT Analysis
- 11.2.24.4. Recent Developments
- 11.2.24.5. Financials (Based on Availability)
- 11.2.25 The Great Wall
- 11.2.25.1. Overview
- 11.2.25.2. Products
- 11.2.25.3. SWOT Analysis
- 11.2.25.4. Recent Developments
- 11.2.25.5. Financials (Based on Availability)
- 11.2.1 Libbey
List of Figures
- Figure 1: Global Dinnerwares Revenue Breakdown (million, %) by Region 2024 & 2032
- Figure 2: Global Dinnerwares Volume Breakdown (K, %) by Region 2024 & 2032
- Figure 3: North America Dinnerwares Revenue (million), by Application 2024 & 2032
- Figure 4: North America Dinnerwares Volume (K), by Application 2024 & 2032
- Figure 5: North America Dinnerwares Revenue Share (%), by Application 2024 & 2032
- Figure 6: North America Dinnerwares Volume Share (%), by Application 2024 & 2032
- Figure 7: North America Dinnerwares Revenue (million), by Types 2024 & 2032
- Figure 8: North America Dinnerwares Volume (K), by Types 2024 & 2032
- Figure 9: North America Dinnerwares Revenue Share (%), by Types 2024 & 2032
- Figure 10: North America Dinnerwares Volume Share (%), by Types 2024 & 2032
- Figure 11: North America Dinnerwares Revenue (million), by Country 2024 & 2032
- Figure 12: North America Dinnerwares Volume (K), by Country 2024 & 2032
- Figure 13: North America Dinnerwares Revenue Share (%), by Country 2024 & 2032
- Figure 14: North America Dinnerwares Volume Share (%), by Country 2024 & 2032
- Figure 15: South America Dinnerwares Revenue (million), by Application 2024 & 2032
- Figure 16: South America Dinnerwares Volume (K), by Application 2024 & 2032
- Figure 17: South America Dinnerwares Revenue Share (%), by Application 2024 & 2032
- Figure 18: South America Dinnerwares Volume Share (%), by Application 2024 & 2032
- Figure 19: South America Dinnerwares Revenue (million), by Types 2024 & 2032
- Figure 20: South America Dinnerwares Volume (K), by Types 2024 & 2032
- Figure 21: South America Dinnerwares Revenue Share (%), by Types 2024 & 2032
- Figure 22: South America Dinnerwares Volume Share (%), by Types 2024 & 2032
- Figure 23: South America Dinnerwares Revenue (million), by Country 2024 & 2032
- Figure 24: South America Dinnerwares Volume (K), by Country 2024 & 2032
- Figure 25: South America Dinnerwares Revenue Share (%), by Country 2024 & 2032
- Figure 26: South America Dinnerwares Volume Share (%), by Country 2024 & 2032
- Figure 27: Europe Dinnerwares Revenue (million), by Application 2024 & 2032
- Figure 28: Europe Dinnerwares Volume (K), by Application 2024 & 2032
- Figure 29: Europe Dinnerwares Revenue Share (%), by Application 2024 & 2032
- Figure 30: Europe Dinnerwares Volume Share (%), by Application 2024 & 2032
- Figure 31: Europe Dinnerwares Revenue (million), by Types 2024 & 2032
- Figure 32: Europe Dinnerwares Volume (K), by Types 2024 & 2032
- Figure 33: Europe Dinnerwares Revenue Share (%), by Types 2024 & 2032
- Figure 34: Europe Dinnerwares Volume Share (%), by Types 2024 & 2032
- Figure 35: Europe Dinnerwares Revenue (million), by Country 2024 & 2032
- Figure 36: Europe Dinnerwares Volume (K), by Country 2024 & 2032
- Figure 37: Europe Dinnerwares Revenue Share (%), by Country 2024 & 2032
- Figure 38: Europe Dinnerwares Volume Share (%), by Country 2024 & 2032
- Figure 39: Middle East & Africa Dinnerwares Revenue (million), by Application 2024 & 2032
- Figure 40: Middle East & Africa Dinnerwares Volume (K), by Application 2024 & 2032
- Figure 41: Middle East & Africa Dinnerwares Revenue Share (%), by Application 2024 & 2032
- Figure 42: Middle East & Africa Dinnerwares Volume Share (%), by Application 2024 & 2032
- Figure 43: Middle East & Africa Dinnerwares Revenue (million), by Types 2024 & 2032
- Figure 44: Middle East & Africa Dinnerwares Volume (K), by Types 2024 & 2032
- Figure 45: Middle East & Africa Dinnerwares Revenue Share (%), by Types 2024 & 2032
- Figure 46: Middle East & Africa Dinnerwares Volume Share (%), by Types 2024 & 2032
- Figure 47: Middle East & Africa Dinnerwares Revenue (million), by Country 2024 & 2032
- Figure 48: Middle East & Africa Dinnerwares Volume (K), by Country 2024 & 2032
- Figure 49: Middle East & Africa Dinnerwares Revenue Share (%), by Country 2024 & 2032
- Figure 50: Middle East & Africa Dinnerwares Volume Share (%), by Country 2024 & 2032
- Figure 51: Asia Pacific Dinnerwares Revenue (million), by Application 2024 & 2032
- Figure 52: Asia Pacific Dinnerwares Volume (K), by Application 2024 & 2032
- Figure 53: Asia Pacific Dinnerwares Revenue Share (%), by Application 2024 & 2032
- Figure 54: Asia Pacific Dinnerwares Volume Share (%), by Application 2024 & 2032
- Figure 55: Asia Pacific Dinnerwares Revenue (million), by Types 2024 & 2032
- Figure 56: Asia Pacific Dinnerwares Volume (K), by Types 2024 & 2032
- Figure 57: Asia Pacific Dinnerwares Revenue Share (%), by Types 2024 & 2032
- Figure 58: Asia Pacific Dinnerwares Volume Share (%), by Types 2024 & 2032
- Figure 59: Asia Pacific Dinnerwares Revenue (million), by Country 2024 & 2032
- Figure 60: Asia Pacific Dinnerwares Volume (K), by Country 2024 & 2032
- Figure 61: Asia Pacific Dinnerwares Revenue Share (%), by Country 2024 & 2032
- Figure 62: Asia Pacific Dinnerwares Volume Share (%), by Country 2024 & 2032
List of Tables
- Table 1: Global Dinnerwares Revenue million Forecast, by Region 2019 & 2032
- Table 2: Global Dinnerwares Volume K Forecast, by Region 2019 & 2032
- Table 3: Global Dinnerwares Revenue million Forecast, by Application 2019 & 2032
- Table 4: Global Dinnerwares Volume K Forecast, by Application 2019 & 2032
- Table 5: Global Dinnerwares Revenue million Forecast, by Types 2019 & 2032
- Table 6: Global Dinnerwares Volume K Forecast, by Types 2019 & 2032
- Table 7: Global Dinnerwares Revenue million Forecast, by Region 2019 & 2032
- Table 8: Global Dinnerwares Volume K Forecast, by Region 2019 & 2032
- Table 9: Global Dinnerwares Revenue million Forecast, by Application 2019 & 2032
- Table 10: Global Dinnerwares Volume K Forecast, by Application 2019 & 2032
- Table 11: Global Dinnerwares Revenue million Forecast, by Types 2019 & 2032
- Table 12: Global Dinnerwares Volume K Forecast, by Types 2019 & 2032
- Table 13: Global Dinnerwares Revenue million Forecast, by Country 2019 & 2032
- Table 14: Global Dinnerwares Volume K Forecast, by Country 2019 & 2032
- Table 15: United States Dinnerwares Revenue (million) Forecast, by Application 2019 & 2032
- Table 16: United States Dinnerwares Volume (K) Forecast, by Application 2019 & 2032
- Table 17: Canada Dinnerwares Revenue (million) Forecast, by Application 2019 & 2032
- Table 18: Canada Dinnerwares Volume (K) Forecast, by Application 2019 & 2032
- Table 19: Mexico Dinnerwares Revenue (million) Forecast, by Application 2019 & 2032
- Table 20: Mexico Dinnerwares Volume (K) Forecast, by Application 2019 & 2032
- Table 21: Global Dinnerwares Revenue million Forecast, by Application 2019 & 2032
- Table 22: Global Dinnerwares Volume K Forecast, by Application 2019 & 2032
- Table 23: Global Dinnerwares Revenue million Forecast, by Types 2019 & 2032
- Table 24: Global Dinnerwares Volume K Forecast, by Types 2019 & 2032
- Table 25: Global Dinnerwares Revenue million Forecast, by Country 2019 & 2032
- Table 26: Global Dinnerwares Volume K Forecast, by Country 2019 & 2032
- Table 27: Brazil Dinnerwares Revenue (million) Forecast, by Application 2019 & 2032
- Table 28: Brazil Dinnerwares Volume (K) Forecast, by Application 2019 & 2032
- Table 29: Argentina Dinnerwares Revenue (million) Forecast, by Application 2019 & 2032
- Table 30: Argentina Dinnerwares Volume (K) Forecast, by Application 2019 & 2032
- Table 31: Rest of South America Dinnerwares Revenue (million) Forecast, by Application 2019 & 2032
- Table 32: Rest of South America Dinnerwares Volume (K) Forecast, by Application 2019 & 2032
- Table 33: Global Dinnerwares Revenue million Forecast, by Application 2019 & 2032
- Table 34: Global Dinnerwares Volume K Forecast, by Application 2019 & 2032
- Table 35: Global Dinnerwares Revenue million Forecast, by Types 2019 & 2032
- Table 36: Global Dinnerwares Volume K Forecast, by Types 2019 & 2032
- Table 37: Global Dinnerwares Revenue million Forecast, by Country 2019 & 2032
- Table 38: Global Dinnerwares Volume K Forecast, by Country 2019 & 2032
- Table 39: United Kingdom Dinnerwares Revenue (million) Forecast, by Application 2019 & 2032
- Table 40: United Kingdom Dinnerwares Volume (K) Forecast, by Application 2019 & 2032
- Table 41: Germany Dinnerwares Revenue (million) Forecast, by Application 2019 & 2032
- Table 42: Germany Dinnerwares Volume (K) Forecast, by Application 2019 & 2032
- Table 43: France Dinnerwares Revenue (million) Forecast, by Application 2019 & 2032
- Table 44: France Dinnerwares Volume (K) Forecast, by Application 2019 & 2032
- Table 45: Italy Dinnerwares Revenue (million) Forecast, by Application 2019 & 2032
- Table 46: Italy Dinnerwares Volume (K) Forecast, by Application 2019 & 2032
- Table 47: Spain Dinnerwares Revenue (million) Forecast, by Application 2019 & 2032
- Table 48: Spain Dinnerwares Volume (K) Forecast, by Application 2019 & 2032
- Table 49: Russia Dinnerwares Revenue (million) Forecast, by Application 2019 & 2032
- Table 50: Russia Dinnerwares Volume (K) Forecast, by Application 2019 & 2032
- Table 51: Benelux Dinnerwares Revenue (million) Forecast, by Application 2019 & 2032
- Table 52: Benelux Dinnerwares Volume (K) Forecast, by Application 2019 & 2032
- Table 53: Nordics Dinnerwares Revenue (million) Forecast, by Application 2019 & 2032
- Table 54: Nordics Dinnerwares Volume (K) Forecast, by Application 2019 & 2032
- Table 55: Rest of Europe Dinnerwares Revenue (million) Forecast, by Application 2019 & 2032
- Table 56: Rest of Europe Dinnerwares Volume (K) Forecast, by Application 2019 & 2032
- Table 57: Global Dinnerwares Revenue million Forecast, by Application 2019 & 2032
- Table 58: Global Dinnerwares Volume K Forecast, by Application 2019 & 2032
- Table 59: Global Dinnerwares Revenue million Forecast, by Types 2019 & 2032
- Table 60: Global Dinnerwares Volume K Forecast, by Types 2019 & 2032
- Table 61: Global Dinnerwares Revenue million Forecast, by Country 2019 & 2032
- Table 62: Global Dinnerwares Volume K Forecast, by Country 2019 & 2032
- Table 63: Turkey Dinnerwares Revenue (million) Forecast, by Application 2019 & 2032
- Table 64: Turkey Dinnerwares Volume (K) Forecast, by Application 2019 & 2032
- Table 65: Israel Dinnerwares Revenue (million) Forecast, by Application 2019 & 2032
- Table 66: Israel Dinnerwares Volume (K) Forecast, by Application 2019 & 2032
- Table 67: GCC Dinnerwares Revenue (million) Forecast, by Application 2019 & 2032
- Table 68: GCC Dinnerwares Volume (K) Forecast, by Application 2019 & 2032
- Table 69: North Africa Dinnerwares Revenue (million) Forecast, by Application 2019 & 2032
- Table 70: North Africa Dinnerwares Volume (K) Forecast, by Application 2019 & 2032
- Table 71: South Africa Dinnerwares Revenue (million) Forecast, by Application 2019 & 2032
- Table 72: South Africa Dinnerwares Volume (K) Forecast, by Application 2019 & 2032
- Table 73: Rest of Middle East & Africa Dinnerwares Revenue (million) Forecast, by Application 2019 & 2032
- Table 74: Rest of Middle East & Africa Dinnerwares Volume (K) Forecast, by Application 2019 & 2032
- Table 75: Global Dinnerwares Revenue million Forecast, by Application 2019 & 2032
- Table 76: Global Dinnerwares Volume K Forecast, by Application 2019 & 2032
- Table 77: Global Dinnerwares Revenue million Forecast, by Types 2019 & 2032
- Table 78: Global Dinnerwares Volume K Forecast, by Types 2019 & 2032
- Table 79: Global Dinnerwares Revenue million Forecast, by Country 2019 & 2032
- Table 80: Global Dinnerwares Volume K Forecast, by Country 2019 & 2032
- Table 81: China Dinnerwares Revenue (million) Forecast, by Application 2019 & 2032
- Table 82: China Dinnerwares Volume (K) Forecast, by Application 2019 & 2032
- Table 83: India Dinnerwares Revenue (million) Forecast, by Application 2019 & 2032
- Table 84: India Dinnerwares Volume (K) Forecast, by Application 2019 & 2032
- Table 85: Japan Dinnerwares Revenue (million) Forecast, by Application 2019 & 2032
- Table 86: Japan Dinnerwares Volume (K) Forecast, by Application 2019 & 2032
- Table 87: South Korea Dinnerwares Revenue (million) Forecast, by Application 2019 & 2032
- Table 88: South Korea Dinnerwares Volume (K) Forecast, by Application 2019 & 2032
- Table 89: ASEAN Dinnerwares Revenue (million) Forecast, by Application 2019 & 2032
- Table 90: ASEAN Dinnerwares Volume (K) Forecast, by Application 2019 & 2032
- Table 91: Oceania Dinnerwares Revenue (million) Forecast, by Application 2019 & 2032
- Table 92: Oceania Dinnerwares Volume (K) Forecast, by Application 2019 & 2032
- Table 93: Rest of Asia Pacific Dinnerwares Revenue (million) Forecast, by Application 2019 & 2032
- Table 94: Rest of Asia Pacific Dinnerwares Volume (K) Forecast, by Application 2019 & 2032
Frequently Asked Questions
1. What is the projected Compound Annual Growth Rate (CAGR) of the Dinnerwares?
The projected CAGR is approximately XX%.
2. Which companies are prominent players in the Dinnerwares?
Key companies in the market include Libbey, EveryWare Global, Arc International, Sisecam, Bormioli, Villeroy and Boch, Rosenthal GmbH, Meissen, KAHLA/Thüringen Porzellan GmbH, Seltmann Weiden, Schönwald, WMF, Fiskars Group, Lenox, Portmeirion Group PLC, The Oneida Group, Homer Laughlin China, Noritake, Narumi, Churchill China, Tata Ceramics, Songfa Ceramics, Hualian China, Sitong Group, The Great Wall.
3. What are the main segments of the Dinnerwares?
The market segments include Application, Types.
4. Can you provide details about the market size?
The market size is estimated to be USD XXX million as of 2022.
5. What are some drivers contributing to market growth?
N/A
6. What are the notable trends driving market growth?
N/A
7. Are there any restraints impacting market growth?
N/A
8. Can you provide examples of recent developments in the market?
N/A
9. What pricing options are available for accessing the report?
Pricing options include single-user, multi-user, and enterprise licenses priced at USD 3350.00, USD 5025.00, and USD 6700.00 respectively.
10. Is the market size provided in terms of value or volume?
The market size is provided in terms of value, measured in million and volume, measured in K.
11. Are there any specific market keywords associated with the report?
Yes, the market keyword associated with the report is "Dinnerwares," which aids in identifying and referencing the specific market segment covered.
12. How do I determine which pricing option suits my needs best?
The pricing options vary based on user requirements and access needs. Individual users may opt for single-user licenses, while businesses requiring broader access may choose multi-user or enterprise licenses for cost-effective access to the report.
13. Are there any additional resources or data provided in the Dinnerwares report?
While the report offers comprehensive insights, it's advisable to review the specific contents or supplementary materials provided to ascertain if additional resources or data are available.
14. How can I stay updated on further developments or reports in the Dinnerwares?
To stay informed about further developments, trends, and reports in the Dinnerwares, consider subscribing to industry newsletters, following relevant companies and organizations, or regularly checking reputable industry news sources and publications.
Methodology
Step 1 - Identification of Relevant Samples Size from Population Database


Step 2 - Approaches for Defining Global Market Size (Value, Volume* & Price*)

Note*: In applicable scenarios
Step 3 - Data Sources
Primary Research
- Web Analytics
- Survey Reports
- Research Institute
- Latest Research Reports
- Opinion Leaders
Secondary Research
- Annual Reports
- White Paper
- Latest Press Release
- Industry Association
- Paid Database
- Investor Presentations

Step 4 - Data Triangulation
Involves using different sources of information in order to increase the validity of a study
These sources are likely to be stakeholders in a program - participants, other researchers, program staff, other community members, and so on.
Then we put all data in single framework & apply various statistical tools to find out the dynamic on the market.
During the analysis stage, feedback from the stakeholder groups would be compared to determine areas of agreement as well as areas of divergence
