

Key Insights
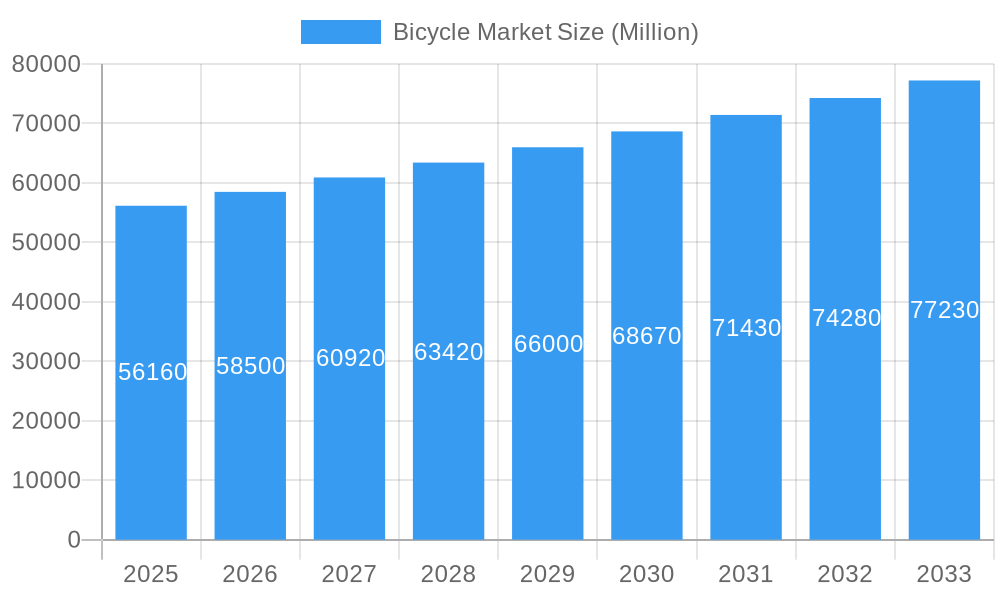
The global bicycle market, valued at $56.16 billion in 2025, is projected to experience robust growth, driven by a compound annual growth rate (CAGR) of 4.20% from 2025 to 2033. Several factors contribute to this positive outlook. Increasing health consciousness and a global shift towards eco-friendly transportation are significantly boosting demand for bicycles across various segments. The rise in popularity of e-bikes, offering a blend of fitness and convenience, is a key driver, particularly in urban areas facing traffic congestion and pollution. Further fueling market expansion are government initiatives promoting cycling infrastructure and cycling-friendly urban planning in many regions. Growth is also being witnessed in specialized bicycle types like all-terrain bikes, catering to outdoor enthusiasts and adventure seekers. The market is witnessing a shift towards online retail channels, offering increased convenience and a wider selection to consumers. However, the market faces certain restraints, including the impact of economic fluctuations on discretionary spending and the potential for supply chain disruptions affecting manufacturing and distribution.
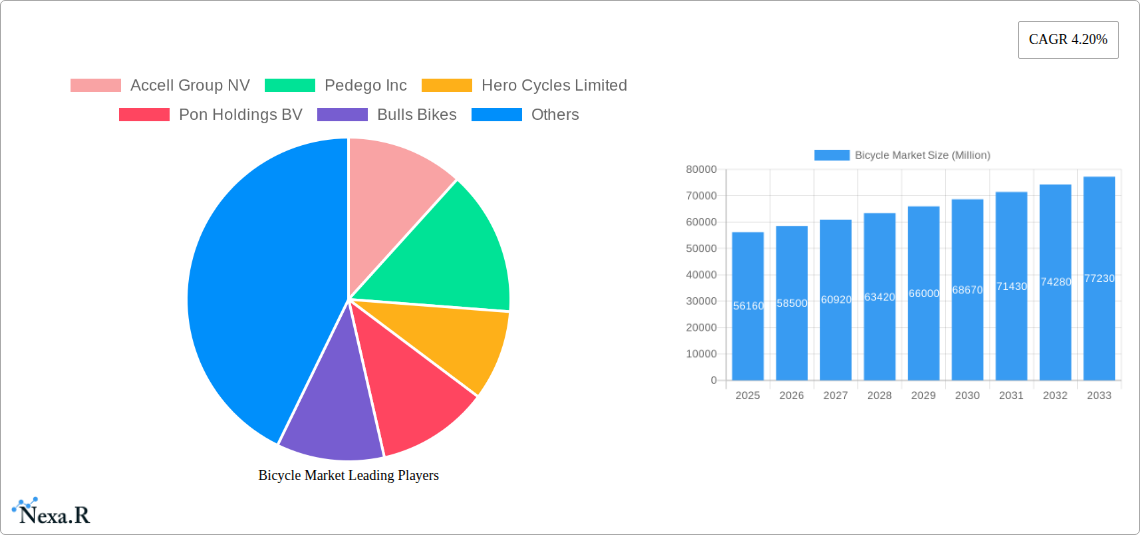
Bicycle Market Market Size (In Billion)
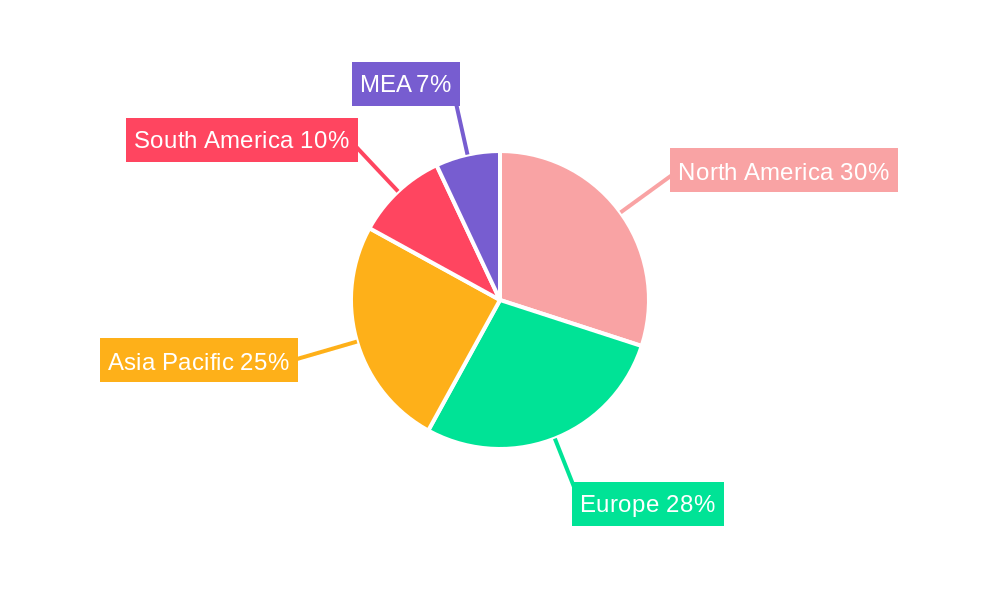
Competition within the bicycle market is intense, with major players like Accell Group NV, Giant Manufacturing Co Ltd, and Trek Bicycle Corporation vying for market share. These established players are constantly innovating, introducing new technologies and designs to enhance performance and appeal to a diverse consumer base. The market is segmented by bicycle type (road, hybrid, all-terrain, e-bike, others) and distribution channel (offline and online). North America and Europe currently hold significant market shares, but the Asia-Pacific region is expected to witness substantial growth due to increasing urbanization, rising disposable incomes, and the burgeoning middle class in countries like China and India. This growth will be further propelled by the expanding e-bike market within this region. The continuing development of advanced features like improved battery technology and integrated smart features will further enhance the appeal and performance of e-bikes, driving future market growth.
Bicycle Market Company Market Share
Bicycle Market: A Comprehensive Report (2019-2033)
This in-depth report provides a comprehensive analysis of the global bicycle market, encompassing market dynamics, growth trends, regional performance, and key player strategies. The study period covers 2019-2033, with 2025 serving as the base and estimated year. The report offers invaluable insights for industry professionals, investors, and stakeholders seeking a clear understanding of this dynamic market. The report segments the market by Type (Road Bicycle, Hybrid Bicycle, All Terrain Bicycle, E-bicycle, Other Types) and Distribution Channel (Offline Retail Stores, Online Retail Stores). The market size is presented in million units.
Bicycle Market Dynamics & Structure
The global bicycle market is characterized by a moderately concentrated landscape, with several major players holding significant market share. However, the market also features a substantial number of smaller, niche players, particularly in the e-bicycle and specialized bicycle segments. Technological innovation, particularly in e-bike technology and materials science, is a key driver of market growth. Regulatory frameworks, including government incentives for cycling infrastructure and e-bike adoption, significantly influence market dynamics. Competitive substitutes include other forms of personal transportation, such as scooters and motorcycles, but cycling's environmental benefits and health advantages continue to fuel its popularity. The end-user demographic is broadening, encompassing commuters, recreational cyclists, and fitness enthusiasts across various age groups and income levels. M&A activity has been moderate, with several instances of larger companies acquiring smaller, specialized brands to expand their product portfolios.
- Market Concentration: Moderately concentrated, with top 5 players holding xx% market share (2025).
- Technological Innovation: Significant advancements in e-bike technology, lightweight materials, and smart bicycle features.
- Regulatory Framework: Government initiatives promoting cycling infrastructure and e-bike adoption vary across regions.
- Competitive Substitutes: Scooters, motorcycles, and public transportation.
- End-User Demographics: Expanding to encompass a broader range of age groups and income levels.
- M&A Trends: Moderate activity, primarily involving acquisitions of specialized brands. Approx. xx M&A deals in the past 5 years.
Bicycle Market Growth Trends & Insights
The global bicycle market experienced substantial growth during the historical period (2019-2024), driven by increased health consciousness, growing urbanization, and rising environmental concerns. The market is projected to continue its expansion throughout the forecast period (2025-2033), with a Compound Annual Growth Rate (CAGR) of xx% from 2025 to 2033. This growth is fueled by increasing adoption rates of e-bicycles, particularly in urban areas, and a rising preference for sustainable transportation options. Technological disruptions, such as the development of advanced e-bike systems and smart bicycle technology, are further contributing to market expansion. Consumer behavior shifts indicate a growing demand for higher-quality, more specialized bicycles, along with a preference for online purchasing channels.
Dominant Regions, Countries, or Segments in Bicycle Market
The [Region, e.g., European Union] is currently the dominant region in the global bicycle market, driven by strong consumer demand, well-developed cycling infrastructure, and supportive government policies. Within this region, [Country, e.g., Germany] and [Country, e.g., Netherlands] stand out as leading countries. In terms of segments, the e-bicycle segment is experiencing the most rapid growth, followed by the hybrid bicycle segment.
Key Drivers in [Region, e.g., European Union]:
- Extensive cycling infrastructure
- Favorable government policies and subsidies
- High consumer awareness of health and environmental benefits
Dominance Factors: High market share, strong consumer base, and favorable regulatory environment.
Growth Potential: Significant potential for further expansion driven by increasing urbanization and technological advancements.
Key Drivers in E-bicycle Segment:
- Increasing demand for sustainable transportation options
- Technological advancements resulting in improved performance and affordability
- Government incentives promoting e-bike adoption.
Dominance Factors: Rapid growth rate, high consumer interest, and technological innovation.
Growth Potential: Significant potential for further expansion due to continued technological advancements and government support.
Bicycle Market Product Landscape
The bicycle market offers a diverse range of products catering to various needs and preferences. Innovations focus on lightweight materials, improved gear systems, enhanced e-bike technology (longer battery life, powerful motors), and integrated smart features like GPS tracking and connectivity. These advancements enhance performance, comfort, and user experience, creating unique selling propositions for manufacturers. Key performance metrics include speed, range (for e-bikes), weight, durability, and comfort.
Key Drivers, Barriers & Challenges in Bicycle Market
Key Drivers:
- Growing environmental awareness
- Increased health consciousness
- Urbanization and need for efficient transportation
- Technological advancements in e-bike technology
Challenges:
- Supply chain disruptions due to global events (e.g., xx% increase in component costs)
- Competition from other modes of transportation
- Regulatory hurdles in some regions relating to e-bike safety and standards.
Emerging Opportunities in Bicycle Market
- Untapped Markets: Expanding into developing economies with growing middle classes.
- Innovative Applications: Integration of smart technologies, cargo bikes, and specialized bicycles for diverse activities.
- Evolving Consumer Preferences: Focus on sustainability, customization, and personalized riding experiences.
Growth Accelerators in the Bicycle Market Industry
Long-term growth is fueled by continued technological advancements, particularly in battery technology for e-bikes, and strategic partnerships between bicycle manufacturers and technology companies. Market expansion into developing countries with increasing infrastructure investment and a growing middle class is another critical growth accelerator.
Key Players Shaping the Bicycle Market Market
- Accell Group NV
- Pedego Inc
- Hero Cycles Limited
- Pon Holdings BV
- Bulls Bikes
- Giant Manufacturing Co Ltd
- Riese Und Muller Gmbh
- Benno Bikes LLC
- Ribble Cycles
- Trek Bicycle Corporation
Notable Milestones in Bicycle Market Sector
- 2021: Introduction of several new e-bike models with extended range capabilities.
- 2022: Several key mergers and acquisitions within the e-bike segment.
- 2023: Significant investment in new manufacturing facilities in developing countries.
In-Depth Bicycle Market Market Outlook
The bicycle market is poised for continued growth over the next decade, driven by sustainable transportation trends, technological innovation, and increased government support. Strategic opportunities exist in expanding e-bike penetration, developing smart bicycle technologies, and penetrating emerging markets. The market presents attractive prospects for companies that can adapt to evolving consumer preferences and capitalize on technological advancements.
Bicycle Market Segmentation
-
1. Type
- 1.1. Road Bicycle
- 1.2. Hybrid Bicycle
- 1.3. All Terrain Bicycle
- 1.4. E-bicycle
- 1.5. Other Types
-
2. Distribution Channel
- 2.1. Offline Retail Stores
- 2.2. Online Retail Stores
Bicycle Market Segmentation By Geography
-
1. North America
- 1.1. United States
- 1.2. Canada
- 1.3. Mexico
- 1.4. Rest of North America
-
2. Europe
- 2.1. United Kingdom
- 2.2. Germany
- 2.3. Spain
- 2.4. France
- 2.5. Italy
- 2.6. Russia
- 2.7. Netherlands
- 2.8. Rest of Europe
-
3. Asia Pacific
- 3.1. China
- 3.2. Japan
- 3.3. India
- 3.4. Australia
- 3.5. Rest of Asia Pacific
-
4. South America
- 4.1. Brazil
- 4.2. Argentina
- 4.3. Chile
- 4.4. Rest of South America
-
5. Middle East and Africa
- 5.1. United Arab Emirates
- 5.2. South Africa
- 5.3. Rest of Middle East and Africa
Bicycle Market Regional Market Share
Geographic Coverage of Bicycle Market
Bicycle Market REPORT HIGHLIGHTS
| Aspects | Details |
|---|---|
| Study Period | 2020-2034 |
| Base Year | 2025 |
| Estimated Year | 2026 |
| Forecast Period | 2026-2034 |
| Historical Period | 2020-2025 |
| Growth Rate | CAGR of 4.20% from 2020-2034 |
| Segmentation |
|
Table of Contents
- 1. Introduction
- 1.1. Research Scope
- 1.2. Market Segmentation
- 1.3. Research Objective
- 1.4. Definitions and Assumptions
- 2. Executive Summary
- 2.1. Market Snapshot
- 3. Market Dynamics
- 3.1. Market Drivers
- 3.2. Market Restrains
- 3.3. Market Trends
- 3.4. Market Opportunities
- 4. Market Factor Analysis
- 4.1. Porters Five Forces
- 4.1.1. Bargaining Power of Suppliers
- 4.1.2. Bargaining Power of Buyers
- 4.1.3. Threat of New Entrants
- 4.1.4. Threat of Substitutes
- 4.1.5. Competitive Rivalry
- 4.2. PESTEL analysis
- 4.3. BCG Analysis
- 4.3.1. Stars (High Growth, High Market Share)
- 4.3.2. Cash Cows (Low Growth, High Market Share)
- 4.3.3. Question Mark (High Growth, Low Market Share)
- 4.3.4. Dogs (Low Growth, Low Market Share)
- 4.4. Ansoff Matrix Analysis
- 4.5. Supply Chain Analysis
- 4.6. Regulatory Landscape
- 4.7. Current Market Potential and Opportunity Assessment (TAM–SAM–SOM Framework)
- 4.8. NRP Analyst Note
- 4.1. Porters Five Forces
- 5. Market Analysis, Insights and Forecast 2021-2033
- 5.1. Market Analysis, Insights and Forecast - by Type
- 5.1.1. Road Bicycle
- 5.1.2. Hybrid Bicycle
- 5.1.3. All Terrain Bicycle
- 5.1.4. E-bicycle
- 5.1.5. Other Types
- 5.2. Market Analysis, Insights and Forecast - by Distribution Channel
- 5.2.1. Offline Retail Stores
- 5.2.2. Online Retail Stores
- 5.3. Market Analysis, Insights and Forecast - by Region
- 5.3.1. North America
- 5.3.2. Europe
- 5.3.3. Asia Pacific
- 5.3.4. South America
- 5.3.5. Middle East and Africa
- 5.1. Market Analysis, Insights and Forecast - by Type
- 6. Global Bicycle Market Analysis, Insights and Forecast, 2021-2033
- 6.1. Market Analysis, Insights and Forecast - by Type
- 6.1.1. Road Bicycle
- 6.1.2. Hybrid Bicycle
- 6.1.3. All Terrain Bicycle
- 6.1.4. E-bicycle
- 6.1.5. Other Types
- 6.2. Market Analysis, Insights and Forecast - by Distribution Channel
- 6.2.1. Offline Retail Stores
- 6.2.2. Online Retail Stores
- 6.1. Market Analysis, Insights and Forecast - by Type
- 7. North America Bicycle Market Analysis, Insights and Forecast, 2020-2032
- 7.1. Market Analysis, Insights and Forecast - by Type
- 7.1.1. Road Bicycle
- 7.1.2. Hybrid Bicycle
- 7.1.3. All Terrain Bicycle
- 7.1.4. E-bicycle
- 7.1.5. Other Types
- 7.2. Market Analysis, Insights and Forecast - by Distribution Channel
- 7.2.1. Offline Retail Stores
- 7.2.2. Online Retail Stores
- 7.1. Market Analysis, Insights and Forecast - by Type
- 8. Europe Bicycle Market Analysis, Insights and Forecast, 2020-2032
- 8.1. Market Analysis, Insights and Forecast - by Type
- 8.1.1. Road Bicycle
- 8.1.2. Hybrid Bicycle
- 8.1.3. All Terrain Bicycle
- 8.1.4. E-bicycle
- 8.1.5. Other Types
- 8.2. Market Analysis, Insights and Forecast - by Distribution Channel
- 8.2.1. Offline Retail Stores
- 8.2.2. Online Retail Stores
- 8.1. Market Analysis, Insights and Forecast - by Type
- 9. Asia Pacific Bicycle Market Analysis, Insights and Forecast, 2020-2032
- 9.1. Market Analysis, Insights and Forecast - by Type
- 9.1.1. Road Bicycle
- 9.1.2. Hybrid Bicycle
- 9.1.3. All Terrain Bicycle
- 9.1.4. E-bicycle
- 9.1.5. Other Types
- 9.2. Market Analysis, Insights and Forecast - by Distribution Channel
- 9.2.1. Offline Retail Stores
- 9.2.2. Online Retail Stores
- 9.1. Market Analysis, Insights and Forecast - by Type
- 10. South America Bicycle Market Analysis, Insights and Forecast, 2020-2032
- 10.1. Market Analysis, Insights and Forecast - by Type
- 10.1.1. Road Bicycle
- 10.1.2. Hybrid Bicycle
- 10.1.3. All Terrain Bicycle
- 10.1.4. E-bicycle
- 10.1.5. Other Types
- 10.2. Market Analysis, Insights and Forecast - by Distribution Channel
- 10.2.1. Offline Retail Stores
- 10.2.2. Online Retail Stores
- 10.1. Market Analysis, Insights and Forecast - by Type
- 11. Middle East and Africa Bicycle Market Analysis, Insights and Forecast, 2020-2032
- 11.1. Market Analysis, Insights and Forecast - by Type
- 11.1.1. Road Bicycle
- 11.1.2. Hybrid Bicycle
- 11.1.3. All Terrain Bicycle
- 11.1.4. E-bicycle
- 11.1.5. Other Types
- 11.2. Market Analysis, Insights and Forecast - by Distribution Channel
- 11.2.1. Offline Retail Stores
- 11.2.2. Online Retail Stores
- 11.1. Market Analysis, Insights and Forecast - by Type
- 12. Competitive Analysis
- 12.1. Company Profiles
- 12.1.1 Accell Group NV
- 12.1.1.1. Company Overview
- 12.1.1.2. Products
- 12.1.1.3. Company Financials
- 12.1.1.4. SWOT Analysis
- 12.1.2 Pedego Inc
- 12.1.2.1. Company Overview
- 12.1.2.2. Products
- 12.1.2.3. Company Financials
- 12.1.2.4. SWOT Analysis
- 12.1.3 Hero Cycles Limited
- 12.1.3.1. Company Overview
- 12.1.3.2. Products
- 12.1.3.3. Company Financials
- 12.1.3.4. SWOT Analysis
- 12.1.4 Pon Holdings BV
- 12.1.4.1. Company Overview
- 12.1.4.2. Products
- 12.1.4.3. Company Financials
- 12.1.4.4. SWOT Analysis
- 12.1.5 Bulls Bikes
- 12.1.5.1. Company Overview
- 12.1.5.2. Products
- 12.1.5.3. Company Financials
- 12.1.5.4. SWOT Analysis
- 12.1.6 Giant Manufacturing Co Ltd
- 12.1.6.1. Company Overview
- 12.1.6.2. Products
- 12.1.6.3. Company Financials
- 12.1.6.4. SWOT Analysis
- 12.1.7 Riese Und Muller Gmbh*List Not Exhaustive
- 12.1.7.1. Company Overview
- 12.1.7.2. Products
- 12.1.7.3. Company Financials
- 12.1.7.4. SWOT Analysis
- 12.1.8 Benno Bikes LLC
- 12.1.8.1. Company Overview
- 12.1.8.2. Products
- 12.1.8.3. Company Financials
- 12.1.8.4. SWOT Analysis
- 12.1.9 Ribble Cycles
- 12.1.9.1. Company Overview
- 12.1.9.2. Products
- 12.1.9.3. Company Financials
- 12.1.9.4. SWOT Analysis
- 12.1.10 Trek Bicycle Corporation
- 12.1.10.1. Company Overview
- 12.1.10.2. Products
- 12.1.10.3. Company Financials
- 12.1.10.4. SWOT Analysis
- 12.1.1 Accell Group NV
- 12.2. Market Entropy
- 12.2.1 Company's Key Areas Served
- 12.2.2 Recent Developments
- 12.3. Company Market Share Analysis 2025
- 12.3.1 Top 5 Companies Market Share Analysis
- 12.3.2 Top 3 Companies Market Share Analysis
- 12.4. List of Potential Customers
- 13. Research Methodology
List of Figures
- Figure 1: Global Bicycle Market Revenue Breakdown (Million, %) by Region 2025 & 2033
- Figure 2: Global Bicycle Market Volume Breakdown (K Units, %) by Region 2025 & 2033
- Figure 3: North America Bicycle Market Revenue (Million), by Type 2025 & 2033
- Figure 4: North America Bicycle Market Volume (K Units), by Type 2025 & 2033
- Figure 5: North America Bicycle Market Revenue Share (%), by Type 2025 & 2033
- Figure 6: North America Bicycle Market Volume Share (%), by Type 2025 & 2033
- Figure 7: North America Bicycle Market Revenue (Million), by Distribution Channel 2025 & 2033
- Figure 8: North America Bicycle Market Volume (K Units), by Distribution Channel 2025 & 2033
- Figure 9: North America Bicycle Market Revenue Share (%), by Distribution Channel 2025 & 2033
- Figure 10: North America Bicycle Market Volume Share (%), by Distribution Channel 2025 & 2033
- Figure 11: North America Bicycle Market Revenue (Million), by Country 2025 & 2033
- Figure 12: North America Bicycle Market Volume (K Units), by Country 2025 & 2033
- Figure 13: North America Bicycle Market Revenue Share (%), by Country 2025 & 2033
- Figure 14: North America Bicycle Market Volume Share (%), by Country 2025 & 2033
- Figure 15: Europe Bicycle Market Revenue (Million), by Type 2025 & 2033
- Figure 16: Europe Bicycle Market Volume (K Units), by Type 2025 & 2033
- Figure 17: Europe Bicycle Market Revenue Share (%), by Type 2025 & 2033
- Figure 18: Europe Bicycle Market Volume Share (%), by Type 2025 & 2033
- Figure 19: Europe Bicycle Market Revenue (Million), by Distribution Channel 2025 & 2033
- Figure 20: Europe Bicycle Market Volume (K Units), by Distribution Channel 2025 & 2033
- Figure 21: Europe Bicycle Market Revenue Share (%), by Distribution Channel 2025 & 2033
- Figure 22: Europe Bicycle Market Volume Share (%), by Distribution Channel 2025 & 2033
- Figure 23: Europe Bicycle Market Revenue (Million), by Country 2025 & 2033
- Figure 24: Europe Bicycle Market Volume (K Units), by Country 2025 & 2033
- Figure 25: Europe Bicycle Market Revenue Share (%), by Country 2025 & 2033
- Figure 26: Europe Bicycle Market Volume Share (%), by Country 2025 & 2033
- Figure 27: Asia Pacific Bicycle Market Revenue (Million), by Type 2025 & 2033
- Figure 28: Asia Pacific Bicycle Market Volume (K Units), by Type 2025 & 2033
- Figure 29: Asia Pacific Bicycle Market Revenue Share (%), by Type 2025 & 2033
- Figure 30: Asia Pacific Bicycle Market Volume Share (%), by Type 2025 & 2033
- Figure 31: Asia Pacific Bicycle Market Revenue (Million), by Distribution Channel 2025 & 2033
- Figure 32: Asia Pacific Bicycle Market Volume (K Units), by Distribution Channel 2025 & 2033
- Figure 33: Asia Pacific Bicycle Market Revenue Share (%), by Distribution Channel 2025 & 2033
- Figure 34: Asia Pacific Bicycle Market Volume Share (%), by Distribution Channel 2025 & 2033
- Figure 35: Asia Pacific Bicycle Market Revenue (Million), by Country 2025 & 2033
- Figure 36: Asia Pacific Bicycle Market Volume (K Units), by Country 2025 & 2033
- Figure 37: Asia Pacific Bicycle Market Revenue Share (%), by Country 2025 & 2033
- Figure 38: Asia Pacific Bicycle Market Volume Share (%), by Country 2025 & 2033
- Figure 39: South America Bicycle Market Revenue (Million), by Type 2025 & 2033
- Figure 40: South America Bicycle Market Volume (K Units), by Type 2025 & 2033
- Figure 41: South America Bicycle Market Revenue Share (%), by Type 2025 & 2033
- Figure 42: South America Bicycle Market Volume Share (%), by Type 2025 & 2033
- Figure 43: South America Bicycle Market Revenue (Million), by Distribution Channel 2025 & 2033
- Figure 44: South America Bicycle Market Volume (K Units), by Distribution Channel 2025 & 2033
- Figure 45: South America Bicycle Market Revenue Share (%), by Distribution Channel 2025 & 2033
- Figure 46: South America Bicycle Market Volume Share (%), by Distribution Channel 2025 & 2033
- Figure 47: South America Bicycle Market Revenue (Million), by Country 2025 & 2033
- Figure 48: South America Bicycle Market Volume (K Units), by Country 2025 & 2033
- Figure 49: South America Bicycle Market Revenue Share (%), by Country 2025 & 2033
- Figure 50: South America Bicycle Market Volume Share (%), by Country 2025 & 2033
- Figure 51: Middle East and Africa Bicycle Market Revenue (Million), by Type 2025 & 2033
- Figure 52: Middle East and Africa Bicycle Market Volume (K Units), by Type 2025 & 2033
- Figure 53: Middle East and Africa Bicycle Market Revenue Share (%), by Type 2025 & 2033
- Figure 54: Middle East and Africa Bicycle Market Volume Share (%), by Type 2025 & 2033
- Figure 55: Middle East and Africa Bicycle Market Revenue (Million), by Distribution Channel 2025 & 2033
- Figure 56: Middle East and Africa Bicycle Market Volume (K Units), by Distribution Channel 2025 & 2033
- Figure 57: Middle East and Africa Bicycle Market Revenue Share (%), by Distribution Channel 2025 & 2033
- Figure 58: Middle East and Africa Bicycle Market Volume Share (%), by Distribution Channel 2025 & 2033
- Figure 59: Middle East and Africa Bicycle Market Revenue (Million), by Country 2025 & 2033
- Figure 60: Middle East and Africa Bicycle Market Volume (K Units), by Country 2025 & 2033
- Figure 61: Middle East and Africa Bicycle Market Revenue Share (%), by Country 2025 & 2033
- Figure 62: Middle East and Africa Bicycle Market Volume Share (%), by Country 2025 & 2033
List of Tables
- Table 1: Global Bicycle Market Revenue Million Forecast, by Type 2020 & 2033
- Table 2: Global Bicycle Market Volume K Units Forecast, by Type 2020 & 2033
- Table 3: Global Bicycle Market Revenue Million Forecast, by Distribution Channel 2020 & 2033
- Table 4: Global Bicycle Market Volume K Units Forecast, by Distribution Channel 2020 & 2033
- Table 5: Global Bicycle Market Revenue Million Forecast, by Region 2020 & 2033
- Table 6: Global Bicycle Market Volume K Units Forecast, by Region 2020 & 2033
- Table 7: Global Bicycle Market Revenue Million Forecast, by Type 2020 & 2033
- Table 8: Global Bicycle Market Volume K Units Forecast, by Type 2020 & 2033
- Table 9: Global Bicycle Market Revenue Million Forecast, by Distribution Channel 2020 & 2033
- Table 10: Global Bicycle Market Volume K Units Forecast, by Distribution Channel 2020 & 2033
- Table 11: Global Bicycle Market Revenue Million Forecast, by Country 2020 & 2033
- Table 12: Global Bicycle Market Volume K Units Forecast, by Country 2020 & 2033
- Table 13: United States Bicycle Market Revenue (Million) Forecast, by Application 2020 & 2033
- Table 14: United States Bicycle Market Volume (K Units) Forecast, by Application 2020 & 2033
- Table 15: Canada Bicycle Market Revenue (Million) Forecast, by Application 2020 & 2033
- Table 16: Canada Bicycle Market Volume (K Units) Forecast, by Application 2020 & 2033
- Table 17: Mexico Bicycle Market Revenue (Million) Forecast, by Application 2020 & 2033
- Table 18: Mexico Bicycle Market Volume (K Units) Forecast, by Application 2020 & 2033
- Table 19: Rest of North America Bicycle Market Revenue (Million) Forecast, by Application 2020 & 2033
- Table 20: Rest of North America Bicycle Market Volume (K Units) Forecast, by Application 2020 & 2033
- Table 21: Global Bicycle Market Revenue Million Forecast, by Type 2020 & 2033
- Table 22: Global Bicycle Market Volume K Units Forecast, by Type 2020 & 2033
- Table 23: Global Bicycle Market Revenue Million Forecast, by Distribution Channel 2020 & 2033
- Table 24: Global Bicycle Market Volume K Units Forecast, by Distribution Channel 2020 & 2033
- Table 25: Global Bicycle Market Revenue Million Forecast, by Country 2020 & 2033
- Table 26: Global Bicycle Market Volume K Units Forecast, by Country 2020 & 2033
- Table 27: United Kingdom Bicycle Market Revenue (Million) Forecast, by Application 2020 & 2033
- Table 28: United Kingdom Bicycle Market Volume (K Units) Forecast, by Application 2020 & 2033
- Table 29: Germany Bicycle Market Revenue (Million) Forecast, by Application 2020 & 2033
- Table 30: Germany Bicycle Market Volume (K Units) Forecast, by Application 2020 & 2033
- Table 31: Spain Bicycle Market Revenue (Million) Forecast, by Application 2020 & 2033
- Table 32: Spain Bicycle Market Volume (K Units) Forecast, by Application 2020 & 2033
- Table 33: France Bicycle Market Revenue (Million) Forecast, by Application 2020 & 2033
- Table 34: France Bicycle Market Volume (K Units) Forecast, by Application 2020 & 2033
- Table 35: Italy Bicycle Market Revenue (Million) Forecast, by Application 2020 & 2033
- Table 36: Italy Bicycle Market Volume (K Units) Forecast, by Application 2020 & 2033
- Table 37: Russia Bicycle Market Revenue (Million) Forecast, by Application 2020 & 2033
- Table 38: Russia Bicycle Market Volume (K Units) Forecast, by Application 2020 & 2033
- Table 39: Netherlands Bicycle Market Revenue (Million) Forecast, by Application 2020 & 2033
- Table 40: Netherlands Bicycle Market Volume (K Units) Forecast, by Application 2020 & 2033
- Table 41: Rest of Europe Bicycle Market Revenue (Million) Forecast, by Application 2020 & 2033
- Table 42: Rest of Europe Bicycle Market Volume (K Units) Forecast, by Application 2020 & 2033
- Table 43: Global Bicycle Market Revenue Million Forecast, by Type 2020 & 2033
- Table 44: Global Bicycle Market Volume K Units Forecast, by Type 2020 & 2033
- Table 45: Global Bicycle Market Revenue Million Forecast, by Distribution Channel 2020 & 2033
- Table 46: Global Bicycle Market Volume K Units Forecast, by Distribution Channel 2020 & 2033
- Table 47: Global Bicycle Market Revenue Million Forecast, by Country 2020 & 2033
- Table 48: Global Bicycle Market Volume K Units Forecast, by Country 2020 & 2033
- Table 49: China Bicycle Market Revenue (Million) Forecast, by Application 2020 & 2033
- Table 50: China Bicycle Market Volume (K Units) Forecast, by Application 2020 & 2033
- Table 51: Japan Bicycle Market Revenue (Million) Forecast, by Application 2020 & 2033
- Table 52: Japan Bicycle Market Volume (K Units) Forecast, by Application 2020 & 2033
- Table 53: India Bicycle Market Revenue (Million) Forecast, by Application 2020 & 2033
- Table 54: India Bicycle Market Volume (K Units) Forecast, by Application 2020 & 2033
- Table 55: Australia Bicycle Market Revenue (Million) Forecast, by Application 2020 & 2033
- Table 56: Australia Bicycle Market Volume (K Units) Forecast, by Application 2020 & 2033
- Table 57: Rest of Asia Pacific Bicycle Market Revenue (Million) Forecast, by Application 2020 & 2033
- Table 58: Rest of Asia Pacific Bicycle Market Volume (K Units) Forecast, by Application 2020 & 2033
- Table 59: Global Bicycle Market Revenue Million Forecast, by Type 2020 & 2033
- Table 60: Global Bicycle Market Volume K Units Forecast, by Type 2020 & 2033
- Table 61: Global Bicycle Market Revenue Million Forecast, by Distribution Channel 2020 & 2033
- Table 62: Global Bicycle Market Volume K Units Forecast, by Distribution Channel 2020 & 2033
- Table 63: Global Bicycle Market Revenue Million Forecast, by Country 2020 & 2033
- Table 64: Global Bicycle Market Volume K Units Forecast, by Country 2020 & 2033
- Table 65: Brazil Bicycle Market Revenue (Million) Forecast, by Application 2020 & 2033
- Table 66: Brazil Bicycle Market Volume (K Units) Forecast, by Application 2020 & 2033
- Table 67: Argentina Bicycle Market Revenue (Million) Forecast, by Application 2020 & 2033
- Table 68: Argentina Bicycle Market Volume (K Units) Forecast, by Application 2020 & 2033
- Table 69: Chile Bicycle Market Revenue (Million) Forecast, by Application 2020 & 2033
- Table 70: Chile Bicycle Market Volume (K Units) Forecast, by Application 2020 & 2033
- Table 71: Rest of South America Bicycle Market Revenue (Million) Forecast, by Application 2020 & 2033
- Table 72: Rest of South America Bicycle Market Volume (K Units) Forecast, by Application 2020 & 2033
- Table 73: Global Bicycle Market Revenue Million Forecast, by Type 2020 & 2033
- Table 74: Global Bicycle Market Volume K Units Forecast, by Type 2020 & 2033
- Table 75: Global Bicycle Market Revenue Million Forecast, by Distribution Channel 2020 & 2033
- Table 76: Global Bicycle Market Volume K Units Forecast, by Distribution Channel 2020 & 2033
- Table 77: Global Bicycle Market Revenue Million Forecast, by Country 2020 & 2033
- Table 78: Global Bicycle Market Volume K Units Forecast, by Country 2020 & 2033
- Table 79: United Arab Emirates Bicycle Market Revenue (Million) Forecast, by Application 2020 & 2033
- Table 80: United Arab Emirates Bicycle Market Volume (K Units) Forecast, by Application 2020 & 2033
- Table 81: South Africa Bicycle Market Revenue (Million) Forecast, by Application 2020 & 2033
- Table 82: South Africa Bicycle Market Volume (K Units) Forecast, by Application 2020 & 2033
- Table 83: Rest of Middle East and Africa Bicycle Market Revenue (Million) Forecast, by Application 2020 & 2033
- Table 84: Rest of Middle East and Africa Bicycle Market Volume (K Units) Forecast, by Application 2020 & 2033
Frequently Asked Questions
1. What is the projected Compound Annual Growth Rate (CAGR) of the Bicycle Market?
The projected CAGR is approximately 4.20%.
2. Which companies are prominent players in the Bicycle Market?
Key companies in the market include Accell Group NV, Pedego Inc, Hero Cycles Limited, Pon Holdings BV, Bulls Bikes, Giant Manufacturing Co Ltd, Riese Und Muller Gmbh*List Not Exhaustive, Benno Bikes LLC, Ribble Cycles, Trek Bicycle Corporation.
3. What are the main segments of the Bicycle Market?
The market segments include Type, Distribution Channel.
4. Can you provide details about the market size?
The market size is estimated to be USD 56.16 Million as of 2022.
5. What are some drivers contributing to market growth?
Increasing Number of Cycling Events; Growing Health Conscious and Environmentally Friendly Population.
6. What are the notable trends driving market growth?
Increasing Number of Cycling Events.
7. Are there any restraints impacting market growth?
Availability of Alternative Transport Solutions.
8. Can you provide examples of recent developments in the market?
N/A
9. What pricing options are available for accessing the report?
Pricing options include single-user, multi-user, and enterprise licenses priced at USD 4750, USD 5250, and USD 8750 respectively.
10. Is the market size provided in terms of value or volume?
The market size is provided in terms of value, measured in Million and volume, measured in K Units.
11. Are there any specific market keywords associated with the report?
Yes, the market keyword associated with the report is "Bicycle Market," which aids in identifying and referencing the specific market segment covered.
12. How do I determine which pricing option suits my needs best?
The pricing options vary based on user requirements and access needs. Individual users may opt for single-user licenses, while businesses requiring broader access may choose multi-user or enterprise licenses for cost-effective access to the report.
13. Are there any additional resources or data provided in the Bicycle Market report?
While the report offers comprehensive insights, it's advisable to review the specific contents or supplementary materials provided to ascertain if additional resources or data are available.
14. How can I stay updated on further developments or reports in the Bicycle Market?
To stay informed about further developments, trends, and reports in the Bicycle Market, consider subscribing to industry newsletters, following relevant companies and organizations, or regularly checking reputable industry news sources and publications.
Methodology
Step 1 - Identification of Relevant Samples Size from Population Database


Step 2 - Approaches for Defining Global Market Size (Value, Volume* & Price*)

Note*: In applicable scenarios
Step 3 - Data Sources
Primary Research
- Web Analytics
- Survey Reports
- Research Institute
- Latest Research Reports
- Opinion Leaders
Secondary Research
- Annual Reports
- White Paper
- Latest Press Release
- Industry Association
- Paid Database
- Investor Presentations

Step 4 - Data Triangulation
Involves using different sources of information in order to increase the validity of a study
These sources are likely to be stakeholders in a program - participants, other researchers, program staff, other community members, and so on.
Then we put all data in single framework & apply various statistical tools to find out the dynamic on the market.
During the analysis stage, feedback from the stakeholder groups would be compared to determine areas of agreement as well as areas of divergence