

Key Insights
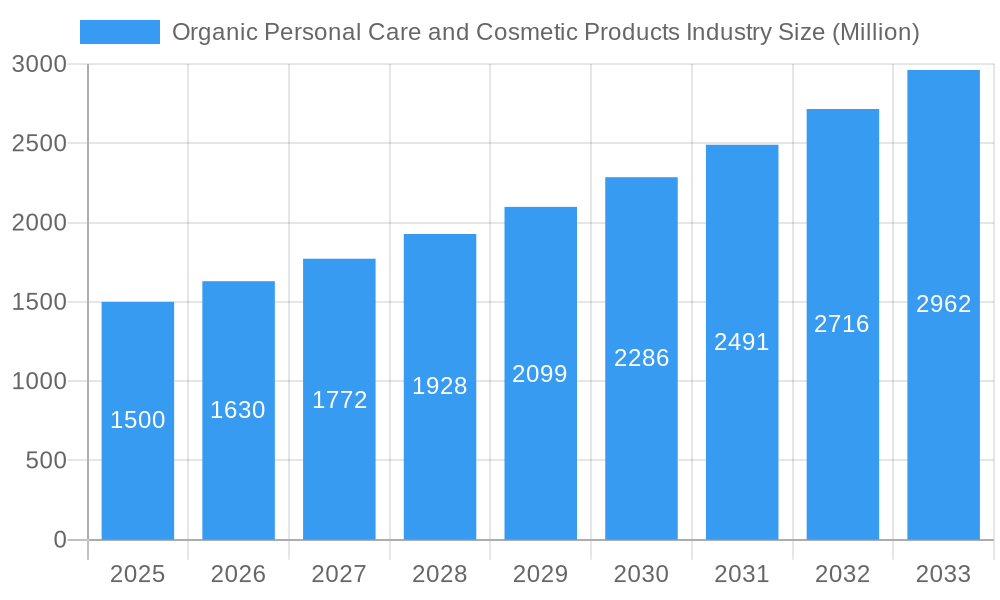
The organic personal care and cosmetic products market is poised for substantial growth, driven by heightened consumer awareness of synthetic chemical risks and a pronounced shift towards natural, sustainable options. The market, estimated at $34.2 billion in 2025, is projected to expand at a Compound Annual Growth Rate (CAGR) of 8.4%. Key growth catalysts include escalating demand for eco-friendly and ethically sourced items, rising disposable incomes in emerging economies, and a greater emphasis on personal well-being. Skincare, haircare, and personal care segments are leading demand. While online retail is growing rapidly, traditional channels like supermarkets and specialist stores retain importance. Challenges include higher pricing and supply chain complexities, yet the market's outlook remains positive. The competitive arena features established corporations and niche players, catering to diverse consumer preferences. North America and Europe currently dominate, with Asia Pacific expected to exhibit significant future growth due to its expanding middle class and increasing organic product awareness.
Organic Personal Care and Cosmetic Products Industry Market Size (In Billion)
Evolving consumer behavior is a critical factor in the sustained expansion of the organic personal care and cosmetics sector. Informed purchasing decisions are prioritizing ingredient transparency and ethical sourcing. This trend directly fuels demand for certified organic products and rewards brands committed to sustainability and responsible manufacturing. Innovations in organic formulation and packaging are enhancing product efficacy and reducing environmental impact, further contributing to market expansion. The industry's future success depends on continuous innovation, effectively addressing ingredient sourcing challenges, and maintaining price competitiveness while upholding quality standards. Strategic R&D investments by major companies and the emergence of new, innovative brands will shape the competitive landscape and propel the market forward.
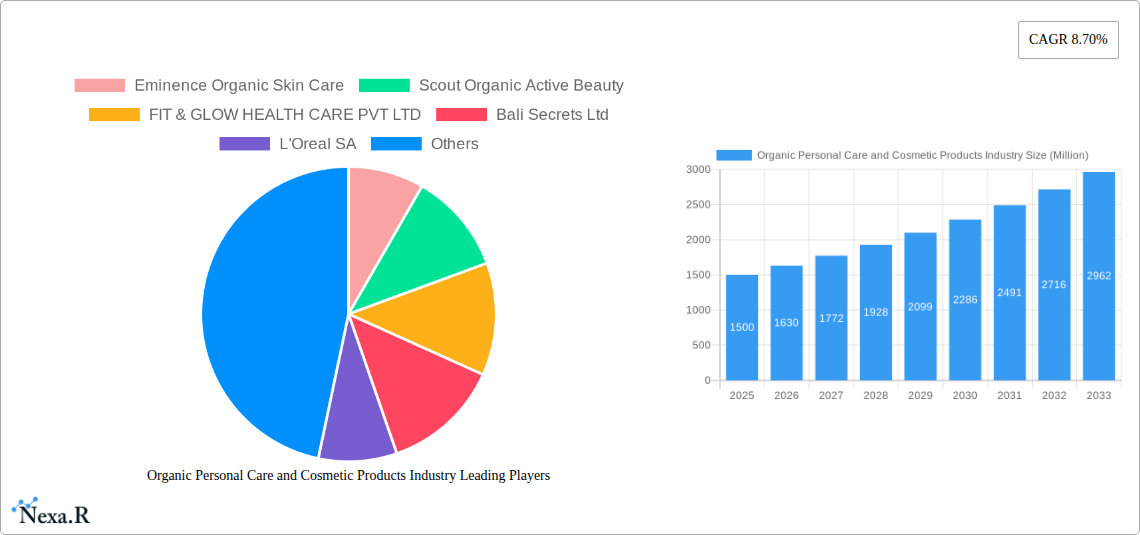
Organic Personal Care and Cosmetic Products Industry Company Market Share
Organic Personal Care and Cosmetic Products Industry Market Report: 2019-2033
This comprehensive report provides a detailed analysis of the organic personal care and cosmetic products industry, covering market dynamics, growth trends, dominant segments, and key players. The study period spans from 2019 to 2033, with 2025 serving as the base and estimated year. The report offers valuable insights for industry professionals, investors, and businesses seeking to navigate this rapidly evolving market.
Keywords: Organic Personal Care, Organic Cosmetics, Natural Cosmetics, Sustainable Beauty, Personal Care Products, Hair Care Products, Skin Care Products, Bath and Shower Products, Deodorants, Antiperspirants, Cosmetics, Specialist Retail, Supermarkets, Online Retail, Market Size, Market Share, CAGR, Market Growth, Industry Trends, Eminence Organic Skin Care, L'Oreal SA, Hain Celestial Group, Bio Veda Action Research Pvt Ltd, Market Analysis, Market Forecast
Organic Personal Care and Cosmetic Products Industry Market Dynamics & Structure
The organic personal care and cosmetic products market is characterized by increasing consumer demand for natural and sustainable products. Market concentration is moderate, with several large players alongside numerous smaller niche brands. Technological innovation, particularly in ingredient sourcing and formulation, is a key driver, while stringent regulatory frameworks, particularly concerning labeling and ingredient safety, shape market practices. Competition from conventional personal care products remains significant, yet the increasing awareness of the potential harmful effects of synthetic chemicals fuels the growth of the organic segment. The market witnesses significant M&A activity, with larger companies acquiring smaller brands to expand their product portfolios and market reach.
- Market Concentration: Moderate, with a mix of large multinational corporations and smaller specialized brands. The top 5 players hold approximately xx% of the market share in 2025.
- Technological Innovation: Focus on sustainable sourcing, eco-friendly packaging, and advanced formulation techniques. Innovation barriers include high R&D costs and stringent regulatory approvals.
- Regulatory Framework: Stringent regulations concerning labeling, ingredient safety, and environmental impact vary across regions, impacting market access and competitiveness.
- Competitive Substitutes: Conventional personal care and cosmetic products pose a significant competitive threat, although consumer preference for natural ingredients is a differentiating factor.
- End-User Demographics: Primarily driven by millennials and Gen Z consumers who are increasingly conscious of health, sustainability, and ethical consumption.
- M&A Trends: Increased M&A activity, with xx deals recorded between 2019 and 2024, indicating consolidation within the industry.
Organic Personal Care and Cosmetic Products Industry Growth Trends & Insights
The organic personal care and cosmetic products market has witnessed significant growth over the historical period (2019-2024), fueled by rising consumer awareness of the harmful effects of synthetic chemicals and a growing preference for natural and sustainable products. This trend is expected to continue during the forecast period (2025-2033), with a projected Compound Annual Growth Rate (CAGR) of xx% from 2025 to 2033. Market penetration is expected to increase from xx% in 2025 to xx% by 2033. Technological disruptions, such as the use of AI in personalized skincare recommendations and the development of innovative sustainable packaging solutions, are further driving market expansion. Consumer behavior is shifting towards transparency and traceability, demanding detailed information about product ingredients and sourcing practices. This trend places increased emphasis on ethical and sustainable sourcing of raw materials.
Dominant Regions, Countries, or Segments in Organic Personal Care and Cosmetic Products Industry
The North American and European regions currently dominate the organic personal care and cosmetic products market, driven by high consumer awareness and disposable income. Within product types, skincare products account for the largest market share, followed by hair care and cosmetics. Online retail channels are experiencing significant growth, surpassing traditional retail channels in terms of growth rate.
- Leading Regions: North America and Europe, driven by strong consumer demand and high awareness of natural and organic products.
- Leading Product Type: Skin care products, owing to the diverse range of applications and growing concerns about skin health.
- Leading Distribution Channel: Online retail channels, benefiting from increased accessibility and consumer preference for online shopping.
- Key Drivers: Increasing consumer awareness of health and sustainability, rising disposable incomes in developed economies, and expanding e-commerce infrastructure.
Organic Personal Care and Cosmetic Products Industry Product Landscape
Product innovation is focused on developing natural and effective formulations, utilizing sustainably sourced ingredients and eco-friendly packaging. Key innovations include the use of plant-based extracts with proven efficacy, incorporation of advanced delivery systems for enhanced product performance, and the development of customizable skincare regimens. Unique selling propositions include certifications (e.g., USDA Organic, COSMOS), transparency in ingredient sourcing, and emphasis on ethical and sustainable practices.
Key Drivers, Barriers & Challenges in Organic Personal Care and Cosmetic Products Industry
Key Drivers: Growing consumer preference for natural and sustainable products, rising awareness of harmful chemicals in conventional products, and increased availability of certified organic ingredients. Government initiatives promoting sustainable consumption further drive market growth.
Key Challenges: Higher production costs compared to conventional products, stringent regulatory requirements, and challenges in maintaining consistent product quality due to the nature of natural ingredients. Supply chain complexities and ensuring the sustainability of sourcing practices pose significant challenges. Competition from large established players with significant marketing budgets and distribution networks also affects market penetration. The quantification of these challenges is difficult and often expressed in terms of higher production costs (xx% higher than conventional products) and reduced market penetration in some regions (xx% lower than predicted).
Emerging Opportunities in Organic Personal Care and Cosmetic Products Industry
Emerging opportunities include tapping into the growing demand for personalized skincare solutions, expanding into emerging markets with increasing disposable incomes, and developing innovative product formats for convenience and sustainability. Consumer preference for personalized and customized products drives opportunities for specialized formulations and targeted solutions. Developing products that cater to specific skin types and concerns is key.
Growth Accelerators in the Organic Personal Care and Cosmetic Products Industry Industry
Technological advancements in ingredient extraction, formulation, and packaging are key growth accelerators. Strategic partnerships, such as collaborations between ingredient suppliers and manufacturers, accelerate product development and market penetration. Expanding into new geographic markets and introducing innovative product lines and marketing campaigns are crucial for driving long-term growth. The focus on sustainability and transparency gains more importance with each passing year.
Key Players Shaping the Organic Personal Care and Cosmetic Products Industry Market
- Eminence Organic Skin Care
- Scout Organic Active Beauty
- FIT & GLOW HEALTH CARE PVT LTD
- Bali Secrets Ltd
- L'Oreal SA
- Dr Organic Ltd
- Hain Celestial Group
- Bio Veda Action Research Pvt Ltd
Notable Milestones in Organic Personal Care and Cosmetic Products Industry Sector
- 2020: Increased focus on sustainable packaging solutions across major brands.
- 2021: Several significant M&A activities in the industry consolidated the market.
- 2022: Launch of several new product lines emphasizing ethical sourcing and transparency.
- 2023: Growing adoption of certifications and third-party verification of organic claims.
- 2024: Rising focus on personalized and customized organic skincare products.
In-Depth Organic Personal Care and Cosmetic Products Industry Market Outlook
The organic personal care and cosmetic products market is poised for continued strong growth, driven by ongoing consumer demand for natural and sustainable products and technological advancements in formulation and packaging. Strategic opportunities exist in personalized skincare, expanding into emerging markets, and developing innovative product lines catering to specific consumer needs and preferences. The increasing focus on sustainability and transparency will further shape the market's trajectory.
Organic Personal Care and Cosmetic Products Industry Segmentation
-
1. Product Type
-
1.1. Personal Care Products
-
1.1.1. Hair Care Products
- 1.1.1.1. Shampoo
- 1.1.1.2. Conditioners
- 1.1.1.3. Hair Oil
- 1.1.1.4. Hair styling and Coloring Products
- 1.1.1.5. Other Hair Care Products
-
1.1.2. Skin Care Products
- 1.1.2.1. Facial Care Products
- 1.1.2.2. Body Care Products
- 1.1.2.3. Lip Care Products
-
1.1.3. Bath and Shower
- 1.1.3.1. Shower Gels
- 1.1.3.2. Soaps
- 1.1.3.3. Bath Salts
- 1.1.3.4. Other Bath and Shower Products
- 1.1.4. Oral Care
- 1.1.5. Men's Grooming Products
- 1.1.6. Deodorants and Antiperspirants
-
1.1.1. Hair Care Products
-
1.2. Cosmetics Products
- 1.2.1. Facial Cosmetics
- 1.2.2. Eye Cosmetic Products
- 1.2.3. Lip and Nail Make-up Products
-
1.1. Personal Care Products
-
2. Distribution Channel
- 2.1. Specialist Retail Stores
- 2.2. Supermarkets/Hypermarkets
- 2.3. Convenience Stores
- 2.4. Pharmacies/Drug Stores
- 2.5. Online Retail Channels
- 2.6. Other Distribution Channels
Organic Personal Care and Cosmetic Products Industry Segmentation By Geography
-
1. North America
- 1.1. United States
- 1.2. Canada
- 1.3. Mexico
- 1.4. Rest of North America
-
2. Europe
- 2.1. Spain
- 2.2. United Kingdom
- 2.3. Germany
- 2.4. France
- 2.5. Italy
- 2.6. Russia
- 2.7. Rest of Europe
-
3. Asia Pacific
- 3.1. China
- 3.2. Japan
- 3.3. India
- 3.4. Australia
- 3.5. Rest of Asia Pacific
-
4. South America
- 4.1. Brazil
- 4.2. Argentina
- 4.3. Rest of South America
-
5. Middle East and Africa
- 5.1. South Africa
- 5.2. Saudi Arabia
- 5.3. Rest of Middle East and Africa
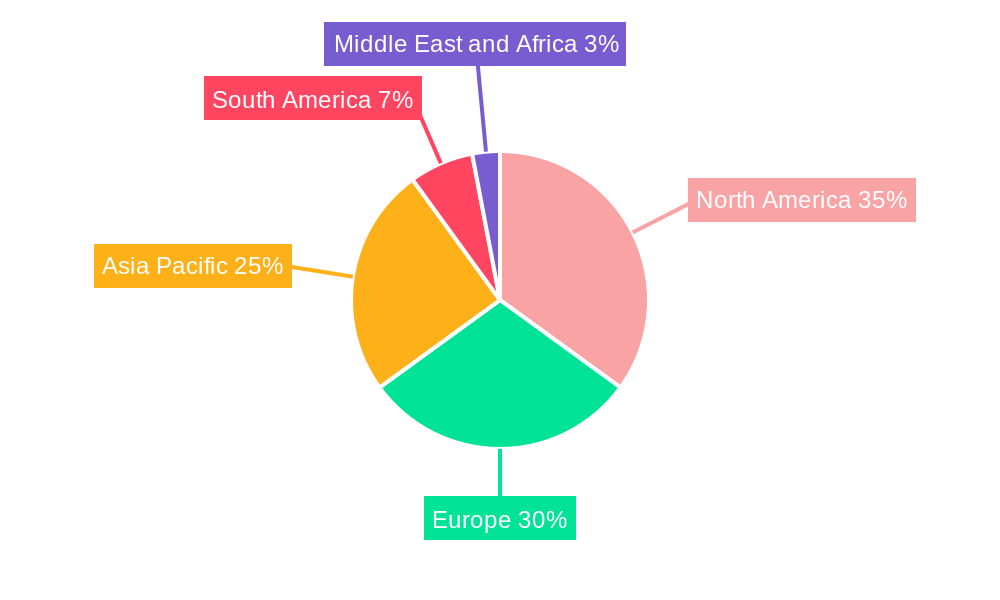
Organic Personal Care and Cosmetic Products Industry Regional Market Share
Geographic Coverage of Organic Personal Care and Cosmetic Products Industry
Organic Personal Care and Cosmetic Products Industry REPORT HIGHLIGHTS
| Aspects | Details |
|---|---|
| Study Period | 2020-2034 |
| Base Year | 2025 |
| Estimated Year | 2026 |
| Forecast Period | 2026-2034 |
| Historical Period | 2020-2025 |
| Growth Rate | CAGR of 8.4% from 2020-2034 |
| Segmentation |
|
Table of Contents
- 1. Introduction
- 1.1. Research Scope
- 1.2. Market Segmentation
- 1.3. Research Objective
- 1.4. Definitions and Assumptions
- 2. Executive Summary
- 2.1. Market Snapshot
- 3. Market Dynamics
- 3.1. Market Drivers
- 3.2. Market Restrains
- 3.3. Market Trends
- 3.4. Market Opportunities
- 4. Market Factor Analysis
- 4.1. Porters Five Forces
- 4.1.1. Bargaining Power of Suppliers
- 4.1.2. Bargaining Power of Buyers
- 4.1.3. Threat of New Entrants
- 4.1.4. Threat of Substitutes
- 4.1.5. Competitive Rivalry
- 4.2. PESTEL analysis
- 4.3. BCG Analysis
- 4.3.1. Stars (High Growth, High Market Share)
- 4.3.2. Cash Cows (Low Growth, High Market Share)
- 4.3.3. Question Mark (High Growth, Low Market Share)
- 4.3.4. Dogs (Low Growth, Low Market Share)
- 4.4. Ansoff Matrix Analysis
- 4.5. Supply Chain Analysis
- 4.6. Regulatory Landscape
- 4.7. Current Market Potential and Opportunity Assessment (TAM–SAM–SOM Framework)
- 4.8. NRP Analyst Note
- 4.1. Porters Five Forces
- 5. Market Analysis, Insights and Forecast 2021-2033
- 5.1. Market Analysis, Insights and Forecast - by Product Type
- 5.1.1. Personal Care Products
- 5.1.1.1. Hair Care Products
- 5.1.1.1.1. Shampoo
- 5.1.1.1.2. Conditioners
- 5.1.1.1.3. Hair Oil
- 5.1.1.1.4. Hair styling and Coloring Products
- 5.1.1.1.5. Other Hair Care Products
- 5.1.1.2. Skin Care Products
- 5.1.1.2.1. Facial Care Products
- 5.1.1.2.2. Body Care Products
- 5.1.1.2.3. Lip Care Products
- 5.1.1.3. Bath and Shower
- 5.1.1.3.1. Shower Gels
- 5.1.1.3.2. Soaps
- 5.1.1.3.3. Bath Salts
- 5.1.1.3.4. Other Bath and Shower Products
- 5.1.1.4. Oral Care
- 5.1.1.5. Men's Grooming Products
- 5.1.1.6. Deodorants and Antiperspirants
- 5.1.1.1. Hair Care Products
- 5.1.2. Cosmetics Products
- 5.1.2.1. Facial Cosmetics
- 5.1.2.2. Eye Cosmetic Products
- 5.1.2.3. Lip and Nail Make-up Products
- 5.1.1. Personal Care Products
- 5.2. Market Analysis, Insights and Forecast - by Distribution Channel
- 5.2.1. Specialist Retail Stores
- 5.2.2. Supermarkets/Hypermarkets
- 5.2.3. Convenience Stores
- 5.2.4. Pharmacies/Drug Stores
- 5.2.5. Online Retail Channels
- 5.2.6. Other Distribution Channels
- 5.3. Market Analysis, Insights and Forecast - by Region
- 5.3.1. North America
- 5.3.2. Europe
- 5.3.3. Asia Pacific
- 5.3.4. South America
- 5.3.5. Middle East and Africa
- 5.1. Market Analysis, Insights and Forecast - by Product Type
- 6. Global Organic Personal Care and Cosmetic Products Industry Analysis, Insights and Forecast, 2021-2033
- 6.1. Market Analysis, Insights and Forecast - by Product Type
- 6.1.1. Personal Care Products
- 6.1.1.1. Hair Care Products
- 6.1.1.1.1. Shampoo
- 6.1.1.1.2. Conditioners
- 6.1.1.1.3. Hair Oil
- 6.1.1.1.4. Hair styling and Coloring Products
- 6.1.1.1.5. Other Hair Care Products
- 6.1.1.2. Skin Care Products
- 6.1.1.2.1. Facial Care Products
- 6.1.1.2.2. Body Care Products
- 6.1.1.2.3. Lip Care Products
- 6.1.1.3. Bath and Shower
- 6.1.1.3.1. Shower Gels
- 6.1.1.3.2. Soaps
- 6.1.1.3.3. Bath Salts
- 6.1.1.3.4. Other Bath and Shower Products
- 6.1.1.4. Oral Care
- 6.1.1.5. Men's Grooming Products
- 6.1.1.6. Deodorants and Antiperspirants
- 6.1.1.1. Hair Care Products
- 6.1.2. Cosmetics Products
- 6.1.2.1. Facial Cosmetics
- 6.1.2.2. Eye Cosmetic Products
- 6.1.2.3. Lip and Nail Make-up Products
- 6.1.1. Personal Care Products
- 6.2. Market Analysis, Insights and Forecast - by Distribution Channel
- 6.2.1. Specialist Retail Stores
- 6.2.2. Supermarkets/Hypermarkets
- 6.2.3. Convenience Stores
- 6.2.4. Pharmacies/Drug Stores
- 6.2.5. Online Retail Channels
- 6.2.6. Other Distribution Channels
- 6.1. Market Analysis, Insights and Forecast - by Product Type
- 7. North America Organic Personal Care and Cosmetic Products Industry Analysis, Insights and Forecast, 2020-2032
- 7.1. Market Analysis, Insights and Forecast - by Product Type
- 7.1.1. Personal Care Products
- 7.1.1.1. Hair Care Products
- 7.1.1.1.1. Shampoo
- 7.1.1.1.2. Conditioners
- 7.1.1.1.3. Hair Oil
- 7.1.1.1.4. Hair styling and Coloring Products
- 7.1.1.1.5. Other Hair Care Products
- 7.1.1.2. Skin Care Products
- 7.1.1.2.1. Facial Care Products
- 7.1.1.2.2. Body Care Products
- 7.1.1.2.3. Lip Care Products
- 7.1.1.3. Bath and Shower
- 7.1.1.3.1. Shower Gels
- 7.1.1.3.2. Soaps
- 7.1.1.3.3. Bath Salts
- 7.1.1.3.4. Other Bath and Shower Products
- 7.1.1.4. Oral Care
- 7.1.1.5. Men's Grooming Products
- 7.1.1.6. Deodorants and Antiperspirants
- 7.1.1.1. Hair Care Products
- 7.1.2. Cosmetics Products
- 7.1.2.1. Facial Cosmetics
- 7.1.2.2. Eye Cosmetic Products
- 7.1.2.3. Lip and Nail Make-up Products
- 7.1.1. Personal Care Products
- 7.2. Market Analysis, Insights and Forecast - by Distribution Channel
- 7.2.1. Specialist Retail Stores
- 7.2.2. Supermarkets/Hypermarkets
- 7.2.3. Convenience Stores
- 7.2.4. Pharmacies/Drug Stores
- 7.2.5. Online Retail Channels
- 7.2.6. Other Distribution Channels
- 7.1. Market Analysis, Insights and Forecast - by Product Type
- 8. Europe Organic Personal Care and Cosmetic Products Industry Analysis, Insights and Forecast, 2020-2032
- 8.1. Market Analysis, Insights and Forecast - by Product Type
- 8.1.1. Personal Care Products
- 8.1.1.1. Hair Care Products
- 8.1.1.1.1. Shampoo
- 8.1.1.1.2. Conditioners
- 8.1.1.1.3. Hair Oil
- 8.1.1.1.4. Hair styling and Coloring Products
- 8.1.1.1.5. Other Hair Care Products
- 8.1.1.2. Skin Care Products
- 8.1.1.2.1. Facial Care Products
- 8.1.1.2.2. Body Care Products
- 8.1.1.2.3. Lip Care Products
- 8.1.1.3. Bath and Shower
- 8.1.1.3.1. Shower Gels
- 8.1.1.3.2. Soaps
- 8.1.1.3.3. Bath Salts
- 8.1.1.3.4. Other Bath and Shower Products
- 8.1.1.4. Oral Care
- 8.1.1.5. Men's Grooming Products
- 8.1.1.6. Deodorants and Antiperspirants
- 8.1.1.1. Hair Care Products
- 8.1.2. Cosmetics Products
- 8.1.2.1. Facial Cosmetics
- 8.1.2.2. Eye Cosmetic Products
- 8.1.2.3. Lip and Nail Make-up Products
- 8.1.1. Personal Care Products
- 8.2. Market Analysis, Insights and Forecast - by Distribution Channel
- 8.2.1. Specialist Retail Stores
- 8.2.2. Supermarkets/Hypermarkets
- 8.2.3. Convenience Stores
- 8.2.4. Pharmacies/Drug Stores
- 8.2.5. Online Retail Channels
- 8.2.6. Other Distribution Channels
- 8.1. Market Analysis, Insights and Forecast - by Product Type
- 9. Asia Pacific Organic Personal Care and Cosmetic Products Industry Analysis, Insights and Forecast, 2020-2032
- 9.1. Market Analysis, Insights and Forecast - by Product Type
- 9.1.1. Personal Care Products
- 9.1.1.1. Hair Care Products
- 9.1.1.1.1. Shampoo
- 9.1.1.1.2. Conditioners
- 9.1.1.1.3. Hair Oil
- 9.1.1.1.4. Hair styling and Coloring Products
- 9.1.1.1.5. Other Hair Care Products
- 9.1.1.2. Skin Care Products
- 9.1.1.2.1. Facial Care Products
- 9.1.1.2.2. Body Care Products
- 9.1.1.2.3. Lip Care Products
- 9.1.1.3. Bath and Shower
- 9.1.1.3.1. Shower Gels
- 9.1.1.3.2. Soaps
- 9.1.1.3.3. Bath Salts
- 9.1.1.3.4. Other Bath and Shower Products
- 9.1.1.4. Oral Care
- 9.1.1.5. Men's Grooming Products
- 9.1.1.6. Deodorants and Antiperspirants
- 9.1.1.1. Hair Care Products
- 9.1.2. Cosmetics Products
- 9.1.2.1. Facial Cosmetics
- 9.1.2.2. Eye Cosmetic Products
- 9.1.2.3. Lip and Nail Make-up Products
- 9.1.1. Personal Care Products
- 9.2. Market Analysis, Insights and Forecast - by Distribution Channel
- 9.2.1. Specialist Retail Stores
- 9.2.2. Supermarkets/Hypermarkets
- 9.2.3. Convenience Stores
- 9.2.4. Pharmacies/Drug Stores
- 9.2.5. Online Retail Channels
- 9.2.6. Other Distribution Channels
- 9.1. Market Analysis, Insights and Forecast - by Product Type
- 10. South America Organic Personal Care and Cosmetic Products Industry Analysis, Insights and Forecast, 2020-2032
- 10.1. Market Analysis, Insights and Forecast - by Product Type
- 10.1.1. Personal Care Products
- 10.1.1.1. Hair Care Products
- 10.1.1.1.1. Shampoo
- 10.1.1.1.2. Conditioners
- 10.1.1.1.3. Hair Oil
- 10.1.1.1.4. Hair styling and Coloring Products
- 10.1.1.1.5. Other Hair Care Products
- 10.1.1.2. Skin Care Products
- 10.1.1.2.1. Facial Care Products
- 10.1.1.2.2. Body Care Products
- 10.1.1.2.3. Lip Care Products
- 10.1.1.3. Bath and Shower
- 10.1.1.3.1. Shower Gels
- 10.1.1.3.2. Soaps
- 10.1.1.3.3. Bath Salts
- 10.1.1.3.4. Other Bath and Shower Products
- 10.1.1.4. Oral Care
- 10.1.1.5. Men's Grooming Products
- 10.1.1.6. Deodorants and Antiperspirants
- 10.1.1.1. Hair Care Products
- 10.1.2. Cosmetics Products
- 10.1.2.1. Facial Cosmetics
- 10.1.2.2. Eye Cosmetic Products
- 10.1.2.3. Lip and Nail Make-up Products
- 10.1.1. Personal Care Products
- 10.2. Market Analysis, Insights and Forecast - by Distribution Channel
- 10.2.1. Specialist Retail Stores
- 10.2.2. Supermarkets/Hypermarkets
- 10.2.3. Convenience Stores
- 10.2.4. Pharmacies/Drug Stores
- 10.2.5. Online Retail Channels
- 10.2.6. Other Distribution Channels
- 10.1. Market Analysis, Insights and Forecast - by Product Type
- 11. Middle East and Africa Organic Personal Care and Cosmetic Products Industry Analysis, Insights and Forecast, 2020-2032
- 11.1. Market Analysis, Insights and Forecast - by Product Type
- 11.1.1. Personal Care Products
- 11.1.1.1. Hair Care Products
- 11.1.1.1.1. Shampoo
- 11.1.1.1.2. Conditioners
- 11.1.1.1.3. Hair Oil
- 11.1.1.1.4. Hair styling and Coloring Products
- 11.1.1.1.5. Other Hair Care Products
- 11.1.1.2. Skin Care Products
- 11.1.1.2.1. Facial Care Products
- 11.1.1.2.2. Body Care Products
- 11.1.1.2.3. Lip Care Products
- 11.1.1.3. Bath and Shower
- 11.1.1.3.1. Shower Gels
- 11.1.1.3.2. Soaps
- 11.1.1.3.3. Bath Salts
- 11.1.1.3.4. Other Bath and Shower Products
- 11.1.1.4. Oral Care
- 11.1.1.5. Men's Grooming Products
- 11.1.1.6. Deodorants and Antiperspirants
- 11.1.1.1. Hair Care Products
- 11.1.2. Cosmetics Products
- 11.1.2.1. Facial Cosmetics
- 11.1.2.2. Eye Cosmetic Products
- 11.1.2.3. Lip and Nail Make-up Products
- 11.1.1. Personal Care Products
- 11.2. Market Analysis, Insights and Forecast - by Distribution Channel
- 11.2.1. Specialist Retail Stores
- 11.2.2. Supermarkets/Hypermarkets
- 11.2.3. Convenience Stores
- 11.2.4. Pharmacies/Drug Stores
- 11.2.5. Online Retail Channels
- 11.2.6. Other Distribution Channels
- 11.1. Market Analysis, Insights and Forecast - by Product Type
- 12. Competitive Analysis
- 12.1. Company Profiles
- 12.1.1 Eminence Organic Skin Care
- 12.1.1.1. Company Overview
- 12.1.1.2. Products
- 12.1.1.3. Company Financials
- 12.1.1.4. SWOT Analysis
- 12.1.2 Scout Organic Active Beauty
- 12.1.2.1. Company Overview
- 12.1.2.2. Products
- 12.1.2.3. Company Financials
- 12.1.2.4. SWOT Analysis
- 12.1.3 FIT & GLOW HEALTH CARE PVT LTD
- 12.1.3.1. Company Overview
- 12.1.3.2. Products
- 12.1.3.3. Company Financials
- 12.1.3.4. SWOT Analysis
- 12.1.4 Bali Secrets Ltd
- 12.1.4.1. Company Overview
- 12.1.4.2. Products
- 12.1.4.3. Company Financials
- 12.1.4.4. SWOT Analysis
- 12.1.5 L'Oreal SA
- 12.1.5.1. Company Overview
- 12.1.5.2. Products
- 12.1.5.3. Company Financials
- 12.1.5.4. SWOT Analysis
- 12.1.6 Dr Organic Ltd *List Not Exhaustive
- 12.1.6.1. Company Overview
- 12.1.6.2. Products
- 12.1.6.3. Company Financials
- 12.1.6.4. SWOT Analysis
- 12.1.7 Hain Celestial Group
- 12.1.7.1. Company Overview
- 12.1.7.2. Products
- 12.1.7.3. Company Financials
- 12.1.7.4. SWOT Analysis
- 12.1.8 Bio Veda Action Research Pvt Ltd
- 12.1.8.1. Company Overview
- 12.1.8.2. Products
- 12.1.8.3. Company Financials
- 12.1.8.4. SWOT Analysis
- 12.1.1 Eminence Organic Skin Care
- 12.2. Market Entropy
- 12.2.1 Company's Key Areas Served
- 12.2.2 Recent Developments
- 12.3. Company Market Share Analysis 2025
- 12.3.1 Top 5 Companies Market Share Analysis
- 12.3.2 Top 3 Companies Market Share Analysis
- 12.4. List of Potential Customers
- 13. Research Methodology
List of Figures
- Figure 1: Global Organic Personal Care and Cosmetic Products Industry Revenue Breakdown (billion, %) by Region 2025 & 2033
- Figure 2: Global Organic Personal Care and Cosmetic Products Industry Volume Breakdown (K Units, %) by Region 2025 & 2033
- Figure 3: North America Organic Personal Care and Cosmetic Products Industry Revenue (billion), by Product Type 2025 & 2033
- Figure 4: North America Organic Personal Care and Cosmetic Products Industry Volume (K Units), by Product Type 2025 & 2033
- Figure 5: North America Organic Personal Care and Cosmetic Products Industry Revenue Share (%), by Product Type 2025 & 2033
- Figure 6: North America Organic Personal Care and Cosmetic Products Industry Volume Share (%), by Product Type 2025 & 2033
- Figure 7: North America Organic Personal Care and Cosmetic Products Industry Revenue (billion), by Distribution Channel 2025 & 2033
- Figure 8: North America Organic Personal Care and Cosmetic Products Industry Volume (K Units), by Distribution Channel 2025 & 2033
- Figure 9: North America Organic Personal Care and Cosmetic Products Industry Revenue Share (%), by Distribution Channel 2025 & 2033
- Figure 10: North America Organic Personal Care and Cosmetic Products Industry Volume Share (%), by Distribution Channel 2025 & 2033
- Figure 11: North America Organic Personal Care and Cosmetic Products Industry Revenue (billion), by Country 2025 & 2033
- Figure 12: North America Organic Personal Care and Cosmetic Products Industry Volume (K Units), by Country 2025 & 2033
- Figure 13: North America Organic Personal Care and Cosmetic Products Industry Revenue Share (%), by Country 2025 & 2033
- Figure 14: North America Organic Personal Care and Cosmetic Products Industry Volume Share (%), by Country 2025 & 2033
- Figure 15: Europe Organic Personal Care and Cosmetic Products Industry Revenue (billion), by Product Type 2025 & 2033
- Figure 16: Europe Organic Personal Care and Cosmetic Products Industry Volume (K Units), by Product Type 2025 & 2033
- Figure 17: Europe Organic Personal Care and Cosmetic Products Industry Revenue Share (%), by Product Type 2025 & 2033
- Figure 18: Europe Organic Personal Care and Cosmetic Products Industry Volume Share (%), by Product Type 2025 & 2033
- Figure 19: Europe Organic Personal Care and Cosmetic Products Industry Revenue (billion), by Distribution Channel 2025 & 2033
- Figure 20: Europe Organic Personal Care and Cosmetic Products Industry Volume (K Units), by Distribution Channel 2025 & 2033
- Figure 21: Europe Organic Personal Care and Cosmetic Products Industry Revenue Share (%), by Distribution Channel 2025 & 2033
- Figure 22: Europe Organic Personal Care and Cosmetic Products Industry Volume Share (%), by Distribution Channel 2025 & 2033
- Figure 23: Europe Organic Personal Care and Cosmetic Products Industry Revenue (billion), by Country 2025 & 2033
- Figure 24: Europe Organic Personal Care and Cosmetic Products Industry Volume (K Units), by Country 2025 & 2033
- Figure 25: Europe Organic Personal Care and Cosmetic Products Industry Revenue Share (%), by Country 2025 & 2033
- Figure 26: Europe Organic Personal Care and Cosmetic Products Industry Volume Share (%), by Country 2025 & 2033
- Figure 27: Asia Pacific Organic Personal Care and Cosmetic Products Industry Revenue (billion), by Product Type 2025 & 2033
- Figure 28: Asia Pacific Organic Personal Care and Cosmetic Products Industry Volume (K Units), by Product Type 2025 & 2033
- Figure 29: Asia Pacific Organic Personal Care and Cosmetic Products Industry Revenue Share (%), by Product Type 2025 & 2033
- Figure 30: Asia Pacific Organic Personal Care and Cosmetic Products Industry Volume Share (%), by Product Type 2025 & 2033
- Figure 31: Asia Pacific Organic Personal Care and Cosmetic Products Industry Revenue (billion), by Distribution Channel 2025 & 2033
- Figure 32: Asia Pacific Organic Personal Care and Cosmetic Products Industry Volume (K Units), by Distribution Channel 2025 & 2033
- Figure 33: Asia Pacific Organic Personal Care and Cosmetic Products Industry Revenue Share (%), by Distribution Channel 2025 & 2033
- Figure 34: Asia Pacific Organic Personal Care and Cosmetic Products Industry Volume Share (%), by Distribution Channel 2025 & 2033
- Figure 35: Asia Pacific Organic Personal Care and Cosmetic Products Industry Revenue (billion), by Country 2025 & 2033
- Figure 36: Asia Pacific Organic Personal Care and Cosmetic Products Industry Volume (K Units), by Country 2025 & 2033
- Figure 37: Asia Pacific Organic Personal Care and Cosmetic Products Industry Revenue Share (%), by Country 2025 & 2033
- Figure 38: Asia Pacific Organic Personal Care and Cosmetic Products Industry Volume Share (%), by Country 2025 & 2033
- Figure 39: South America Organic Personal Care and Cosmetic Products Industry Revenue (billion), by Product Type 2025 & 2033
- Figure 40: South America Organic Personal Care and Cosmetic Products Industry Volume (K Units), by Product Type 2025 & 2033
- Figure 41: South America Organic Personal Care and Cosmetic Products Industry Revenue Share (%), by Product Type 2025 & 2033
- Figure 42: South America Organic Personal Care and Cosmetic Products Industry Volume Share (%), by Product Type 2025 & 2033
- Figure 43: South America Organic Personal Care and Cosmetic Products Industry Revenue (billion), by Distribution Channel 2025 & 2033
- Figure 44: South America Organic Personal Care and Cosmetic Products Industry Volume (K Units), by Distribution Channel 2025 & 2033
- Figure 45: South America Organic Personal Care and Cosmetic Products Industry Revenue Share (%), by Distribution Channel 2025 & 2033
- Figure 46: South America Organic Personal Care and Cosmetic Products Industry Volume Share (%), by Distribution Channel 2025 & 2033
- Figure 47: South America Organic Personal Care and Cosmetic Products Industry Revenue (billion), by Country 2025 & 2033
- Figure 48: South America Organic Personal Care and Cosmetic Products Industry Volume (K Units), by Country 2025 & 2033
- Figure 49: South America Organic Personal Care and Cosmetic Products Industry Revenue Share (%), by Country 2025 & 2033
- Figure 50: South America Organic Personal Care and Cosmetic Products Industry Volume Share (%), by Country 2025 & 2033
- Figure 51: Middle East and Africa Organic Personal Care and Cosmetic Products Industry Revenue (billion), by Product Type 2025 & 2033
- Figure 52: Middle East and Africa Organic Personal Care and Cosmetic Products Industry Volume (K Units), by Product Type 2025 & 2033
- Figure 53: Middle East and Africa Organic Personal Care and Cosmetic Products Industry Revenue Share (%), by Product Type 2025 & 2033
- Figure 54: Middle East and Africa Organic Personal Care and Cosmetic Products Industry Volume Share (%), by Product Type 2025 & 2033
- Figure 55: Middle East and Africa Organic Personal Care and Cosmetic Products Industry Revenue (billion), by Distribution Channel 2025 & 2033
- Figure 56: Middle East and Africa Organic Personal Care and Cosmetic Products Industry Volume (K Units), by Distribution Channel 2025 & 2033
- Figure 57: Middle East and Africa Organic Personal Care and Cosmetic Products Industry Revenue Share (%), by Distribution Channel 2025 & 2033
- Figure 58: Middle East and Africa Organic Personal Care and Cosmetic Products Industry Volume Share (%), by Distribution Channel 2025 & 2033
- Figure 59: Middle East and Africa Organic Personal Care and Cosmetic Products Industry Revenue (billion), by Country 2025 & 2033
- Figure 60: Middle East and Africa Organic Personal Care and Cosmetic Products Industry Volume (K Units), by Country 2025 & 2033
- Figure 61: Middle East and Africa Organic Personal Care and Cosmetic Products Industry Revenue Share (%), by Country 2025 & 2033
- Figure 62: Middle East and Africa Organic Personal Care and Cosmetic Products Industry Volume Share (%), by Country 2025 & 2033
List of Tables
- Table 1: Global Organic Personal Care and Cosmetic Products Industry Revenue billion Forecast, by Product Type 2020 & 2033
- Table 2: Global Organic Personal Care and Cosmetic Products Industry Volume K Units Forecast, by Product Type 2020 & 2033
- Table 3: Global Organic Personal Care and Cosmetic Products Industry Revenue billion Forecast, by Distribution Channel 2020 & 2033
- Table 4: Global Organic Personal Care and Cosmetic Products Industry Volume K Units Forecast, by Distribution Channel 2020 & 2033
- Table 5: Global Organic Personal Care and Cosmetic Products Industry Revenue billion Forecast, by Region 2020 & 2033
- Table 6: Global Organic Personal Care and Cosmetic Products Industry Volume K Units Forecast, by Region 2020 & 2033
- Table 7: Global Organic Personal Care and Cosmetic Products Industry Revenue billion Forecast, by Product Type 2020 & 2033
- Table 8: Global Organic Personal Care and Cosmetic Products Industry Volume K Units Forecast, by Product Type 2020 & 2033
- Table 9: Global Organic Personal Care and Cosmetic Products Industry Revenue billion Forecast, by Distribution Channel 2020 & 2033
- Table 10: Global Organic Personal Care and Cosmetic Products Industry Volume K Units Forecast, by Distribution Channel 2020 & 2033
- Table 11: Global Organic Personal Care and Cosmetic Products Industry Revenue billion Forecast, by Country 2020 & 2033
- Table 12: Global Organic Personal Care and Cosmetic Products Industry Volume K Units Forecast, by Country 2020 & 2033
- Table 13: United States Organic Personal Care and Cosmetic Products Industry Revenue (billion) Forecast, by Application 2020 & 2033
- Table 14: United States Organic Personal Care and Cosmetic Products Industry Volume (K Units) Forecast, by Application 2020 & 2033
- Table 15: Canada Organic Personal Care and Cosmetic Products Industry Revenue (billion) Forecast, by Application 2020 & 2033
- Table 16: Canada Organic Personal Care and Cosmetic Products Industry Volume (K Units) Forecast, by Application 2020 & 2033
- Table 17: Mexico Organic Personal Care and Cosmetic Products Industry Revenue (billion) Forecast, by Application 2020 & 2033
- Table 18: Mexico Organic Personal Care and Cosmetic Products Industry Volume (K Units) Forecast, by Application 2020 & 2033
- Table 19: Rest of North America Organic Personal Care and Cosmetic Products Industry Revenue (billion) Forecast, by Application 2020 & 2033
- Table 20: Rest of North America Organic Personal Care and Cosmetic Products Industry Volume (K Units) Forecast, by Application 2020 & 2033
- Table 21: Global Organic Personal Care and Cosmetic Products Industry Revenue billion Forecast, by Product Type 2020 & 2033
- Table 22: Global Organic Personal Care and Cosmetic Products Industry Volume K Units Forecast, by Product Type 2020 & 2033
- Table 23: Global Organic Personal Care and Cosmetic Products Industry Revenue billion Forecast, by Distribution Channel 2020 & 2033
- Table 24: Global Organic Personal Care and Cosmetic Products Industry Volume K Units Forecast, by Distribution Channel 2020 & 2033
- Table 25: Global Organic Personal Care and Cosmetic Products Industry Revenue billion Forecast, by Country 2020 & 2033
- Table 26: Global Organic Personal Care and Cosmetic Products Industry Volume K Units Forecast, by Country 2020 & 2033
- Table 27: Spain Organic Personal Care and Cosmetic Products Industry Revenue (billion) Forecast, by Application 2020 & 2033
- Table 28: Spain Organic Personal Care and Cosmetic Products Industry Volume (K Units) Forecast, by Application 2020 & 2033
- Table 29: United Kingdom Organic Personal Care and Cosmetic Products Industry Revenue (billion) Forecast, by Application 2020 & 2033
- Table 30: United Kingdom Organic Personal Care and Cosmetic Products Industry Volume (K Units) Forecast, by Application 2020 & 2033
- Table 31: Germany Organic Personal Care and Cosmetic Products Industry Revenue (billion) Forecast, by Application 2020 & 2033
- Table 32: Germany Organic Personal Care and Cosmetic Products Industry Volume (K Units) Forecast, by Application 2020 & 2033
- Table 33: France Organic Personal Care and Cosmetic Products Industry Revenue (billion) Forecast, by Application 2020 & 2033
- Table 34: France Organic Personal Care and Cosmetic Products Industry Volume (K Units) Forecast, by Application 2020 & 2033
- Table 35: Italy Organic Personal Care and Cosmetic Products Industry Revenue (billion) Forecast, by Application 2020 & 2033
- Table 36: Italy Organic Personal Care and Cosmetic Products Industry Volume (K Units) Forecast, by Application 2020 & 2033
- Table 37: Russia Organic Personal Care and Cosmetic Products Industry Revenue (billion) Forecast, by Application 2020 & 2033
- Table 38: Russia Organic Personal Care and Cosmetic Products Industry Volume (K Units) Forecast, by Application 2020 & 2033
- Table 39: Rest of Europe Organic Personal Care and Cosmetic Products Industry Revenue (billion) Forecast, by Application 2020 & 2033
- Table 40: Rest of Europe Organic Personal Care and Cosmetic Products Industry Volume (K Units) Forecast, by Application 2020 & 2033
- Table 41: Global Organic Personal Care and Cosmetic Products Industry Revenue billion Forecast, by Product Type 2020 & 2033
- Table 42: Global Organic Personal Care and Cosmetic Products Industry Volume K Units Forecast, by Product Type 2020 & 2033
- Table 43: Global Organic Personal Care and Cosmetic Products Industry Revenue billion Forecast, by Distribution Channel 2020 & 2033
- Table 44: Global Organic Personal Care and Cosmetic Products Industry Volume K Units Forecast, by Distribution Channel 2020 & 2033
- Table 45: Global Organic Personal Care and Cosmetic Products Industry Revenue billion Forecast, by Country 2020 & 2033
- Table 46: Global Organic Personal Care and Cosmetic Products Industry Volume K Units Forecast, by Country 2020 & 2033
- Table 47: China Organic Personal Care and Cosmetic Products Industry Revenue (billion) Forecast, by Application 2020 & 2033
- Table 48: China Organic Personal Care and Cosmetic Products Industry Volume (K Units) Forecast, by Application 2020 & 2033
- Table 49: Japan Organic Personal Care and Cosmetic Products Industry Revenue (billion) Forecast, by Application 2020 & 2033
- Table 50: Japan Organic Personal Care and Cosmetic Products Industry Volume (K Units) Forecast, by Application 2020 & 2033
- Table 51: India Organic Personal Care and Cosmetic Products Industry Revenue (billion) Forecast, by Application 2020 & 2033
- Table 52: India Organic Personal Care and Cosmetic Products Industry Volume (K Units) Forecast, by Application 2020 & 2033
- Table 53: Australia Organic Personal Care and Cosmetic Products Industry Revenue (billion) Forecast, by Application 2020 & 2033
- Table 54: Australia Organic Personal Care and Cosmetic Products Industry Volume (K Units) Forecast, by Application 2020 & 2033
- Table 55: Rest of Asia Pacific Organic Personal Care and Cosmetic Products Industry Revenue (billion) Forecast, by Application 2020 & 2033
- Table 56: Rest of Asia Pacific Organic Personal Care and Cosmetic Products Industry Volume (K Units) Forecast, by Application 2020 & 2033
- Table 57: Global Organic Personal Care and Cosmetic Products Industry Revenue billion Forecast, by Product Type 2020 & 2033
- Table 58: Global Organic Personal Care and Cosmetic Products Industry Volume K Units Forecast, by Product Type 2020 & 2033
- Table 59: Global Organic Personal Care and Cosmetic Products Industry Revenue billion Forecast, by Distribution Channel 2020 & 2033
- Table 60: Global Organic Personal Care and Cosmetic Products Industry Volume K Units Forecast, by Distribution Channel 2020 & 2033
- Table 61: Global Organic Personal Care and Cosmetic Products Industry Revenue billion Forecast, by Country 2020 & 2033
- Table 62: Global Organic Personal Care and Cosmetic Products Industry Volume K Units Forecast, by Country 2020 & 2033
- Table 63: Brazil Organic Personal Care and Cosmetic Products Industry Revenue (billion) Forecast, by Application 2020 & 2033
- Table 64: Brazil Organic Personal Care and Cosmetic Products Industry Volume (K Units) Forecast, by Application 2020 & 2033
- Table 65: Argentina Organic Personal Care and Cosmetic Products Industry Revenue (billion) Forecast, by Application 2020 & 2033
- Table 66: Argentina Organic Personal Care and Cosmetic Products Industry Volume (K Units) Forecast, by Application 2020 & 2033
- Table 67: Rest of South America Organic Personal Care and Cosmetic Products Industry Revenue (billion) Forecast, by Application 2020 & 2033
- Table 68: Rest of South America Organic Personal Care and Cosmetic Products Industry Volume (K Units) Forecast, by Application 2020 & 2033
- Table 69: Global Organic Personal Care and Cosmetic Products Industry Revenue billion Forecast, by Product Type 2020 & 2033
- Table 70: Global Organic Personal Care and Cosmetic Products Industry Volume K Units Forecast, by Product Type 2020 & 2033
- Table 71: Global Organic Personal Care and Cosmetic Products Industry Revenue billion Forecast, by Distribution Channel 2020 & 2033
- Table 72: Global Organic Personal Care and Cosmetic Products Industry Volume K Units Forecast, by Distribution Channel 2020 & 2033
- Table 73: Global Organic Personal Care and Cosmetic Products Industry Revenue billion Forecast, by Country 2020 & 2033
- Table 74: Global Organic Personal Care and Cosmetic Products Industry Volume K Units Forecast, by Country 2020 & 2033
- Table 75: South Africa Organic Personal Care and Cosmetic Products Industry Revenue (billion) Forecast, by Application 2020 & 2033
- Table 76: South Africa Organic Personal Care and Cosmetic Products Industry Volume (K Units) Forecast, by Application 2020 & 2033
- Table 77: Saudi Arabia Organic Personal Care and Cosmetic Products Industry Revenue (billion) Forecast, by Application 2020 & 2033
- Table 78: Saudi Arabia Organic Personal Care and Cosmetic Products Industry Volume (K Units) Forecast, by Application 2020 & 2033
- Table 79: Rest of Middle East and Africa Organic Personal Care and Cosmetic Products Industry Revenue (billion) Forecast, by Application 2020 & 2033
- Table 80: Rest of Middle East and Africa Organic Personal Care and Cosmetic Products Industry Volume (K Units) Forecast, by Application 2020 & 2033
Frequently Asked Questions
1. What is the projected Compound Annual Growth Rate (CAGR) of the Organic Personal Care and Cosmetic Products Industry?
The projected CAGR is approximately 8.4%.
2. Which companies are prominent players in the Organic Personal Care and Cosmetic Products Industry?
Key companies in the market include Eminence Organic Skin Care, Scout Organic Active Beauty, FIT & GLOW HEALTH CARE PVT LTD, Bali Secrets Ltd, L'Oreal SA, Dr Organic Ltd *List Not Exhaustive, Hain Celestial Group, Bio Veda Action Research Pvt Ltd.
3. What are the main segments of the Organic Personal Care and Cosmetic Products Industry?
The market segments include Product Type, Distribution Channel.
4. Can you provide details about the market size?
The market size is estimated to be USD 34.2 billion as of 2022.
5. What are some drivers contributing to market growth?
Increasing Demand for Natural/Organic Products; Increased Focus on Facial Care Regimes.
6. What are the notable trends driving market growth?
Face Care Sector Dominates the Market Studied.
7. Are there any restraints impacting market growth?
Presence of Counterfeit Products Restraints Growth.
8. Can you provide examples of recent developments in the market?
N/A
9. What pricing options are available for accessing the report?
Pricing options include single-user, multi-user, and enterprise licenses priced at USD 4750, USD 5250, and USD 8750 respectively.
10. Is the market size provided in terms of value or volume?
The market size is provided in terms of value, measured in billion and volume, measured in K Units.
11. Are there any specific market keywords associated with the report?
Yes, the market keyword associated with the report is "Organic Personal Care and Cosmetic Products Industry," which aids in identifying and referencing the specific market segment covered.
12. How do I determine which pricing option suits my needs best?
The pricing options vary based on user requirements and access needs. Individual users may opt for single-user licenses, while businesses requiring broader access may choose multi-user or enterprise licenses for cost-effective access to the report.
13. Are there any additional resources or data provided in the Organic Personal Care and Cosmetic Products Industry report?
While the report offers comprehensive insights, it's advisable to review the specific contents or supplementary materials provided to ascertain if additional resources or data are available.
14. How can I stay updated on further developments or reports in the Organic Personal Care and Cosmetic Products Industry?
To stay informed about further developments, trends, and reports in the Organic Personal Care and Cosmetic Products Industry, consider subscribing to industry newsletters, following relevant companies and organizations, or regularly checking reputable industry news sources and publications.
Methodology
Step 1 - Identification of Relevant Samples Size from Population Database


Step 2 - Approaches for Defining Global Market Size (Value, Volume* & Price*)

Note*: In applicable scenarios
Step 3 - Data Sources
Primary Research
- Web Analytics
- Survey Reports
- Research Institute
- Latest Research Reports
- Opinion Leaders
Secondary Research
- Annual Reports
- White Paper
- Latest Press Release
- Industry Association
- Paid Database
- Investor Presentations

Step 4 - Data Triangulation
Involves using different sources of information in order to increase the validity of a study
These sources are likely to be stakeholders in a program - participants, other researchers, program staff, other community members, and so on.
Then we put all data in single framework & apply various statistical tools to find out the dynamic on the market.
During the analysis stage, feedback from the stakeholder groups would be compared to determine areas of agreement as well as areas of divergence