

Key Insights
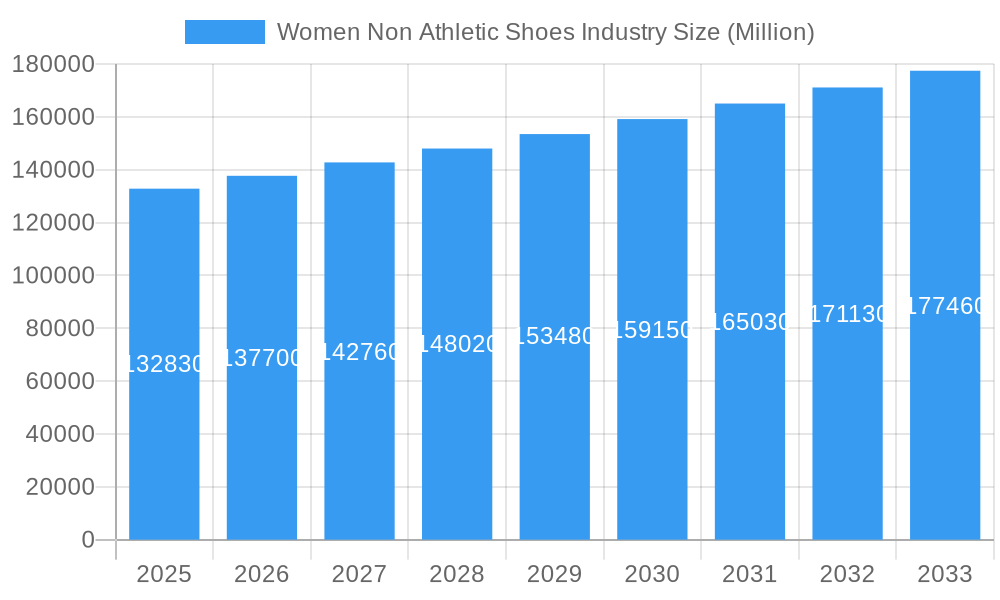
The global women's non-athletic footwear market, valued at $132.83 billion in 2025, is projected to experience steady growth, exhibiting a Compound Annual Growth Rate (CAGR) of 3.68% from 2025 to 2033. This growth is driven by several key factors. Increasing disposable incomes, particularly in developing economies, fuel demand for diverse and fashionable footwear. The rise of e-commerce platforms has significantly expanded market access, offering consumers a wider selection and convenience. Furthermore, evolving fashion trends and the influence of social media on consumer preferences contribute to consistent product innovation and demand for new styles. The market is segmented by type (boots and shoes, heels and pumps, flats, sandals, other footwear types), distribution channel (online, offline), and category (mass, premium). Premium brands like Chanel, Prada, and LVMH cater to high-end consumers, while mass-market brands like Aldo and Bata target a broader audience. Regional variations exist, with North America and Europe currently holding significant market shares, though the Asia-Pacific region shows strong growth potential driven by increasing urbanization and rising middle-class populations.
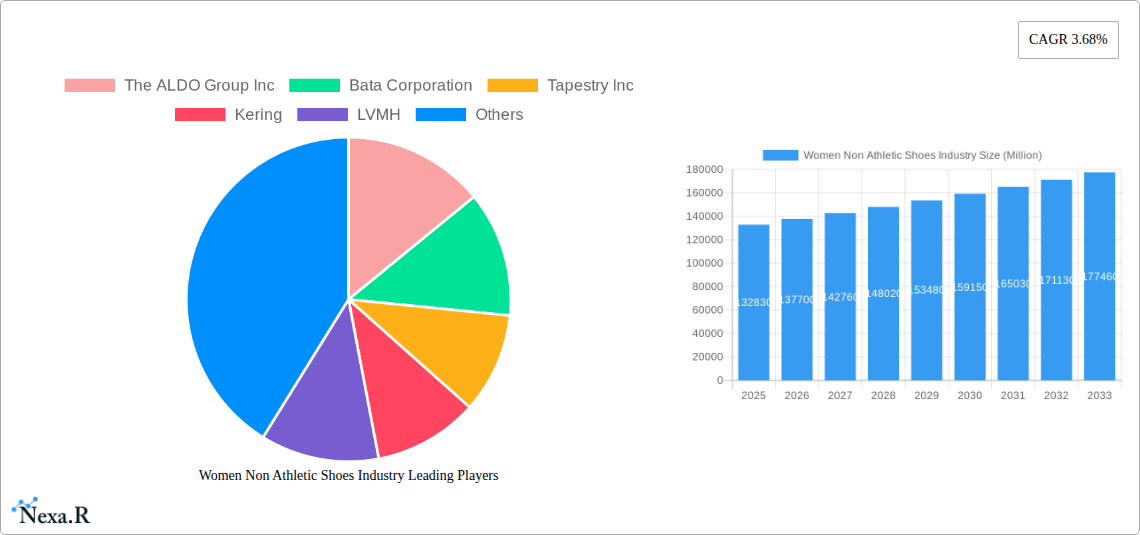
Women Non Athletic Shoes Industry Market Size (In Billion)
The market's growth trajectory, however, faces certain challenges. Fluctuations in raw material prices and global economic uncertainties can impact production costs and consumer spending. Increasing competition among brands requires continuous innovation and effective marketing strategies to maintain market share. Furthermore, concerns regarding sustainability and ethical sourcing are gaining prominence, pushing companies to adopt more responsible manufacturing practices. Despite these challenges, the long-term outlook for the women's non-athletic footwear market remains positive, fueled by consistent consumer demand for stylish and comfortable footwear across various segments and geographical regions. The market's segmentation provides opportunities for targeted marketing and product development, enabling brands to cater to specific consumer needs and preferences.
Women Non Athletic Shoes Industry Company Market Share
Women's Non-Athletic Shoes Market Report: 2019-2033
This comprehensive report provides a detailed analysis of the global women's non-athletic shoes market, encompassing market dynamics, growth trends, regional analysis, product landscape, and key players. The study period covers 2019-2033, with 2025 as the base year and a forecast period of 2025-2033. The report offers valuable insights for industry professionals, investors, and businesses seeking to understand and capitalize on opportunities within this dynamic market segment. The market size is valued at XX Million Units in 2025 and is projected to reach XX Million Units by 2033.
Women's Non-Athletic Shoes Industry Market Dynamics & Structure
The women's non-athletic footwear market is characterized by a moderately concentrated landscape, with a few major players holding significant market share, alongside numerous smaller brands and niche players. Technological innovation, particularly in materials science and manufacturing processes, plays a crucial role. Regulatory frameworks concerning labor practices, material sourcing, and environmental sustainability are increasingly influencing market dynamics. The market witnesses considerable competition from substitutes, including athletic shoes worn casually and other forms of footwear. The end-user demographic is diverse, spanning various age groups, income levels, and lifestyle preferences. Mergers and acquisitions (M&A) activity are prevalent, reflecting strategic efforts to expand market reach, enhance supply chains, and gain access to innovative technologies.
- Market Concentration: Moderately concentrated, with top 5 players holding approximately xx% market share in 2025.
- Technological Innovation: Focus on sustainable materials, 3D printing, and improved comfort features.
- Regulatory Landscape: Growing emphasis on ethical sourcing, fair labor practices, and environmental regulations.
- Competitive Substitutes: Athletic footwear, sandals, and other casual footwear categories.
- End-User Demographics: Highly diverse, catering to various age groups, income levels, and fashion preferences.
- M&A Activity: Significant activity observed in recent years, with xx major deals recorded between 2019-2024. (e.g., CHANEL's acquisition of Ballin).
Women's Non-Athletic Shoes Industry Growth Trends & Insights
The global women's non-athletic shoes market exhibits a steady growth trajectory, driven by factors such as rising disposable incomes in developing economies, evolving fashion trends, and increasing demand for stylish and comfortable footwear. The market is witnessing a shift towards online purchasing, influenced by the increasing penetration of e-commerce and the convenience it offers. Technological disruptions, such as the integration of smart features in footwear and advancements in manufacturing techniques, are reshaping the industry. Consumer behavior is evolving, with a growing emphasis on sustainability, ethical sourcing, and personalized experiences. The market experienced a CAGR of xx% during the historical period (2019-2024) and is projected to achieve a CAGR of xx% during the forecast period (2025-2033). Market penetration in key regions is steadily increasing, reflecting the growing adoption of non-athletic footwear across diverse demographics.
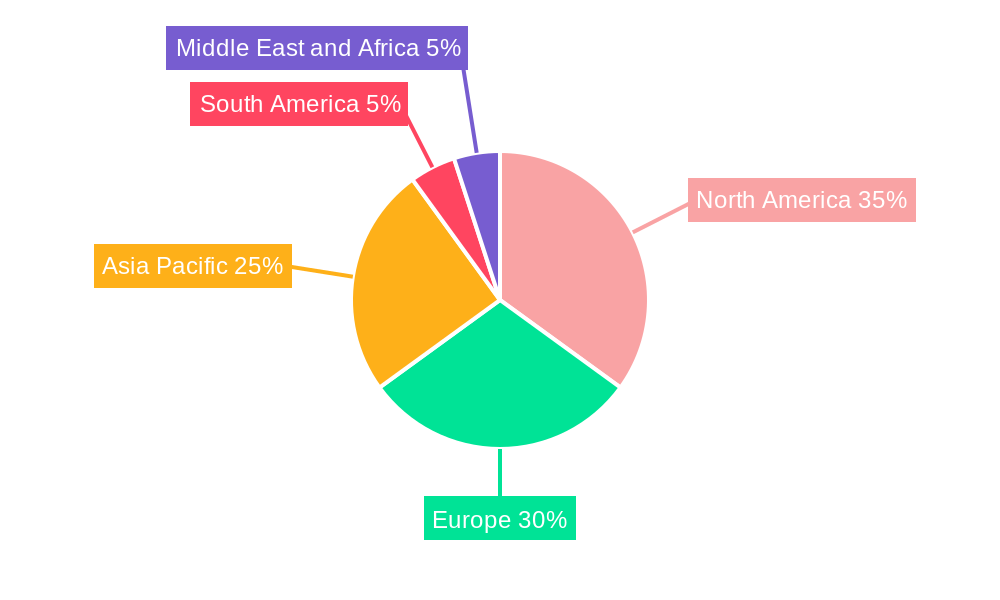
Dominant Regions, Countries, or Segments in Women's Non-Athletic Shoes Industry
North America and Europe currently represent the dominant regions for the women's non-athletic shoes market, driven by high consumer spending, established retail infrastructure, and strong brand presence. Within the segments, Heels and Pumps, and Boots and Shoes are the leading categories, followed by Flats and Sandals. The Premium category exhibits higher growth potential compared to the Mass segment due to consumer preferences for luxury and higher-quality materials. Online distribution channels are witnessing rapid growth, propelled by increasing e-commerce penetration.
- Leading Region: North America
- Leading Country: United States
- Leading Segment (By Type): Heels and Pumps, Boots and Shoes
- Leading Segment (By Distribution Channel): Offline (Currently dominant, but Online is rapidly growing)
- Leading Segment (By Category): Premium
- Key Drivers: Strong consumer spending, established retail infrastructure, fashion trends, and brand loyalty.
Women's Non-Athletic Shoes Industry Product Landscape
The women's non-athletic shoe market showcases a diverse range of products, incorporating innovative materials, designs, and technologies. Brands are constantly introducing new styles, colors, and designs to cater to evolving fashion trends. Sustainable materials such as recycled fabrics and plant-based leathers are gaining traction. Technological advancements include improved comfort features, enhanced durability, and smart capabilities. Unique selling propositions often center around brand reputation, craftsmanship, design aesthetics, and ethical sourcing practices.
Key Drivers, Barriers & Challenges in Women's Non-Athletic Shoes Industry
Key Drivers: Rising disposable incomes, fashion trends, increasing demand for comfort, e-commerce growth, and technological advancements.
Challenges: Fluctuating raw material prices, intense competition, increasing labor costs, counterfeiting, and the need to comply with stringent environmental regulations. Supply chain disruptions are projected to impact the market by xx% in 2026.
Emerging Opportunities in Women's Non-Athletic Shoes Industry
Emerging opportunities lie in the expansion of sustainable and ethically sourced products, personalized footwear, the integration of technology (e.g., smart features), and tapping into niche markets (e.g., plus-size footwear). The increasing demand for customized designs and personalization presents a significant opportunity for brands to offer unique and tailored products to consumers.
Growth Accelerators in the Women's Non-Athletic Shoes Industry
Strategic partnerships, technological advancements leading to improved comfort and durability, market expansion into developing economies, and the rising popularity of e-commerce all significantly contribute to long-term market expansion. Focusing on sustainable and ethical manufacturing practices will become increasingly critical for securing future market share.
Key Players Shaping the Women's Non-Athletic Shoes Industry Market
- The ALDO Group Inc
- Bata Corporation
- Tapestry Inc
- Kering
- LVMH
- Capri Holdings
- Prada SpA
- LIR SRL
- CHANEL
- VF Corporation
Notable Milestones in Women's Non-Athletic Shoes Industry Sector
- June 2021: Louis Vuitton launched the LV Squad sneaker and LV Sunset mule campaign featuring Emma Chamberlain and Charli D'Amelio.
- June 2021: Prada SPA and Ermenegildo Zegna acquired a stake in Filati Biagioli Modesto SPA, aiming to control the supply chain.
- October 2020: CHANEL acquired a majority stake in Italian Shoemaker Ballin, strengthening its supply chain.
In-Depth Women's Non-Athletic Shoes Industry Market Outlook
The women's non-athletic shoes market is poised for continued growth, driven by robust demand in emerging economies, increasing online sales, and the ongoing innovation in materials and design. Strategic investments in sustainable practices, personalized offerings, and technological integrations will be crucial for brands to capture market share and thrive in this dynamic landscape. The market is projected to experience significant expansion, presenting numerous opportunities for both established and emerging players.
Women Non Athletic Shoes Industry Segmentation
-
1. Type
- 1.1. Boots and Shoes
- 1.2. Heels and Pumps
- 1.3. Flats
- 1.4. Sandals
- 1.5. Other Footwear Types
-
2. Distribution Channel
- 2.1. Online
- 2.2. Offline
-
3. Category
- 3.1. Mass
- 3.2. Premium
Women Non Athletic Shoes Industry Segmentation By Geography
-
1. North America
- 1.1. United States
- 1.2. Canada
- 1.3. Rest of North America
-
2. Europe
- 2.1. Spain
- 2.2. United Kingdom
- 2.3. Germany
- 2.4. France
- 2.5. Italy
- 2.6. Rest of Europe
-
3. Asia Pacific
- 3.1. China
- 3.2. Japan
- 3.3. India
- 3.4. Australia
- 3.5. Rest of Asia Pacific
-
4. South America
- 4.1. Brazil
- 4.2. Argentina
- 4.3. Rest of South America
-
5. Middle East and Africa
- 5.1. South Africa
- 5.2. Saudi Arabia
- 5.3. Rest of Middle East and Africa
Women Non Athletic Shoes Industry Regional Market Share
Geographic Coverage of Women Non Athletic Shoes Industry
Women Non Athletic Shoes Industry REPORT HIGHLIGHTS
| Aspects | Details |
|---|---|
| Study Period | 2020-2034 |
| Base Year | 2025 |
| Estimated Year | 2026 |
| Forecast Period | 2026-2034 |
| Historical Period | 2020-2025 |
| Growth Rate | CAGR of 3.68% from 2020-2034 |
| Segmentation |
|
Table of Contents
- 1. Introduction
- 1.1. Research Scope
- 1.2. Market Segmentation
- 1.3. Research Objective
- 1.4. Definitions and Assumptions
- 2. Executive Summary
- 2.1. Market Snapshot
- 3. Market Dynamics
- 3.1. Market Drivers
- 3.2. Market Restrains
- 3.3. Market Trends
- 3.4. Market Opportunities
- 4. Market Factor Analysis
- 4.1. Porters Five Forces
- 4.1.1. Bargaining Power of Suppliers
- 4.1.2. Bargaining Power of Buyers
- 4.1.3. Threat of New Entrants
- 4.1.4. Threat of Substitutes
- 4.1.5. Competitive Rivalry
- 4.2. PESTEL analysis
- 4.3. BCG Analysis
- 4.3.1. Stars (High Growth, High Market Share)
- 4.3.2. Cash Cows (Low Growth, High Market Share)
- 4.3.3. Question Mark (High Growth, Low Market Share)
- 4.3.4. Dogs (Low Growth, Low Market Share)
- 4.4. Ansoff Matrix Analysis
- 4.5. Supply Chain Analysis
- 4.6. Regulatory Landscape
- 4.7. Current Market Potential and Opportunity Assessment (TAM–SAM–SOM Framework)
- 4.8. NRP Analyst Note
- 4.1. Porters Five Forces
- 5. Market Analysis, Insights and Forecast 2021-2033
- 5.1. Market Analysis, Insights and Forecast - by Type
- 5.1.1. Boots and Shoes
- 5.1.2. Heels and Pumps
- 5.1.3. Flats
- 5.1.4. Sandals
- 5.1.5. Other Footwear Types
- 5.2. Market Analysis, Insights and Forecast - by Distribution Channel
- 5.2.1. Online
- 5.2.2. Offline
- 5.3. Market Analysis, Insights and Forecast - by Category
- 5.3.1. Mass
- 5.3.2. Premium
- 5.4. Market Analysis, Insights and Forecast - by Region
- 5.4.1. North America
- 5.4.2. Europe
- 5.4.3. Asia Pacific
- 5.4.4. South America
- 5.4.5. Middle East and Africa
- 5.1. Market Analysis, Insights and Forecast - by Type
- 6. Global Women Non Athletic Shoes Industry Analysis, Insights and Forecast, 2021-2033
- 6.1. Market Analysis, Insights and Forecast - by Type
- 6.1.1. Boots and Shoes
- 6.1.2. Heels and Pumps
- 6.1.3. Flats
- 6.1.4. Sandals
- 6.1.5. Other Footwear Types
- 6.2. Market Analysis, Insights and Forecast - by Distribution Channel
- 6.2.1. Online
- 6.2.2. Offline
- 6.3. Market Analysis, Insights and Forecast - by Category
- 6.3.1. Mass
- 6.3.2. Premium
- 6.1. Market Analysis, Insights and Forecast - by Type
- 7. North America Women Non Athletic Shoes Industry Analysis, Insights and Forecast, 2020-2032
- 7.1. Market Analysis, Insights and Forecast - by Type
- 7.1.1. Boots and Shoes
- 7.1.2. Heels and Pumps
- 7.1.3. Flats
- 7.1.4. Sandals
- 7.1.5. Other Footwear Types
- 7.2. Market Analysis, Insights and Forecast - by Distribution Channel
- 7.2.1. Online
- 7.2.2. Offline
- 7.3. Market Analysis, Insights and Forecast - by Category
- 7.3.1. Mass
- 7.3.2. Premium
- 7.1. Market Analysis, Insights and Forecast - by Type
- 8. Europe Women Non Athletic Shoes Industry Analysis, Insights and Forecast, 2020-2032
- 8.1. Market Analysis, Insights and Forecast - by Type
- 8.1.1. Boots and Shoes
- 8.1.2. Heels and Pumps
- 8.1.3. Flats
- 8.1.4. Sandals
- 8.1.5. Other Footwear Types
- 8.2. Market Analysis, Insights and Forecast - by Distribution Channel
- 8.2.1. Online
- 8.2.2. Offline
- 8.3. Market Analysis, Insights and Forecast - by Category
- 8.3.1. Mass
- 8.3.2. Premium
- 8.1. Market Analysis, Insights and Forecast - by Type
- 9. Asia Pacific Women Non Athletic Shoes Industry Analysis, Insights and Forecast, 2020-2032
- 9.1. Market Analysis, Insights and Forecast - by Type
- 9.1.1. Boots and Shoes
- 9.1.2. Heels and Pumps
- 9.1.3. Flats
- 9.1.4. Sandals
- 9.1.5. Other Footwear Types
- 9.2. Market Analysis, Insights and Forecast - by Distribution Channel
- 9.2.1. Online
- 9.2.2. Offline
- 9.3. Market Analysis, Insights and Forecast - by Category
- 9.3.1. Mass
- 9.3.2. Premium
- 9.1. Market Analysis, Insights and Forecast - by Type
- 10. South America Women Non Athletic Shoes Industry Analysis, Insights and Forecast, 2020-2032
- 10.1. Market Analysis, Insights and Forecast - by Type
- 10.1.1. Boots and Shoes
- 10.1.2. Heels and Pumps
- 10.1.3. Flats
- 10.1.4. Sandals
- 10.1.5. Other Footwear Types
- 10.2. Market Analysis, Insights and Forecast - by Distribution Channel
- 10.2.1. Online
- 10.2.2. Offline
- 10.3. Market Analysis, Insights and Forecast - by Category
- 10.3.1. Mass
- 10.3.2. Premium
- 10.1. Market Analysis, Insights and Forecast - by Type
- 11. Middle East and Africa Women Non Athletic Shoes Industry Analysis, Insights and Forecast, 2020-2032
- 11.1. Market Analysis, Insights and Forecast - by Type
- 11.1.1. Boots and Shoes
- 11.1.2. Heels and Pumps
- 11.1.3. Flats
- 11.1.4. Sandals
- 11.1.5. Other Footwear Types
- 11.2. Market Analysis, Insights and Forecast - by Distribution Channel
- 11.2.1. Online
- 11.2.2. Offline
- 11.3. Market Analysis, Insights and Forecast - by Category
- 11.3.1. Mass
- 11.3.2. Premium
- 11.1. Market Analysis, Insights and Forecast - by Type
- 12. Competitive Analysis
- 12.1. Company Profiles
- 12.1.1 The ALDO Group Inc
- 12.1.1.1. Company Overview
- 12.1.1.2. Products
- 12.1.1.3. Company Financials
- 12.1.1.4. SWOT Analysis
- 12.1.2 Bata Corporation
- 12.1.2.1. Company Overview
- 12.1.2.2. Products
- 12.1.2.3. Company Financials
- 12.1.2.4. SWOT Analysis
- 12.1.3 Tapestry Inc
- 12.1.3.1. Company Overview
- 12.1.3.2. Products
- 12.1.3.3. Company Financials
- 12.1.3.4. SWOT Analysis
- 12.1.4 Kering
- 12.1.4.1. Company Overview
- 12.1.4.2. Products
- 12.1.4.3. Company Financials
- 12.1.4.4. SWOT Analysis
- 12.1.5 LVMH
- 12.1.5.1. Company Overview
- 12.1.5.2. Products
- 12.1.5.3. Company Financials
- 12.1.5.4. SWOT Analysis
- 12.1.6 Capri Holdings
- 12.1.6.1. Company Overview
- 12.1.6.2. Products
- 12.1.6.3. Company Financials
- 12.1.6.4. SWOT Analysis
- 12.1.7 Prada SpA
- 12.1.7.1. Company Overview
- 12.1.7.2. Products
- 12.1.7.3. Company Financials
- 12.1.7.4. SWOT Analysis
- 12.1.8 LIR SRL
- 12.1.8.1. Company Overview
- 12.1.8.2. Products
- 12.1.8.3. Company Financials
- 12.1.8.4. SWOT Analysis
- 12.1.9 CHANEL
- 12.1.9.1. Company Overview
- 12.1.9.2. Products
- 12.1.9.3. Company Financials
- 12.1.9.4. SWOT Analysis
- 12.1.10 VF Corporation*List Not Exhaustive
- 12.1.10.1. Company Overview
- 12.1.10.2. Products
- 12.1.10.3. Company Financials
- 12.1.10.4. SWOT Analysis
- 12.1.1 The ALDO Group Inc
- 12.2. Market Entropy
- 12.2.1 Company's Key Areas Served
- 12.2.2 Recent Developments
- 12.3. Company Market Share Analysis 2025
- 12.3.1 Top 5 Companies Market Share Analysis
- 12.3.2 Top 3 Companies Market Share Analysis
- 12.4. List of Potential Customers
- 13. Research Methodology
List of Figures
- Figure 1: Global Women Non Athletic Shoes Industry Revenue Breakdown (Million, %) by Region 2025 & 2033
- Figure 2: Global Women Non Athletic Shoes Industry Volume Breakdown (K Units, %) by Region 2025 & 2033
- Figure 3: North America Women Non Athletic Shoes Industry Revenue (Million), by Type 2025 & 2033
- Figure 4: North America Women Non Athletic Shoes Industry Volume (K Units), by Type 2025 & 2033
- Figure 5: North America Women Non Athletic Shoes Industry Revenue Share (%), by Type 2025 & 2033
- Figure 6: North America Women Non Athletic Shoes Industry Volume Share (%), by Type 2025 & 2033
- Figure 7: North America Women Non Athletic Shoes Industry Revenue (Million), by Distribution Channel 2025 & 2033
- Figure 8: North America Women Non Athletic Shoes Industry Volume (K Units), by Distribution Channel 2025 & 2033
- Figure 9: North America Women Non Athletic Shoes Industry Revenue Share (%), by Distribution Channel 2025 & 2033
- Figure 10: North America Women Non Athletic Shoes Industry Volume Share (%), by Distribution Channel 2025 & 2033
- Figure 11: North America Women Non Athletic Shoes Industry Revenue (Million), by Category 2025 & 2033
- Figure 12: North America Women Non Athletic Shoes Industry Volume (K Units), by Category 2025 & 2033
- Figure 13: North America Women Non Athletic Shoes Industry Revenue Share (%), by Category 2025 & 2033
- Figure 14: North America Women Non Athletic Shoes Industry Volume Share (%), by Category 2025 & 2033
- Figure 15: North America Women Non Athletic Shoes Industry Revenue (Million), by Country 2025 & 2033
- Figure 16: North America Women Non Athletic Shoes Industry Volume (K Units), by Country 2025 & 2033
- Figure 17: North America Women Non Athletic Shoes Industry Revenue Share (%), by Country 2025 & 2033
- Figure 18: North America Women Non Athletic Shoes Industry Volume Share (%), by Country 2025 & 2033
- Figure 19: Europe Women Non Athletic Shoes Industry Revenue (Million), by Type 2025 & 2033
- Figure 20: Europe Women Non Athletic Shoes Industry Volume (K Units), by Type 2025 & 2033
- Figure 21: Europe Women Non Athletic Shoes Industry Revenue Share (%), by Type 2025 & 2033
- Figure 22: Europe Women Non Athletic Shoes Industry Volume Share (%), by Type 2025 & 2033
- Figure 23: Europe Women Non Athletic Shoes Industry Revenue (Million), by Distribution Channel 2025 & 2033
- Figure 24: Europe Women Non Athletic Shoes Industry Volume (K Units), by Distribution Channel 2025 & 2033
- Figure 25: Europe Women Non Athletic Shoes Industry Revenue Share (%), by Distribution Channel 2025 & 2033
- Figure 26: Europe Women Non Athletic Shoes Industry Volume Share (%), by Distribution Channel 2025 & 2033
- Figure 27: Europe Women Non Athletic Shoes Industry Revenue (Million), by Category 2025 & 2033
- Figure 28: Europe Women Non Athletic Shoes Industry Volume (K Units), by Category 2025 & 2033
- Figure 29: Europe Women Non Athletic Shoes Industry Revenue Share (%), by Category 2025 & 2033
- Figure 30: Europe Women Non Athletic Shoes Industry Volume Share (%), by Category 2025 & 2033
- Figure 31: Europe Women Non Athletic Shoes Industry Revenue (Million), by Country 2025 & 2033
- Figure 32: Europe Women Non Athletic Shoes Industry Volume (K Units), by Country 2025 & 2033
- Figure 33: Europe Women Non Athletic Shoes Industry Revenue Share (%), by Country 2025 & 2033
- Figure 34: Europe Women Non Athletic Shoes Industry Volume Share (%), by Country 2025 & 2033
- Figure 35: Asia Pacific Women Non Athletic Shoes Industry Revenue (Million), by Type 2025 & 2033
- Figure 36: Asia Pacific Women Non Athletic Shoes Industry Volume (K Units), by Type 2025 & 2033
- Figure 37: Asia Pacific Women Non Athletic Shoes Industry Revenue Share (%), by Type 2025 & 2033
- Figure 38: Asia Pacific Women Non Athletic Shoes Industry Volume Share (%), by Type 2025 & 2033
- Figure 39: Asia Pacific Women Non Athletic Shoes Industry Revenue (Million), by Distribution Channel 2025 & 2033
- Figure 40: Asia Pacific Women Non Athletic Shoes Industry Volume (K Units), by Distribution Channel 2025 & 2033
- Figure 41: Asia Pacific Women Non Athletic Shoes Industry Revenue Share (%), by Distribution Channel 2025 & 2033
- Figure 42: Asia Pacific Women Non Athletic Shoes Industry Volume Share (%), by Distribution Channel 2025 & 2033
- Figure 43: Asia Pacific Women Non Athletic Shoes Industry Revenue (Million), by Category 2025 & 2033
- Figure 44: Asia Pacific Women Non Athletic Shoes Industry Volume (K Units), by Category 2025 & 2033
- Figure 45: Asia Pacific Women Non Athletic Shoes Industry Revenue Share (%), by Category 2025 & 2033
- Figure 46: Asia Pacific Women Non Athletic Shoes Industry Volume Share (%), by Category 2025 & 2033
- Figure 47: Asia Pacific Women Non Athletic Shoes Industry Revenue (Million), by Country 2025 & 2033
- Figure 48: Asia Pacific Women Non Athletic Shoes Industry Volume (K Units), by Country 2025 & 2033
- Figure 49: Asia Pacific Women Non Athletic Shoes Industry Revenue Share (%), by Country 2025 & 2033
- Figure 50: Asia Pacific Women Non Athletic Shoes Industry Volume Share (%), by Country 2025 & 2033
- Figure 51: South America Women Non Athletic Shoes Industry Revenue (Million), by Type 2025 & 2033
- Figure 52: South America Women Non Athletic Shoes Industry Volume (K Units), by Type 2025 & 2033
- Figure 53: South America Women Non Athletic Shoes Industry Revenue Share (%), by Type 2025 & 2033
- Figure 54: South America Women Non Athletic Shoes Industry Volume Share (%), by Type 2025 & 2033
- Figure 55: South America Women Non Athletic Shoes Industry Revenue (Million), by Distribution Channel 2025 & 2033
- Figure 56: South America Women Non Athletic Shoes Industry Volume (K Units), by Distribution Channel 2025 & 2033
- Figure 57: South America Women Non Athletic Shoes Industry Revenue Share (%), by Distribution Channel 2025 & 2033
- Figure 58: South America Women Non Athletic Shoes Industry Volume Share (%), by Distribution Channel 2025 & 2033
- Figure 59: South America Women Non Athletic Shoes Industry Revenue (Million), by Category 2025 & 2033
- Figure 60: South America Women Non Athletic Shoes Industry Volume (K Units), by Category 2025 & 2033
- Figure 61: South America Women Non Athletic Shoes Industry Revenue Share (%), by Category 2025 & 2033
- Figure 62: South America Women Non Athletic Shoes Industry Volume Share (%), by Category 2025 & 2033
- Figure 63: South America Women Non Athletic Shoes Industry Revenue (Million), by Country 2025 & 2033
- Figure 64: South America Women Non Athletic Shoes Industry Volume (K Units), by Country 2025 & 2033
- Figure 65: South America Women Non Athletic Shoes Industry Revenue Share (%), by Country 2025 & 2033
- Figure 66: South America Women Non Athletic Shoes Industry Volume Share (%), by Country 2025 & 2033
- Figure 67: Middle East and Africa Women Non Athletic Shoes Industry Revenue (Million), by Type 2025 & 2033
- Figure 68: Middle East and Africa Women Non Athletic Shoes Industry Volume (K Units), by Type 2025 & 2033
- Figure 69: Middle East and Africa Women Non Athletic Shoes Industry Revenue Share (%), by Type 2025 & 2033
- Figure 70: Middle East and Africa Women Non Athletic Shoes Industry Volume Share (%), by Type 2025 & 2033
- Figure 71: Middle East and Africa Women Non Athletic Shoes Industry Revenue (Million), by Distribution Channel 2025 & 2033
- Figure 72: Middle East and Africa Women Non Athletic Shoes Industry Volume (K Units), by Distribution Channel 2025 & 2033
- Figure 73: Middle East and Africa Women Non Athletic Shoes Industry Revenue Share (%), by Distribution Channel 2025 & 2033
- Figure 74: Middle East and Africa Women Non Athletic Shoes Industry Volume Share (%), by Distribution Channel 2025 & 2033
- Figure 75: Middle East and Africa Women Non Athletic Shoes Industry Revenue (Million), by Category 2025 & 2033
- Figure 76: Middle East and Africa Women Non Athletic Shoes Industry Volume (K Units), by Category 2025 & 2033
- Figure 77: Middle East and Africa Women Non Athletic Shoes Industry Revenue Share (%), by Category 2025 & 2033
- Figure 78: Middle East and Africa Women Non Athletic Shoes Industry Volume Share (%), by Category 2025 & 2033
- Figure 79: Middle East and Africa Women Non Athletic Shoes Industry Revenue (Million), by Country 2025 & 2033
- Figure 80: Middle East and Africa Women Non Athletic Shoes Industry Volume (K Units), by Country 2025 & 2033
- Figure 81: Middle East and Africa Women Non Athletic Shoes Industry Revenue Share (%), by Country 2025 & 2033
- Figure 82: Middle East and Africa Women Non Athletic Shoes Industry Volume Share (%), by Country 2025 & 2033
List of Tables
- Table 1: Global Women Non Athletic Shoes Industry Revenue Million Forecast, by Type 2020 & 2033
- Table 2: Global Women Non Athletic Shoes Industry Volume K Units Forecast, by Type 2020 & 2033
- Table 3: Global Women Non Athletic Shoes Industry Revenue Million Forecast, by Distribution Channel 2020 & 2033
- Table 4: Global Women Non Athletic Shoes Industry Volume K Units Forecast, by Distribution Channel 2020 & 2033
- Table 5: Global Women Non Athletic Shoes Industry Revenue Million Forecast, by Category 2020 & 2033
- Table 6: Global Women Non Athletic Shoes Industry Volume K Units Forecast, by Category 2020 & 2033
- Table 7: Global Women Non Athletic Shoes Industry Revenue Million Forecast, by Region 2020 & 2033
- Table 8: Global Women Non Athletic Shoes Industry Volume K Units Forecast, by Region 2020 & 2033
- Table 9: Global Women Non Athletic Shoes Industry Revenue Million Forecast, by Type 2020 & 2033
- Table 10: Global Women Non Athletic Shoes Industry Volume K Units Forecast, by Type 2020 & 2033
- Table 11: Global Women Non Athletic Shoes Industry Revenue Million Forecast, by Distribution Channel 2020 & 2033
- Table 12: Global Women Non Athletic Shoes Industry Volume K Units Forecast, by Distribution Channel 2020 & 2033
- Table 13: Global Women Non Athletic Shoes Industry Revenue Million Forecast, by Category 2020 & 2033
- Table 14: Global Women Non Athletic Shoes Industry Volume K Units Forecast, by Category 2020 & 2033
- Table 15: Global Women Non Athletic Shoes Industry Revenue Million Forecast, by Country 2020 & 2033
- Table 16: Global Women Non Athletic Shoes Industry Volume K Units Forecast, by Country 2020 & 2033
- Table 17: United States Women Non Athletic Shoes Industry Revenue (Million) Forecast, by Application 2020 & 2033
- Table 18: United States Women Non Athletic Shoes Industry Volume (K Units) Forecast, by Application 2020 & 2033
- Table 19: Canada Women Non Athletic Shoes Industry Revenue (Million) Forecast, by Application 2020 & 2033
- Table 20: Canada Women Non Athletic Shoes Industry Volume (K Units) Forecast, by Application 2020 & 2033
- Table 21: Rest of North America Women Non Athletic Shoes Industry Revenue (Million) Forecast, by Application 2020 & 2033
- Table 22: Rest of North America Women Non Athletic Shoes Industry Volume (K Units) Forecast, by Application 2020 & 2033
- Table 23: Global Women Non Athletic Shoes Industry Revenue Million Forecast, by Type 2020 & 2033
- Table 24: Global Women Non Athletic Shoes Industry Volume K Units Forecast, by Type 2020 & 2033
- Table 25: Global Women Non Athletic Shoes Industry Revenue Million Forecast, by Distribution Channel 2020 & 2033
- Table 26: Global Women Non Athletic Shoes Industry Volume K Units Forecast, by Distribution Channel 2020 & 2033
- Table 27: Global Women Non Athletic Shoes Industry Revenue Million Forecast, by Category 2020 & 2033
- Table 28: Global Women Non Athletic Shoes Industry Volume K Units Forecast, by Category 2020 & 2033
- Table 29: Global Women Non Athletic Shoes Industry Revenue Million Forecast, by Country 2020 & 2033
- Table 30: Global Women Non Athletic Shoes Industry Volume K Units Forecast, by Country 2020 & 2033
- Table 31: Spain Women Non Athletic Shoes Industry Revenue (Million) Forecast, by Application 2020 & 2033
- Table 32: Spain Women Non Athletic Shoes Industry Volume (K Units) Forecast, by Application 2020 & 2033
- Table 33: United Kingdom Women Non Athletic Shoes Industry Revenue (Million) Forecast, by Application 2020 & 2033
- Table 34: United Kingdom Women Non Athletic Shoes Industry Volume (K Units) Forecast, by Application 2020 & 2033
- Table 35: Germany Women Non Athletic Shoes Industry Revenue (Million) Forecast, by Application 2020 & 2033
- Table 36: Germany Women Non Athletic Shoes Industry Volume (K Units) Forecast, by Application 2020 & 2033
- Table 37: France Women Non Athletic Shoes Industry Revenue (Million) Forecast, by Application 2020 & 2033
- Table 38: France Women Non Athletic Shoes Industry Volume (K Units) Forecast, by Application 2020 & 2033
- Table 39: Italy Women Non Athletic Shoes Industry Revenue (Million) Forecast, by Application 2020 & 2033
- Table 40: Italy Women Non Athletic Shoes Industry Volume (K Units) Forecast, by Application 2020 & 2033
- Table 41: Rest of Europe Women Non Athletic Shoes Industry Revenue (Million) Forecast, by Application 2020 & 2033
- Table 42: Rest of Europe Women Non Athletic Shoes Industry Volume (K Units) Forecast, by Application 2020 & 2033
- Table 43: Global Women Non Athletic Shoes Industry Revenue Million Forecast, by Type 2020 & 2033
- Table 44: Global Women Non Athletic Shoes Industry Volume K Units Forecast, by Type 2020 & 2033
- Table 45: Global Women Non Athletic Shoes Industry Revenue Million Forecast, by Distribution Channel 2020 & 2033
- Table 46: Global Women Non Athletic Shoes Industry Volume K Units Forecast, by Distribution Channel 2020 & 2033
- Table 47: Global Women Non Athletic Shoes Industry Revenue Million Forecast, by Category 2020 & 2033
- Table 48: Global Women Non Athletic Shoes Industry Volume K Units Forecast, by Category 2020 & 2033
- Table 49: Global Women Non Athletic Shoes Industry Revenue Million Forecast, by Country 2020 & 2033
- Table 50: Global Women Non Athletic Shoes Industry Volume K Units Forecast, by Country 2020 & 2033
- Table 51: China Women Non Athletic Shoes Industry Revenue (Million) Forecast, by Application 2020 & 2033
- Table 52: China Women Non Athletic Shoes Industry Volume (K Units) Forecast, by Application 2020 & 2033
- Table 53: Japan Women Non Athletic Shoes Industry Revenue (Million) Forecast, by Application 2020 & 2033
- Table 54: Japan Women Non Athletic Shoes Industry Volume (K Units) Forecast, by Application 2020 & 2033
- Table 55: India Women Non Athletic Shoes Industry Revenue (Million) Forecast, by Application 2020 & 2033
- Table 56: India Women Non Athletic Shoes Industry Volume (K Units) Forecast, by Application 2020 & 2033
- Table 57: Australia Women Non Athletic Shoes Industry Revenue (Million) Forecast, by Application 2020 & 2033
- Table 58: Australia Women Non Athletic Shoes Industry Volume (K Units) Forecast, by Application 2020 & 2033
- Table 59: Rest of Asia Pacific Women Non Athletic Shoes Industry Revenue (Million) Forecast, by Application 2020 & 2033
- Table 60: Rest of Asia Pacific Women Non Athletic Shoes Industry Volume (K Units) Forecast, by Application 2020 & 2033
- Table 61: Global Women Non Athletic Shoes Industry Revenue Million Forecast, by Type 2020 & 2033
- Table 62: Global Women Non Athletic Shoes Industry Volume K Units Forecast, by Type 2020 & 2033
- Table 63: Global Women Non Athletic Shoes Industry Revenue Million Forecast, by Distribution Channel 2020 & 2033
- Table 64: Global Women Non Athletic Shoes Industry Volume K Units Forecast, by Distribution Channel 2020 & 2033
- Table 65: Global Women Non Athletic Shoes Industry Revenue Million Forecast, by Category 2020 & 2033
- Table 66: Global Women Non Athletic Shoes Industry Volume K Units Forecast, by Category 2020 & 2033
- Table 67: Global Women Non Athletic Shoes Industry Revenue Million Forecast, by Country 2020 & 2033
- Table 68: Global Women Non Athletic Shoes Industry Volume K Units Forecast, by Country 2020 & 2033
- Table 69: Brazil Women Non Athletic Shoes Industry Revenue (Million) Forecast, by Application 2020 & 2033
- Table 70: Brazil Women Non Athletic Shoes Industry Volume (K Units) Forecast, by Application 2020 & 2033
- Table 71: Argentina Women Non Athletic Shoes Industry Revenue (Million) Forecast, by Application 2020 & 2033
- Table 72: Argentina Women Non Athletic Shoes Industry Volume (K Units) Forecast, by Application 2020 & 2033
- Table 73: Rest of South America Women Non Athletic Shoes Industry Revenue (Million) Forecast, by Application 2020 & 2033
- Table 74: Rest of South America Women Non Athletic Shoes Industry Volume (K Units) Forecast, by Application 2020 & 2033
- Table 75: Global Women Non Athletic Shoes Industry Revenue Million Forecast, by Type 2020 & 2033
- Table 76: Global Women Non Athletic Shoes Industry Volume K Units Forecast, by Type 2020 & 2033
- Table 77: Global Women Non Athletic Shoes Industry Revenue Million Forecast, by Distribution Channel 2020 & 2033
- Table 78: Global Women Non Athletic Shoes Industry Volume K Units Forecast, by Distribution Channel 2020 & 2033
- Table 79: Global Women Non Athletic Shoes Industry Revenue Million Forecast, by Category 2020 & 2033
- Table 80: Global Women Non Athletic Shoes Industry Volume K Units Forecast, by Category 2020 & 2033
- Table 81: Global Women Non Athletic Shoes Industry Revenue Million Forecast, by Country 2020 & 2033
- Table 82: Global Women Non Athletic Shoes Industry Volume K Units Forecast, by Country 2020 & 2033
- Table 83: South Africa Women Non Athletic Shoes Industry Revenue (Million) Forecast, by Application 2020 & 2033
- Table 84: South Africa Women Non Athletic Shoes Industry Volume (K Units) Forecast, by Application 2020 & 2033
- Table 85: Saudi Arabia Women Non Athletic Shoes Industry Revenue (Million) Forecast, by Application 2020 & 2033
- Table 86: Saudi Arabia Women Non Athletic Shoes Industry Volume (K Units) Forecast, by Application 2020 & 2033
- Table 87: Rest of Middle East and Africa Women Non Athletic Shoes Industry Revenue (Million) Forecast, by Application 2020 & 2033
- Table 88: Rest of Middle East and Africa Women Non Athletic Shoes Industry Volume (K Units) Forecast, by Application 2020 & 2033
Frequently Asked Questions
1. What is the projected Compound Annual Growth Rate (CAGR) of the Women Non Athletic Shoes Industry?
The projected CAGR is approximately 3.68%.
2. Which companies are prominent players in the Women Non Athletic Shoes Industry?
Key companies in the market include The ALDO Group Inc, Bata Corporation, Tapestry Inc, Kering, LVMH, Capri Holdings, Prada SpA, LIR SRL, CHANEL, VF Corporation*List Not Exhaustive.
3. What are the main segments of the Women Non Athletic Shoes Industry?
The market segments include Type, Distribution Channel, Category.
4. Can you provide details about the market size?
The market size is estimated to be USD 132.83 Million as of 2022.
5. What are some drivers contributing to market growth?
Fast Fashion Trend; Inflating Income Level of Individuals.
6. What are the notable trends driving market growth?
Emergence of E-Commerce.
7. Are there any restraints impacting market growth?
The Presence Of Counterfeit Products.
8. Can you provide examples of recent developments in the market?
In June 2021, Louis Vuitton collaborated with internet superstars Emma Chamberlain and Charli D'Amelio for the launch of the LV Squad sneaker and LV Sunset mule footwear campaign. The new footwear variants have been made available across the brand's stores and online websites.
9. What pricing options are available for accessing the report?
Pricing options include single-user, multi-user, and enterprise licenses priced at USD 4750, USD 5250, and USD 8750 respectively.
10. Is the market size provided in terms of value or volume?
The market size is provided in terms of value, measured in Million and volume, measured in K Units.
11. Are there any specific market keywords associated with the report?
Yes, the market keyword associated with the report is "Women Non Athletic Shoes Industry," which aids in identifying and referencing the specific market segment covered.
12. How do I determine which pricing option suits my needs best?
The pricing options vary based on user requirements and access needs. Individual users may opt for single-user licenses, while businesses requiring broader access may choose multi-user or enterprise licenses for cost-effective access to the report.
13. Are there any additional resources or data provided in the Women Non Athletic Shoes Industry report?
While the report offers comprehensive insights, it's advisable to review the specific contents or supplementary materials provided to ascertain if additional resources or data are available.
14. How can I stay updated on further developments or reports in the Women Non Athletic Shoes Industry?
To stay informed about further developments, trends, and reports in the Women Non Athletic Shoes Industry, consider subscribing to industry newsletters, following relevant companies and organizations, or regularly checking reputable industry news sources and publications.
Methodology
Step 1 - Identification of Relevant Samples Size from Population Database


Step 2 - Approaches for Defining Global Market Size (Value, Volume* & Price*)

Note*: In applicable scenarios
Step 3 - Data Sources
Primary Research
- Web Analytics
- Survey Reports
- Research Institute
- Latest Research Reports
- Opinion Leaders
Secondary Research
- Annual Reports
- White Paper
- Latest Press Release
- Industry Association
- Paid Database
- Investor Presentations

Step 4 - Data Triangulation
Involves using different sources of information in order to increase the validity of a study
These sources are likely to be stakeholders in a program - participants, other researchers, program staff, other community members, and so on.
Then we put all data in single framework & apply various statistical tools to find out the dynamic on the market.
During the analysis stage, feedback from the stakeholder groups would be compared to determine areas of agreement as well as areas of divergence