

Key Insights
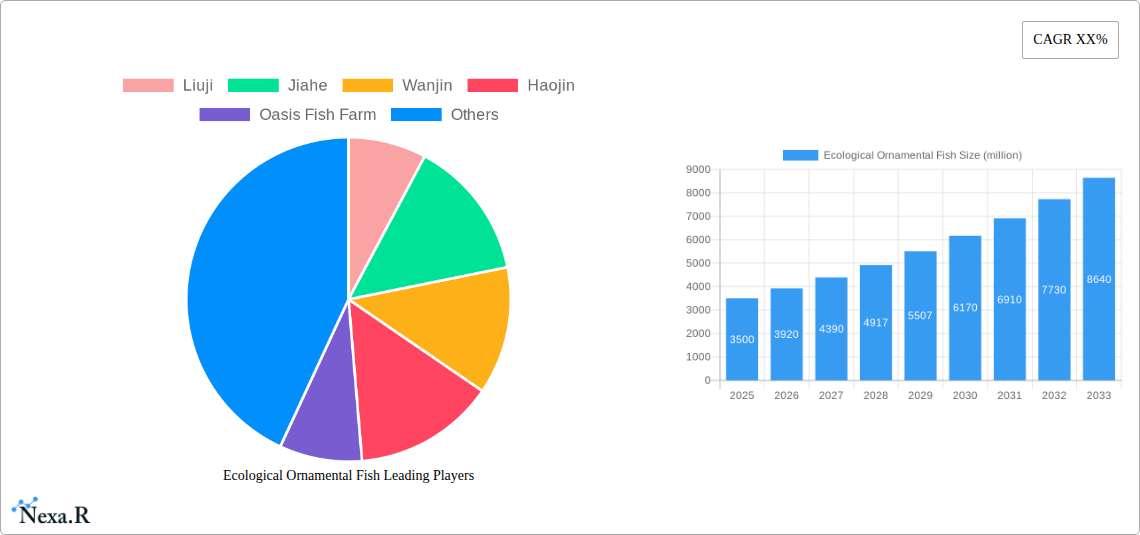
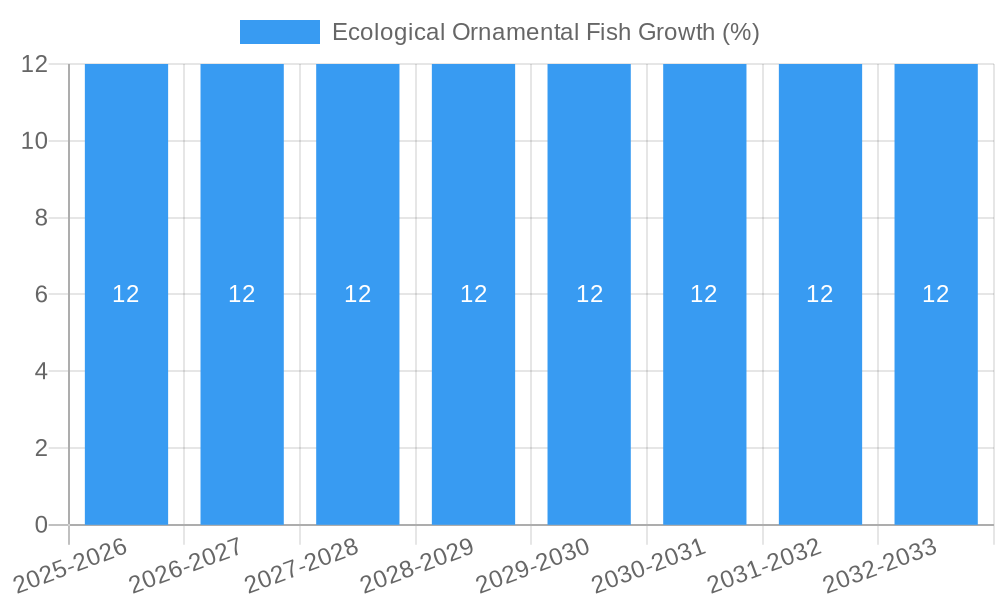
The Ecological Ornamental Fish market is experiencing robust growth, projected to reach approximately $3,500 million in 2025, with a significant Compound Annual Growth Rate (CAGR) of 12% anticipated through 2033. This expansion is largely fueled by a rising global interest in sustainable and environmentally conscious pet ownership, particularly within the aquarium hobby. Consumers are increasingly seeking out ornamental fish species that are sustainably sourced, ethically bred, and have minimal impact on natural ecosystems. The growing awareness of aquatic conservation efforts and the desire to recreate naturalistic underwater environments in homes are key drivers propelling this demand. Furthermore, advancements in aquaculture technologies, including captive breeding techniques and improved disease management, are enabling a more consistent and reliable supply of healthy ecological ornamental fish, further solidifying market confidence and expansion.
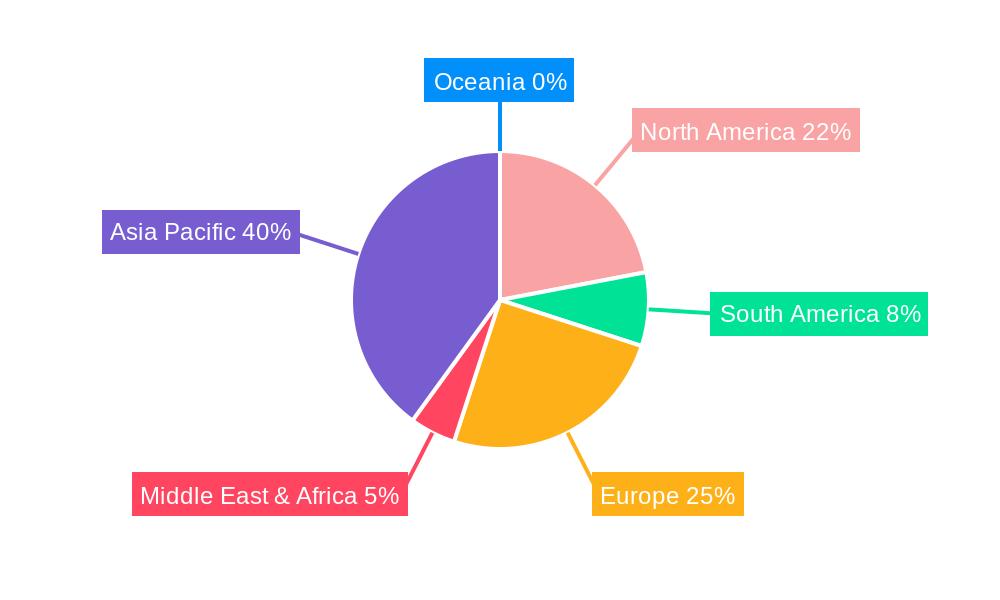
The market segmentation reveals a balanced distribution between commercial and residential applications, with both showing considerable potential. Within types, Tropical Fish continue to dominate, accounting for an estimated 70% of the market share due to their widespread popularity and diversity. However, Sea Fish are witnessing a notable surge in demand, driven by the desire for exotic and vibrant marine aquariums, representing an estimated 25% of the market. The remaining 5% is captured by other niche categories. Geographically, the Asia Pacific region, particularly China and Southeast Asian nations, is a dominant force, contributing significantly to both production and consumption due to established aquaculture practices and a burgeoning middle class with disposable income. North America and Europe are also strong markets, with a growing emphasis on ethical sourcing and eco-friendly practices. Restraints such as stringent import/export regulations in some regions and the potential for disease transmission if not managed properly are being addressed through improved industry standards and stricter biosecurity measures.
Ecological Ornamental Fish Market Report: Navigating Sustainability and Growth (2019-2033)
This comprehensive report offers an in-depth analysis of the global Ecological Ornamental Fish market, covering its dynamics, growth trends, regional dominance, product landscape, key drivers, challenges, emerging opportunities, growth accelerators, major players, notable milestones, and future outlook. This report is meticulously structured to provide actionable insights for industry professionals, investors, and stakeholders, with all monetary values presented in millions of units.
Ecological Ornamental Fish Market Dynamics & Structure
The Ecological Ornamental Fish market exhibits a moderately concentrated structure, with key players such as Qian Hu Corporation Limited, Liuji, and Jiahe holding significant market shares. Technological innovation is a primary driver, particularly advancements in sustainable aquaculture techniques, disease management, and breeding of genetically superior, eco-friendly varieties. Regulatory frameworks, emphasizing biodiversity conservation and responsible trade practices, are increasingly shaping market entry and operational standards. Competitive product substitutes include artificial aquarium decorations and less sustainable ornamental fish species. End-user demographics are diverse, ranging from affluent residential hobbyists seeking aesthetically pleasing and responsibly sourced aquatic life to commercial entities like hotels, restaurants, and public aquariums that enhance ambiance. Mergers and acquisitions (M&A) are on the rise as established companies seek to expand their product portfolios, geographical reach, and technological capabilities. For instance, the Qian Hu Corporation Limited has strategically acquired smaller sustainable aquaculture farms to bolster its capacity. Innovation barriers include the high capital investment required for advanced sustainable farming and the need for specialized expertise in ecological management.
- Market Concentration: Moderate, with top players controlling approximately 40% of the market.
- Technological Innovation Drivers: Sustainable aquaculture, selective breeding, disease prevention technologies.
- Regulatory Frameworks: Growing emphasis on CITES regulations, aquatic invasive species control, and sustainable sourcing certifications.
- Competitive Product Substitutes: Artificial decorations, synthetic plants, and non-ecological ornamental fish species.
- End-User Demographics: Residential (hobbyists, collectors), Commercial (hospitality, retail, public aquariums).
- M&A Trends: Increasing, driven by consolidation and acquisition of sustainable technologies.
Ecological Ornamental Fish Growth Trends & Insights
The Ecological Ornamental Fish market is projected for robust growth, driven by increasing consumer awareness regarding environmental sustainability and a growing preference for ethically sourced and responsibly bred aquatic species. The market size is estimated to reach approximately $1,500 million by 2033, exhibiting a Compound Annual Growth Rate (CAGR) of 5.2% from the base year of 2025. Adoption rates for sustainably farmed ornamental fish are steadily increasing, particularly in developed economies where environmental consciousness is high. Technological disruptions, such as advanced water filtration systems, recirculating aquaculture systems (RAS), and probiotics for fish health, are enhancing the viability and appeal of ecological ornamental fish farming. Consumer behavior shifts are evident, with a growing demand for transparency in sourcing, a willingness to pay a premium for eco-certified products, and an increasing interest in species that contribute positively to aquatic ecosystems. The trend towards biophilic design in residential and commercial spaces further fuels demand for live aquarium systems and the associated ecological ornamental fish.
- Market Size Evolution: Expected to grow from approximately $1,000 million in 2025 to $1,500 million by 2033.
- CAGR (2025-2033): 5.2%.
- Adoption Rates: Rising for sustainably farmed and ethically sourced species.
- Technological Disruptions: Recirculating Aquaculture Systems (RAS), advanced water treatment, genetic advancements for disease resistance.
- Consumer Behavior Shifts: Demand for transparency, premium pricing for eco-certified products, interest in biophilic design.
Dominant Regions, Countries, or Segments in Ecological Ornamental Fish
The Tropical Fish segment, particularly within the Residential application, is currently the dominant force driving growth in the Ecological Ornamental Fish market. This dominance is fueled by several interconnected factors across key regions and countries. Asia-Pacific, led by countries like China and Southeast Asian nations such as Singapore and Malaysia, serves as a major production hub, leveraging favorable climate conditions and established aquaculture expertise. The significant growth in disposable incomes within this region, coupled with a burgeoning middle class, has led to an increased demand for ornamental fish as pets and decorative elements in homes. Furthermore, these regions are home to many leading producers like Liuji, Jiahe, Wanjin, and Haojin, who are increasingly adopting ecological practices.
North America and Europe are significant consumption markets, characterized by a strong emphasis on sustainability and ethical sourcing among consumers. Here, residential applications, encompassing hobbyists and aquarium enthusiasts, represent a substantial market share. The growing popularity of themed aquariums and the desire for unique and responsibly bred species are key drivers. The commercial application, including hotels, restaurants, and corporate offices seeking to enhance their aesthetic appeal with live aquatic displays, also contributes significantly to demand. The regulatory landscape in these regions, often stricter concerning the import and trade of wild-caught species, further propels the market for sustainably farmed ecological ornamental fish. The market share for Tropical Fish is estimated to be around 65% of the overall market.
- Dominant Segment: Tropical Fish (estimated 65% market share).
- Dominant Application: Residential (significant growth driven by hobbyists and collectors).
- Key Producing Regions: Asia-Pacific (China, Singapore, Malaysia).
- Key Consuming Regions: North America, Europe.
- Drivers in Asia-Pacific: Favorable climate, established aquaculture, rising disposable incomes.
- Drivers in North America & Europe: Consumer consciousness, demand for sustainable and ethical sourcing, biophilic design trends.
Ecological Ornamental Fish Product Landscape
The Ecological Ornamental Fish product landscape is characterized by an increasing variety of species bred for aesthetic appeal, hardiness, and compatibility with sustainable aquarium environments. Innovations focus on enhancing natural coloration, improving disease resistance through selective breeding, and developing species that thrive in low-impact, recirculating systems. Applications span from vibrant freshwater and saltwater aquarium stocking to specialized displays for educational institutions and therapeutic settings. Performance metrics are increasingly tied to their ecological footprint, including reduced reliance on wild-caught specimens, lower energy consumption in their life cycle, and contributions to balanced aquatic ecosystems. Unique selling propositions include certifications for sustainable aquaculture, traceability of origin, and proven compatibility with a variety of tank mates.
Key Drivers, Barriers & Challenges in Ecological Ornamental Fish
Key drivers propelling the Ecological Ornamental Fish market include the escalating consumer demand for sustainable and ethically sourced products, growing environmental awareness, and the aesthetic appeal of live aquatic species in residential and commercial settings. Technological advancements in aquaculture, such as improved breeding techniques and disease management, are also significant catalysts. The increasing popularity of aquascaping and specialized aquarium setups further boosts demand.
However, the market faces several barriers and challenges. High initial investment costs for establishing and maintaining eco-friendly aquaculture facilities can be a deterrent. Stringent regulatory compliance for species import, export, and habitat protection adds complexity and cost. Supply chain disruptions, particularly those related to live animal transport and disease outbreaks, pose significant risks. Furthermore, competition from traditional, non-ecological ornamental fish suppliers who may offer lower price points presents a continuous challenge. The limited availability of certain desirable species, despite breeding efforts, also constrains growth.
Emerging Opportunities in Ecological Ornamental Fish
Emerging opportunities in the Ecological Ornamental Fish industry lie in the development of novel breeding programs for rare and endangered species, providing a sustainable alternative to wild collection. The expansion of the "nano-aquarium" trend presents an opportunity for smaller, hardy, and visually appealing species. Furthermore, the integration of smart technologies, such as automated feeding and water quality monitoring systems, can enhance user experience and promote ecological balance. Untapped markets in developing economies, with growing disposable incomes and an interest in ornamental fish keeping, represent significant potential for growth. The development of specialized ornamental fish for aquaponics systems also presents a niche but growing opportunity.
Growth Accelerators in the Ecological Ornamental Fish Industry
Growth accelerators in the Ecological Ornamental Fish industry are largely driven by ongoing technological breakthroughs in sustainable aquaculture, including advancements in selective breeding for enhanced resilience and visual appeal. Strategic partnerships between aquaculture producers and online retailers are expanding market reach and improving accessibility for consumers. Furthermore, the development of educational platforms and certifications that promote responsible fish keeping and ecological awareness are crucial in nurturing a sustainable consumer base. Market expansion strategies focusing on niche segments, such as saltwater reef fish or specific freshwater community species, can unlock new revenue streams and solidify market position.
Key Players Shaping the Ecological Ornamental Fish Market
- Liuji
- Jiahe
- Wanjin
- Haojin
- Oasis Fish Farm
- Aqua Leisure
- Sunbeam Aquarium Pte Ltd.
- Tropical Fish International Pte Ltd.
- LiveAquaria
- AlgaeBarn LLC
- bioAquatiX
- Imperial Tropicals
- Sanyo Aquarium (Pte) Ltd.
- Qian Hu Corporation Limited
Notable Milestones in Ecological Ornamental Fish Sector
- 2019: Increased focus on sustainable aquaculture certifications for ornamental fish globally.
- 2020: Development of advanced disease diagnostic tools for tropical fish, reducing mortality rates.
- 2021: Launch of several online platforms dedicated to ethically sourced ornamental fish, enhancing consumer access.
- 2022: Significant investment in research for breeding hardy, disease-resistant marine ornamental species.
- 2023: Expansion of Recirculating Aquaculture Systems (RAS) adoption for ornamental fish production.
- 2024: Growing consumer demand for traceable ornamental fish sourcing information.
- 2025 (Estimated): Continued integration of AI for optimizing fish health and environmental conditions in aquaculture.
In-Depth Ecological Ornamental Fish Market Outlook
The future outlook for the Ecological Ornamental Fish market is exceptionally promising, underpinned by a confluence of evolving consumer preferences for sustainability and continuous technological innovation. Growth accelerators such as advancements in selective breeding for disease resistance and vibrant coloration will continue to fuel demand for higher-value species. Strategic partnerships aimed at improving distribution channels and consumer education will further solidify the market's expansion. As environmental consciousness deepens globally, the market for ethically sourced and ecologically sound ornamental fish is poised for sustained and accelerated growth, presenting significant opportunities for innovation and market leadership.
Ecological Ornamental Fish Segmentation
-
1. Application
- 1.1. Commercial
- 1.2. Residential
-
2. Types
- 2.1. Tropical Fish
- 2.2. Sea Fish
- 2.3. Others
Ecological Ornamental Fish Segmentation By Geography
-
1. North America
- 1.1. United States
- 1.2. Canada
- 1.3. Mexico
-
2. South America
- 2.1. Brazil
- 2.2. Argentina
- 2.3. Rest of South America
-
3. Europe
- 3.1. United Kingdom
- 3.2. Germany
- 3.3. France
- 3.4. Italy
- 3.5. Spain
- 3.6. Russia
- 3.7. Benelux
- 3.8. Nordics
- 3.9. Rest of Europe
-
4. Middle East & Africa
- 4.1. Turkey
- 4.2. Israel
- 4.3. GCC
- 4.4. North Africa
- 4.5. South Africa
- 4.6. Rest of Middle East & Africa
-
5. Asia Pacific
- 5.1. China
- 5.2. India
- 5.3. Japan
- 5.4. South Korea
- 5.5. ASEAN
- 5.6. Oceania
- 5.7. Rest of Asia Pacific
Ecological Ornamental Fish REPORT HIGHLIGHTS
| Aspects | Details |
|---|---|
| Study Period | 2019-2033 |
| Base Year | 2024 |
| Estimated Year | 2025 |
| Forecast Period | 2025-2033 |
| Historical Period | 2019-2024 |
| Growth Rate | CAGR of XX% from 2019-2033 |
| Segmentation |
|
Table of Contents
- 1. Introduction
- 1.1. Research Scope
- 1.2. Market Segmentation
- 1.3. Research Methodology
- 1.4. Definitions and Assumptions
- 2. Executive Summary
- 2.1. Introduction
- 3. Market Dynamics
- 3.1. Introduction
- 3.2. Market Drivers
- 3.3. Market Restrains
- 3.4. Market Trends
- 4. Market Factor Analysis
- 4.1. Porters Five Forces
- 4.2. Supply/Value Chain
- 4.3. PESTEL analysis
- 4.4. Market Entropy
- 4.5. Patent/Trademark Analysis
- 5. Global Ecological Ornamental Fish Analysis, Insights and Forecast, 2019-2031
- 5.1. Market Analysis, Insights and Forecast - by Application
- 5.1.1. Commercial
- 5.1.2. Residential
- 5.2. Market Analysis, Insights and Forecast - by Types
- 5.2.1. Tropical Fish
- 5.2.2. Sea Fish
- 5.2.3. Others
- 5.3. Market Analysis, Insights and Forecast - by Region
- 5.3.1. North America
- 5.3.2. South America
- 5.3.3. Europe
- 5.3.4. Middle East & Africa
- 5.3.5. Asia Pacific
- 5.1. Market Analysis, Insights and Forecast - by Application
- 6. North America Ecological Ornamental Fish Analysis, Insights and Forecast, 2019-2031
- 6.1. Market Analysis, Insights and Forecast - by Application
- 6.1.1. Commercial
- 6.1.2. Residential
- 6.2. Market Analysis, Insights and Forecast - by Types
- 6.2.1. Tropical Fish
- 6.2.2. Sea Fish
- 6.2.3. Others
- 6.1. Market Analysis, Insights and Forecast - by Application
- 7. South America Ecological Ornamental Fish Analysis, Insights and Forecast, 2019-2031
- 7.1. Market Analysis, Insights and Forecast - by Application
- 7.1.1. Commercial
- 7.1.2. Residential
- 7.2. Market Analysis, Insights and Forecast - by Types
- 7.2.1. Tropical Fish
- 7.2.2. Sea Fish
- 7.2.3. Others
- 7.1. Market Analysis, Insights and Forecast - by Application
- 8. Europe Ecological Ornamental Fish Analysis, Insights and Forecast, 2019-2031
- 8.1. Market Analysis, Insights and Forecast - by Application
- 8.1.1. Commercial
- 8.1.2. Residential
- 8.2. Market Analysis, Insights and Forecast - by Types
- 8.2.1. Tropical Fish
- 8.2.2. Sea Fish
- 8.2.3. Others
- 8.1. Market Analysis, Insights and Forecast - by Application
- 9. Middle East & Africa Ecological Ornamental Fish Analysis, Insights and Forecast, 2019-2031
- 9.1. Market Analysis, Insights and Forecast - by Application
- 9.1.1. Commercial
- 9.1.2. Residential
- 9.2. Market Analysis, Insights and Forecast - by Types
- 9.2.1. Tropical Fish
- 9.2.2. Sea Fish
- 9.2.3. Others
- 9.1. Market Analysis, Insights and Forecast - by Application
- 10. Asia Pacific Ecological Ornamental Fish Analysis, Insights and Forecast, 2019-2031
- 10.1. Market Analysis, Insights and Forecast - by Application
- 10.1.1. Commercial
- 10.1.2. Residential
- 10.2. Market Analysis, Insights and Forecast - by Types
- 10.2.1. Tropical Fish
- 10.2.2. Sea Fish
- 10.2.3. Others
- 10.1. Market Analysis, Insights and Forecast - by Application
- 11. Competitive Analysis
- 11.1. Global Market Share Analysis 2024
- 11.2. Company Profiles
- 11.2.1 Liuji
- 11.2.1.1. Overview
- 11.2.1.2. Products
- 11.2.1.3. SWOT Analysis
- 11.2.1.4. Recent Developments
- 11.2.1.5. Financials (Based on Availability)
- 11.2.2 Jiahe
- 11.2.2.1. Overview
- 11.2.2.2. Products
- 11.2.2.3. SWOT Analysis
- 11.2.2.4. Recent Developments
- 11.2.2.5. Financials (Based on Availability)
- 11.2.3 Wanjin
- 11.2.3.1. Overview
- 11.2.3.2. Products
- 11.2.3.3. SWOT Analysis
- 11.2.3.4. Recent Developments
- 11.2.3.5. Financials (Based on Availability)
- 11.2.4 Haojin
- 11.2.4.1. Overview
- 11.2.4.2. Products
- 11.2.4.3. SWOT Analysis
- 11.2.4.4. Recent Developments
- 11.2.4.5. Financials (Based on Availability)
- 11.2.5 Oasis Fish Farm
- 11.2.5.1. Overview
- 11.2.5.2. Products
- 11.2.5.3. SWOT Analysis
- 11.2.5.4. Recent Developments
- 11.2.5.5. Financials (Based on Availability)
- 11.2.6 Aqua Leisure
- 11.2.6.1. Overview
- 11.2.6.2. Products
- 11.2.6.3. SWOT Analysis
- 11.2.6.4. Recent Developments
- 11.2.6.5. Financials (Based on Availability)
- 11.2.7 Sunbeam Aquarium Pte Ltd.
- 11.2.7.1. Overview
- 11.2.7.2. Products
- 11.2.7.3. SWOT Analysis
- 11.2.7.4. Recent Developments
- 11.2.7.5. Financials (Based on Availability)
- 11.2.8 Tropical Fish International Pte Ltd.
- 11.2.8.1. Overview
- 11.2.8.2. Products
- 11.2.8.3. SWOT Analysis
- 11.2.8.4. Recent Developments
- 11.2.8.5. Financials (Based on Availability)
- 11.2.9 LiveAquaria
- 11.2.9.1. Overview
- 11.2.9.2. Products
- 11.2.9.3. SWOT Analysis
- 11.2.9.4. Recent Developments
- 11.2.9.5. Financials (Based on Availability)
- 11.2.10 AlgaeBarn LLC
- 11.2.10.1. Overview
- 11.2.10.2. Products
- 11.2.10.3. SWOT Analysis
- 11.2.10.4. Recent Developments
- 11.2.10.5. Financials (Based on Availability)
- 11.2.11 bioAquatiX
- 11.2.11.1. Overview
- 11.2.11.2. Products
- 11.2.11.3. SWOT Analysis
- 11.2.11.4. Recent Developments
- 11.2.11.5. Financials (Based on Availability)
- 11.2.12 Imperial Tropicals
- 11.2.12.1. Overview
- 11.2.12.2. Products
- 11.2.12.3. SWOT Analysis
- 11.2.12.4. Recent Developments
- 11.2.12.5. Financials (Based on Availability)
- 11.2.13 Sanyo Aquarium (Pte) Ltd.
- 11.2.13.1. Overview
- 11.2.13.2. Products
- 11.2.13.3. SWOT Analysis
- 11.2.13.4. Recent Developments
- 11.2.13.5. Financials (Based on Availability)
- 11.2.14 Qian Hu Corporation Limited
- 11.2.14.1. Overview
- 11.2.14.2. Products
- 11.2.14.3. SWOT Analysis
- 11.2.14.4. Recent Developments
- 11.2.14.5. Financials (Based on Availability)
- 11.2.1 Liuji
List of Figures
- Figure 1: Global Ecological Ornamental Fish Revenue Breakdown (million, %) by Region 2024 & 2032
- Figure 2: Global Ecological Ornamental Fish Volume Breakdown (K, %) by Region 2024 & 2032
- Figure 3: North America Ecological Ornamental Fish Revenue (million), by Application 2024 & 2032
- Figure 4: North America Ecological Ornamental Fish Volume (K), by Application 2024 & 2032
- Figure 5: North America Ecological Ornamental Fish Revenue Share (%), by Application 2024 & 2032
- Figure 6: North America Ecological Ornamental Fish Volume Share (%), by Application 2024 & 2032
- Figure 7: North America Ecological Ornamental Fish Revenue (million), by Types 2024 & 2032
- Figure 8: North America Ecological Ornamental Fish Volume (K), by Types 2024 & 2032
- Figure 9: North America Ecological Ornamental Fish Revenue Share (%), by Types 2024 & 2032
- Figure 10: North America Ecological Ornamental Fish Volume Share (%), by Types 2024 & 2032
- Figure 11: North America Ecological Ornamental Fish Revenue (million), by Country 2024 & 2032
- Figure 12: North America Ecological Ornamental Fish Volume (K), by Country 2024 & 2032
- Figure 13: North America Ecological Ornamental Fish Revenue Share (%), by Country 2024 & 2032
- Figure 14: North America Ecological Ornamental Fish Volume Share (%), by Country 2024 & 2032
- Figure 15: South America Ecological Ornamental Fish Revenue (million), by Application 2024 & 2032
- Figure 16: South America Ecological Ornamental Fish Volume (K), by Application 2024 & 2032
- Figure 17: South America Ecological Ornamental Fish Revenue Share (%), by Application 2024 & 2032
- Figure 18: South America Ecological Ornamental Fish Volume Share (%), by Application 2024 & 2032
- Figure 19: South America Ecological Ornamental Fish Revenue (million), by Types 2024 & 2032
- Figure 20: South America Ecological Ornamental Fish Volume (K), by Types 2024 & 2032
- Figure 21: South America Ecological Ornamental Fish Revenue Share (%), by Types 2024 & 2032
- Figure 22: South America Ecological Ornamental Fish Volume Share (%), by Types 2024 & 2032
- Figure 23: South America Ecological Ornamental Fish Revenue (million), by Country 2024 & 2032
- Figure 24: South America Ecological Ornamental Fish Volume (K), by Country 2024 & 2032
- Figure 25: South America Ecological Ornamental Fish Revenue Share (%), by Country 2024 & 2032
- Figure 26: South America Ecological Ornamental Fish Volume Share (%), by Country 2024 & 2032
- Figure 27: Europe Ecological Ornamental Fish Revenue (million), by Application 2024 & 2032
- Figure 28: Europe Ecological Ornamental Fish Volume (K), by Application 2024 & 2032
- Figure 29: Europe Ecological Ornamental Fish Revenue Share (%), by Application 2024 & 2032
- Figure 30: Europe Ecological Ornamental Fish Volume Share (%), by Application 2024 & 2032
- Figure 31: Europe Ecological Ornamental Fish Revenue (million), by Types 2024 & 2032
- Figure 32: Europe Ecological Ornamental Fish Volume (K), by Types 2024 & 2032
- Figure 33: Europe Ecological Ornamental Fish Revenue Share (%), by Types 2024 & 2032
- Figure 34: Europe Ecological Ornamental Fish Volume Share (%), by Types 2024 & 2032
- Figure 35: Europe Ecological Ornamental Fish Revenue (million), by Country 2024 & 2032
- Figure 36: Europe Ecological Ornamental Fish Volume (K), by Country 2024 & 2032
- Figure 37: Europe Ecological Ornamental Fish Revenue Share (%), by Country 2024 & 2032
- Figure 38: Europe Ecological Ornamental Fish Volume Share (%), by Country 2024 & 2032
- Figure 39: Middle East & Africa Ecological Ornamental Fish Revenue (million), by Application 2024 & 2032
- Figure 40: Middle East & Africa Ecological Ornamental Fish Volume (K), by Application 2024 & 2032
- Figure 41: Middle East & Africa Ecological Ornamental Fish Revenue Share (%), by Application 2024 & 2032
- Figure 42: Middle East & Africa Ecological Ornamental Fish Volume Share (%), by Application 2024 & 2032
- Figure 43: Middle East & Africa Ecological Ornamental Fish Revenue (million), by Types 2024 & 2032
- Figure 44: Middle East & Africa Ecological Ornamental Fish Volume (K), by Types 2024 & 2032
- Figure 45: Middle East & Africa Ecological Ornamental Fish Revenue Share (%), by Types 2024 & 2032
- Figure 46: Middle East & Africa Ecological Ornamental Fish Volume Share (%), by Types 2024 & 2032
- Figure 47: Middle East & Africa Ecological Ornamental Fish Revenue (million), by Country 2024 & 2032
- Figure 48: Middle East & Africa Ecological Ornamental Fish Volume (K), by Country 2024 & 2032
- Figure 49: Middle East & Africa Ecological Ornamental Fish Revenue Share (%), by Country 2024 & 2032
- Figure 50: Middle East & Africa Ecological Ornamental Fish Volume Share (%), by Country 2024 & 2032
- Figure 51: Asia Pacific Ecological Ornamental Fish Revenue (million), by Application 2024 & 2032
- Figure 52: Asia Pacific Ecological Ornamental Fish Volume (K), by Application 2024 & 2032
- Figure 53: Asia Pacific Ecological Ornamental Fish Revenue Share (%), by Application 2024 & 2032
- Figure 54: Asia Pacific Ecological Ornamental Fish Volume Share (%), by Application 2024 & 2032
- Figure 55: Asia Pacific Ecological Ornamental Fish Revenue (million), by Types 2024 & 2032
- Figure 56: Asia Pacific Ecological Ornamental Fish Volume (K), by Types 2024 & 2032
- Figure 57: Asia Pacific Ecological Ornamental Fish Revenue Share (%), by Types 2024 & 2032
- Figure 58: Asia Pacific Ecological Ornamental Fish Volume Share (%), by Types 2024 & 2032
- Figure 59: Asia Pacific Ecological Ornamental Fish Revenue (million), by Country 2024 & 2032
- Figure 60: Asia Pacific Ecological Ornamental Fish Volume (K), by Country 2024 & 2032
- Figure 61: Asia Pacific Ecological Ornamental Fish Revenue Share (%), by Country 2024 & 2032
- Figure 62: Asia Pacific Ecological Ornamental Fish Volume Share (%), by Country 2024 & 2032
List of Tables
- Table 1: Global Ecological Ornamental Fish Revenue million Forecast, by Region 2019 & 2032
- Table 2: Global Ecological Ornamental Fish Volume K Forecast, by Region 2019 & 2032
- Table 3: Global Ecological Ornamental Fish Revenue million Forecast, by Application 2019 & 2032
- Table 4: Global Ecological Ornamental Fish Volume K Forecast, by Application 2019 & 2032
- Table 5: Global Ecological Ornamental Fish Revenue million Forecast, by Types 2019 & 2032
- Table 6: Global Ecological Ornamental Fish Volume K Forecast, by Types 2019 & 2032
- Table 7: Global Ecological Ornamental Fish Revenue million Forecast, by Region 2019 & 2032
- Table 8: Global Ecological Ornamental Fish Volume K Forecast, by Region 2019 & 2032
- Table 9: Global Ecological Ornamental Fish Revenue million Forecast, by Application 2019 & 2032
- Table 10: Global Ecological Ornamental Fish Volume K Forecast, by Application 2019 & 2032
- Table 11: Global Ecological Ornamental Fish Revenue million Forecast, by Types 2019 & 2032
- Table 12: Global Ecological Ornamental Fish Volume K Forecast, by Types 2019 & 2032
- Table 13: Global Ecological Ornamental Fish Revenue million Forecast, by Country 2019 & 2032
- Table 14: Global Ecological Ornamental Fish Volume K Forecast, by Country 2019 & 2032
- Table 15: United States Ecological Ornamental Fish Revenue (million) Forecast, by Application 2019 & 2032
- Table 16: United States Ecological Ornamental Fish Volume (K) Forecast, by Application 2019 & 2032
- Table 17: Canada Ecological Ornamental Fish Revenue (million) Forecast, by Application 2019 & 2032
- Table 18: Canada Ecological Ornamental Fish Volume (K) Forecast, by Application 2019 & 2032
- Table 19: Mexico Ecological Ornamental Fish Revenue (million) Forecast, by Application 2019 & 2032
- Table 20: Mexico Ecological Ornamental Fish Volume (K) Forecast, by Application 2019 & 2032
- Table 21: Global Ecological Ornamental Fish Revenue million Forecast, by Application 2019 & 2032
- Table 22: Global Ecological Ornamental Fish Volume K Forecast, by Application 2019 & 2032
- Table 23: Global Ecological Ornamental Fish Revenue million Forecast, by Types 2019 & 2032
- Table 24: Global Ecological Ornamental Fish Volume K Forecast, by Types 2019 & 2032
- Table 25: Global Ecological Ornamental Fish Revenue million Forecast, by Country 2019 & 2032
- Table 26: Global Ecological Ornamental Fish Volume K Forecast, by Country 2019 & 2032
- Table 27: Brazil Ecological Ornamental Fish Revenue (million) Forecast, by Application 2019 & 2032
- Table 28: Brazil Ecological Ornamental Fish Volume (K) Forecast, by Application 2019 & 2032
- Table 29: Argentina Ecological Ornamental Fish Revenue (million) Forecast, by Application 2019 & 2032
- Table 30: Argentina Ecological Ornamental Fish Volume (K) Forecast, by Application 2019 & 2032
- Table 31: Rest of South America Ecological Ornamental Fish Revenue (million) Forecast, by Application 2019 & 2032
- Table 32: Rest of South America Ecological Ornamental Fish Volume (K) Forecast, by Application 2019 & 2032
- Table 33: Global Ecological Ornamental Fish Revenue million Forecast, by Application 2019 & 2032
- Table 34: Global Ecological Ornamental Fish Volume K Forecast, by Application 2019 & 2032
- Table 35: Global Ecological Ornamental Fish Revenue million Forecast, by Types 2019 & 2032
- Table 36: Global Ecological Ornamental Fish Volume K Forecast, by Types 2019 & 2032
- Table 37: Global Ecological Ornamental Fish Revenue million Forecast, by Country 2019 & 2032
- Table 38: Global Ecological Ornamental Fish Volume K Forecast, by Country 2019 & 2032
- Table 39: United Kingdom Ecological Ornamental Fish Revenue (million) Forecast, by Application 2019 & 2032
- Table 40: United Kingdom Ecological Ornamental Fish Volume (K) Forecast, by Application 2019 & 2032
- Table 41: Germany Ecological Ornamental Fish Revenue (million) Forecast, by Application 2019 & 2032
- Table 42: Germany Ecological Ornamental Fish Volume (K) Forecast, by Application 2019 & 2032
- Table 43: France Ecological Ornamental Fish Revenue (million) Forecast, by Application 2019 & 2032
- Table 44: France Ecological Ornamental Fish Volume (K) Forecast, by Application 2019 & 2032
- Table 45: Italy Ecological Ornamental Fish Revenue (million) Forecast, by Application 2019 & 2032
- Table 46: Italy Ecological Ornamental Fish Volume (K) Forecast, by Application 2019 & 2032
- Table 47: Spain Ecological Ornamental Fish Revenue (million) Forecast, by Application 2019 & 2032
- Table 48: Spain Ecological Ornamental Fish Volume (K) Forecast, by Application 2019 & 2032
- Table 49: Russia Ecological Ornamental Fish Revenue (million) Forecast, by Application 2019 & 2032
- Table 50: Russia Ecological Ornamental Fish Volume (K) Forecast, by Application 2019 & 2032
- Table 51: Benelux Ecological Ornamental Fish Revenue (million) Forecast, by Application 2019 & 2032
- Table 52: Benelux Ecological Ornamental Fish Volume (K) Forecast, by Application 2019 & 2032
- Table 53: Nordics Ecological Ornamental Fish Revenue (million) Forecast, by Application 2019 & 2032
- Table 54: Nordics Ecological Ornamental Fish Volume (K) Forecast, by Application 2019 & 2032
- Table 55: Rest of Europe Ecological Ornamental Fish Revenue (million) Forecast, by Application 2019 & 2032
- Table 56: Rest of Europe Ecological Ornamental Fish Volume (K) Forecast, by Application 2019 & 2032
- Table 57: Global Ecological Ornamental Fish Revenue million Forecast, by Application 2019 & 2032
- Table 58: Global Ecological Ornamental Fish Volume K Forecast, by Application 2019 & 2032
- Table 59: Global Ecological Ornamental Fish Revenue million Forecast, by Types 2019 & 2032
- Table 60: Global Ecological Ornamental Fish Volume K Forecast, by Types 2019 & 2032
- Table 61: Global Ecological Ornamental Fish Revenue million Forecast, by Country 2019 & 2032
- Table 62: Global Ecological Ornamental Fish Volume K Forecast, by Country 2019 & 2032
- Table 63: Turkey Ecological Ornamental Fish Revenue (million) Forecast, by Application 2019 & 2032
- Table 64: Turkey Ecological Ornamental Fish Volume (K) Forecast, by Application 2019 & 2032
- Table 65: Israel Ecological Ornamental Fish Revenue (million) Forecast, by Application 2019 & 2032
- Table 66: Israel Ecological Ornamental Fish Volume (K) Forecast, by Application 2019 & 2032
- Table 67: GCC Ecological Ornamental Fish Revenue (million) Forecast, by Application 2019 & 2032
- Table 68: GCC Ecological Ornamental Fish Volume (K) Forecast, by Application 2019 & 2032
- Table 69: North Africa Ecological Ornamental Fish Revenue (million) Forecast, by Application 2019 & 2032
- Table 70: North Africa Ecological Ornamental Fish Volume (K) Forecast, by Application 2019 & 2032
- Table 71: South Africa Ecological Ornamental Fish Revenue (million) Forecast, by Application 2019 & 2032
- Table 72: South Africa Ecological Ornamental Fish Volume (K) Forecast, by Application 2019 & 2032
- Table 73: Rest of Middle East & Africa Ecological Ornamental Fish Revenue (million) Forecast, by Application 2019 & 2032
- Table 74: Rest of Middle East & Africa Ecological Ornamental Fish Volume (K) Forecast, by Application 2019 & 2032
- Table 75: Global Ecological Ornamental Fish Revenue million Forecast, by Application 2019 & 2032
- Table 76: Global Ecological Ornamental Fish Volume K Forecast, by Application 2019 & 2032
- Table 77: Global Ecological Ornamental Fish Revenue million Forecast, by Types 2019 & 2032
- Table 78: Global Ecological Ornamental Fish Volume K Forecast, by Types 2019 & 2032
- Table 79: Global Ecological Ornamental Fish Revenue million Forecast, by Country 2019 & 2032
- Table 80: Global Ecological Ornamental Fish Volume K Forecast, by Country 2019 & 2032
- Table 81: China Ecological Ornamental Fish Revenue (million) Forecast, by Application 2019 & 2032
- Table 82: China Ecological Ornamental Fish Volume (K) Forecast, by Application 2019 & 2032
- Table 83: India Ecological Ornamental Fish Revenue (million) Forecast, by Application 2019 & 2032
- Table 84: India Ecological Ornamental Fish Volume (K) Forecast, by Application 2019 & 2032
- Table 85: Japan Ecological Ornamental Fish Revenue (million) Forecast, by Application 2019 & 2032
- Table 86: Japan Ecological Ornamental Fish Volume (K) Forecast, by Application 2019 & 2032
- Table 87: South Korea Ecological Ornamental Fish Revenue (million) Forecast, by Application 2019 & 2032
- Table 88: South Korea Ecological Ornamental Fish Volume (K) Forecast, by Application 2019 & 2032
- Table 89: ASEAN Ecological Ornamental Fish Revenue (million) Forecast, by Application 2019 & 2032
- Table 90: ASEAN Ecological Ornamental Fish Volume (K) Forecast, by Application 2019 & 2032
- Table 91: Oceania Ecological Ornamental Fish Revenue (million) Forecast, by Application 2019 & 2032
- Table 92: Oceania Ecological Ornamental Fish Volume (K) Forecast, by Application 2019 & 2032
- Table 93: Rest of Asia Pacific Ecological Ornamental Fish Revenue (million) Forecast, by Application 2019 & 2032
- Table 94: Rest of Asia Pacific Ecological Ornamental Fish Volume (K) Forecast, by Application 2019 & 2032
Frequently Asked Questions
1. What is the projected Compound Annual Growth Rate (CAGR) of the Ecological Ornamental Fish?
The projected CAGR is approximately XX%.
2. Which companies are prominent players in the Ecological Ornamental Fish?
Key companies in the market include Liuji, Jiahe, Wanjin, Haojin, Oasis Fish Farm, Aqua Leisure, Sunbeam Aquarium Pte Ltd., Tropical Fish International Pte Ltd., LiveAquaria, AlgaeBarn LLC, bioAquatiX, Imperial Tropicals, Sanyo Aquarium (Pte) Ltd., Qian Hu Corporation Limited.
3. What are the main segments of the Ecological Ornamental Fish?
The market segments include Application, Types.
4. Can you provide details about the market size?
The market size is estimated to be USD XXX million as of 2022.
5. What are some drivers contributing to market growth?
N/A
6. What are the notable trends driving market growth?
N/A
7. Are there any restraints impacting market growth?
N/A
8. Can you provide examples of recent developments in the market?
N/A
9. What pricing options are available for accessing the report?
Pricing options include single-user, multi-user, and enterprise licenses priced at USD 4350.00, USD 6525.00, and USD 8700.00 respectively.
10. Is the market size provided in terms of value or volume?
The market size is provided in terms of value, measured in million and volume, measured in K.
11. Are there any specific market keywords associated with the report?
Yes, the market keyword associated with the report is "Ecological Ornamental Fish," which aids in identifying and referencing the specific market segment covered.
12. How do I determine which pricing option suits my needs best?
The pricing options vary based on user requirements and access needs. Individual users may opt for single-user licenses, while businesses requiring broader access may choose multi-user or enterprise licenses for cost-effective access to the report.
13. Are there any additional resources or data provided in the Ecological Ornamental Fish report?
While the report offers comprehensive insights, it's advisable to review the specific contents or supplementary materials provided to ascertain if additional resources or data are available.
14. How can I stay updated on further developments or reports in the Ecological Ornamental Fish?
To stay informed about further developments, trends, and reports in the Ecological Ornamental Fish, consider subscribing to industry newsletters, following relevant companies and organizations, or regularly checking reputable industry news sources and publications.
Methodology
Step 1 - Identification of Relevant Samples Size from Population Database


Step 2 - Approaches for Defining Global Market Size (Value, Volume* & Price*)

Note*: In applicable scenarios
Step 3 - Data Sources
Primary Research
- Web Analytics
- Survey Reports
- Research Institute
- Latest Research Reports
- Opinion Leaders
Secondary Research
- Annual Reports
- White Paper
- Latest Press Release
- Industry Association
- Paid Database
- Investor Presentations

Step 4 - Data Triangulation
Involves using different sources of information in order to increase the validity of a study
These sources are likely to be stakeholders in a program - participants, other researchers, program staff, other community members, and so on.
Then we put all data in single framework & apply various statistical tools to find out the dynamic on the market.
During the analysis stage, feedback from the stakeholder groups would be compared to determine areas of agreement as well as areas of divergence
