

Key Insights
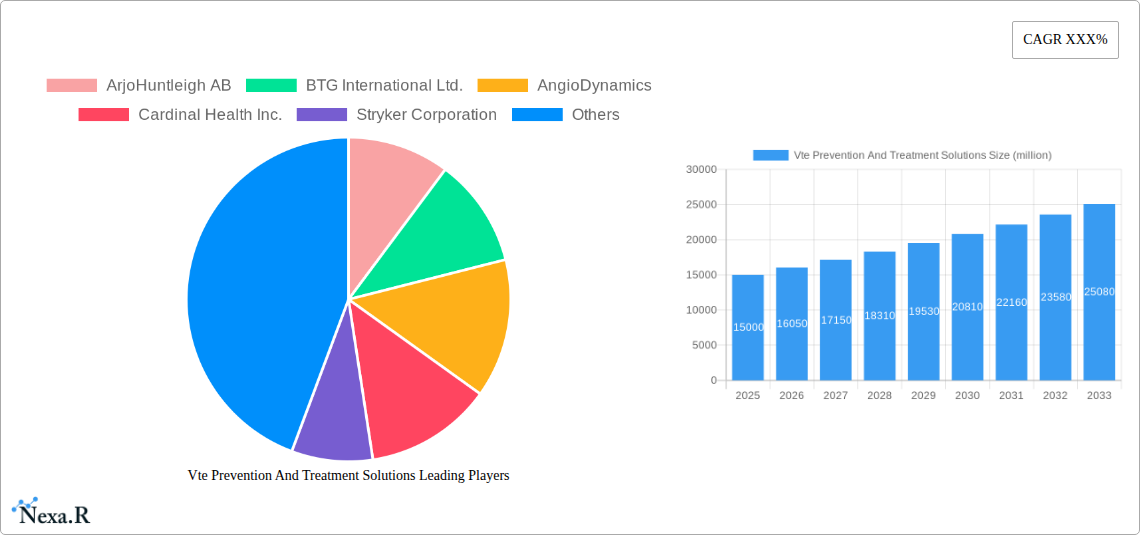
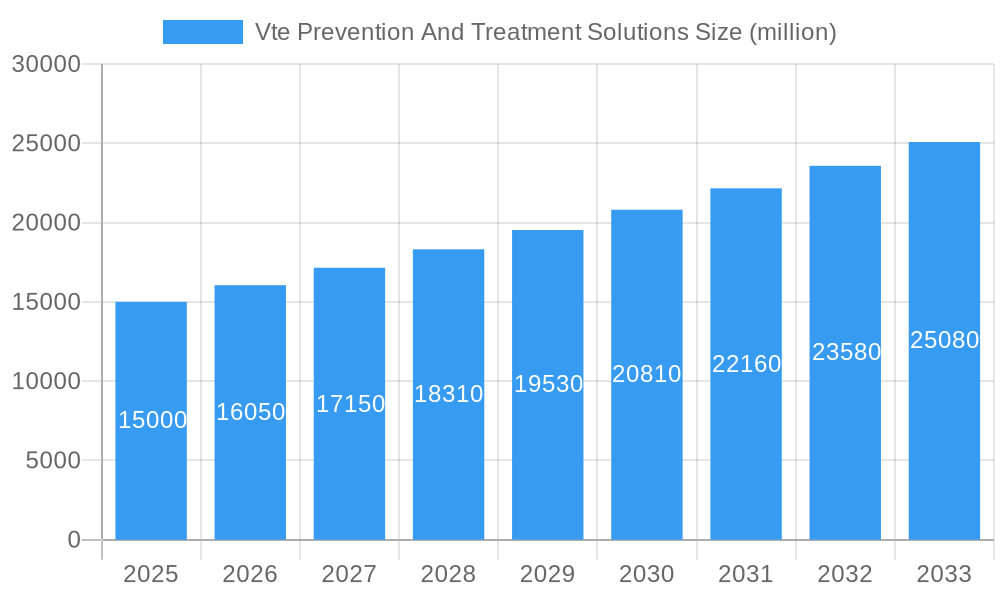
The global market for VTE (Venous Thromboembolism) Prevention and Treatment Solutions is experiencing robust growth, driven by increasing prevalence of cardiovascular diseases, a rising elderly population, and advancements in minimally invasive procedures. The market size in 2025 is estimated at $15 billion, projecting a Compound Annual Growth Rate (CAGR) of 7% from 2025 to 2033. This growth is fueled by several key factors: the increasing adoption of effective prophylactic measures in high-risk patients (e.g., post-surgical patients, individuals with prolonged immobilization), technological advancements leading to less invasive and more effective treatment options (such as improved compression stockings, novel anticoagulants, and advanced thrombectomy devices), and growing awareness among healthcare professionals and the public about VTE risks and management. The market is segmented by product type (pharmaceuticals, medical devices), treatment type (prevention, treatment), and end-user (hospitals, ambulatory surgical centers, home healthcare). Major players like ArjoHuntleigh AB, BTG International Ltd., and Boston Scientific Corp. are driving innovation and market competition through R&D investments and strategic acquisitions.
Vte Prevention And Treatment Solutions Market Size (In Billion)
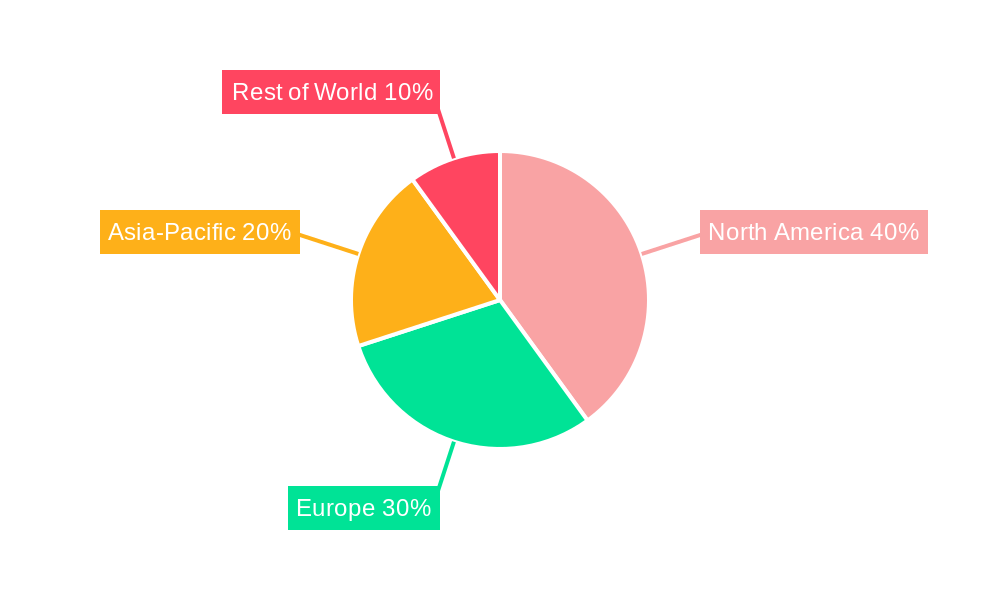
Market restraints include the high cost of treatment, particularly for advanced therapies, the potential for adverse events associated with certain anticoagulants, and variations in healthcare infrastructure and access across different regions. However, these challenges are likely to be mitigated by ongoing technological advancements, the development of cost-effective treatment options, and growing government initiatives focused on improving healthcare access and affordability. The Asia-Pacific region is expected to witness significant growth due to its large and rapidly aging population, rising disposable incomes, and increasing healthcare expenditure. North America and Europe will continue to be substantial markets due to their established healthcare infrastructure and high adoption of advanced therapies. The forecast period from 2025 to 2033 presents significant opportunities for market players who can effectively address the needs of patients and healthcare providers.
Vte Prevention And Treatment Solutions Company Market Share
VTE Prevention and Treatment Solutions Market Report: 2019-2033
This comprehensive report provides a detailed analysis of the global VTE Prevention and Treatment Solutions market, encompassing market dynamics, growth trends, regional analysis, competitive landscape, and future outlook. The study period covers 2019-2033, with 2025 as the base and estimated year. The report is invaluable for industry professionals, investors, and stakeholders seeking insights into this vital healthcare sector.
Keywords: VTE Prevention, VTE Treatment, Thromboembolism, Deep Vein Thrombosis (DVT), Pulmonary Embolism (PE), Anticoagulants, Compression Therapy, Thrombolytics, Medical Devices, Healthcare Market, Market Analysis, Market Forecast, Market Size, Market Share, Competitive Landscape, ArjoHuntleigh AB, BTG International Ltd., AngioDynamics, Cardinal Health Inc., Stryker Corporation, EKOS Corp, DJO Global Inc., Boston Scientific Corp., Teleflex Inc., Xiangyu Medical, SYNYIAI, Huimei Technology, Lifotronic.
Parent Market: Healthcare Market (xx Million) Child Market: VTE Prevention and Treatment Solutions (xx Million in 2025)
VTE Prevention And Treatment Solutions Market Dynamics & Structure
The VTE Prevention and Treatment Solutions market is characterized by moderate concentration, with key players holding significant market share. Technological innovation, particularly in minimally invasive procedures and improved anticoagulants, is a major driver. Stringent regulatory frameworks and evolving reimbursement policies influence market dynamics. The market also witnesses competitive pressures from substitute therapies and ongoing M&A activity to expand product portfolios and market reach.
- Market Concentration: Moderately concentrated, with the top 5 players holding approximately xx% of the market share in 2025.
- Technological Innovation: Focus on minimally invasive techniques, smart devices for monitoring, and personalized medicine approaches.
- Regulatory Landscape: Stringent regulatory approvals for new products and therapies are crucial, impacting market entry and growth.
- Competitive Substitutes: Alternative therapies and treatment approaches present competitive challenges.
- End-User Demographics: Aging population and increasing prevalence of chronic diseases are key drivers of market growth.
- M&A Activity: xx M&A deals were recorded in the historical period (2019-2024), indicating significant consolidation within the market.
VTE Prevention And Treatment Solutions Growth Trends & Insights
The global VTE Prevention and Treatment Solutions market is experiencing robust growth, driven by rising prevalence of VTE, technological advancements, and increasing healthcare expenditure. The market size is projected to reach xx million by 2033, exhibiting a CAGR of xx% during the forecast period (2025-2033). Adoption rates for newer technologies, particularly minimally invasive procedures, are increasing steadily. Consumer behavior shifts towards proactive healthcare management and improved patient outcomes are also contributing to market expansion. Market penetration for novel anticoagulants and compression therapies is expected to increase significantly.
Dominant Regions, Countries, or Segments in VTE Prevention And Treatment Solutions
North America currently holds the largest market share, driven by high healthcare expenditure, advanced medical infrastructure, and early adoption of new technologies. Europe follows as a significant market, showcasing robust growth potential. Asia-Pacific is emerging as a high-growth region, fueled by increasing healthcare awareness, rising disposable incomes, and growing geriatric population.
- North America: High healthcare expenditure, advanced medical infrastructure, strong regulatory support.
- Europe: Well-established healthcare systems, increasing prevalence of VTE, focus on preventative care.
- Asia-Pacific: Rapidly growing economies, rising healthcare expenditure, increasing awareness about VTE.
VTE Prevention And Treatment Solutions Product Landscape
The product landscape encompasses a wide range of anticoagulants, compression therapy devices, thrombolytics, and diagnostic tools. Recent innovations focus on improved efficacy, reduced side effects, and enhanced patient convenience. Unique selling propositions often involve minimally invasive procedures, personalized treatment plans, and sophisticated monitoring systems. Technological advancements are continually improving the safety and effectiveness of VTE prevention and treatment solutions.
Key Drivers, Barriers & Challenges in VTE Prevention And Treatment Solutions
Key Drivers:
- Rising prevalence of VTE due to aging population and lifestyle factors.
- Technological advancements in minimally invasive procedures and drug delivery systems.
- Increasing healthcare expenditure and insurance coverage.
Challenges:
- High cost of treatment and limited access in developing countries.
- Potential side effects associated with certain anticoagulants.
- Stringent regulatory approvals and reimbursement hurdles.
- Intense competition from existing players and emerging technologies.
Emerging Opportunities in VTE Prevention And Treatment Solutions
- Development of novel, safer anticoagulants with reduced bleeding risks.
- Expansion into untapped markets in developing countries.
- Personalized medicine approaches tailored to individual patient characteristics.
- Integration of telemedicine and remote patient monitoring technologies.
Growth Accelerators in the VTE Prevention And Treatment Solutions Industry
Technological breakthroughs in drug delivery, diagnostic imaging, and minimally invasive procedures are major catalysts. Strategic partnerships between pharmaceutical companies and medical device manufacturers are driving innovation and market penetration. Expansion into emerging markets and focus on preventative care are creating significant growth opportunities.
Key Players Shaping the VTE Prevention And Treatment Solutions Market
- ArjoHuntleigh AB
- BTG International Ltd.
- AngioDynamics
- Cardinal Health Inc.
- Stryker Corporation
- EKOS Corp
- DJO Global Inc.
- Boston Scientific Corp.
- Teleflex Inc.
- Xiangyu Medical
- SYNYIAI
- Huimei Technology
- Lifotronic
Notable Milestones in VTE Prevention And Treatment Solutions Sector
- 2020: FDA approval of a novel anticoagulant with improved efficacy and reduced bleeding risk.
- 2021: Launch of a new generation of compression therapy devices with enhanced patient comfort.
- 2022: Strategic partnership between two major players to develop a combined VTE prevention and treatment solution.
- 2023: Publication of significant clinical trial data showcasing improved outcomes with a new therapy.
In-Depth VTE Prevention And Treatment Solutions Market Outlook
The VTE Prevention and Treatment Solutions market is poised for sustained growth, driven by ongoing technological advancements, expanding market penetration of new therapies, and increasing healthcare expenditure globally. Strategic partnerships, focus on preventative care, and expansion into emerging markets will continue to shape market dynamics in the coming years, presenting significant opportunities for growth and innovation.
Vte Prevention And Treatment Solutions Segmentation
-
1. Application
- 1.1. Hospital
- 1.2. Medical Institutions
- 1.3. Others
-
2. Type
- 2.1. VTE Prevention
- 2.2. VTE Treatment
Vte Prevention And Treatment Solutions Segmentation By Geography
-
1. North America
- 1.1. United States
- 1.2. Canada
- 1.3. Mexico
-
2. South America
- 2.1. Brazil
- 2.2. Argentina
- 2.3. Rest of South America
-
3. Europe
- 3.1. United Kingdom
- 3.2. Germany
- 3.3. France
- 3.4. Italy
- 3.5. Spain
- 3.6. Russia
- 3.7. Benelux
- 3.8. Nordics
- 3.9. Rest of Europe
-
4. Middle East & Africa
- 4.1. Turkey
- 4.2. Israel
- 4.3. GCC
- 4.4. North Africa
- 4.5. South Africa
- 4.6. Rest of Middle East & Africa
-
5. Asia Pacific
- 5.1. China
- 5.2. India
- 5.3. Japan
- 5.4. South Korea
- 5.5. ASEAN
- 5.6. Oceania
- 5.7. Rest of Asia Pacific
Vte Prevention And Treatment Solutions Regional Market Share
Geographic Coverage of Vte Prevention And Treatment Solutions
Vte Prevention And Treatment Solutions REPORT HIGHLIGHTS
| Aspects | Details |
|---|---|
| Study Period | 2020-2034 |
| Base Year | 2025 |
| Estimated Year | 2026 |
| Forecast Period | 2026-2034 |
| Historical Period | 2020-2025 |
| Growth Rate | CAGR of XXX% from 2020-2034 |
| Segmentation |
|
Table of Contents
- 1. Introduction
- 1.1. Research Scope
- 1.2. Market Segmentation
- 1.3. Research Methodology
- 1.4. Definitions and Assumptions
- 2. Executive Summary
- 2.1. Introduction
- 3. Market Dynamics
- 3.1. Introduction
- 3.2. Market Drivers
- 3.3. Market Restrains
- 3.4. Market Trends
- 4. Market Factor Analysis
- 4.1. Porters Five Forces
- 4.2. Supply/Value Chain
- 4.3. PESTEL analysis
- 4.4. Market Entropy
- 4.5. Patent/Trademark Analysis
- 5. Global Vte Prevention And Treatment Solutions Analysis, Insights and Forecast, 2020-2032
- 5.1. Market Analysis, Insights and Forecast - by Application
- 5.1.1. Hospital
- 5.1.2. Medical Institutions
- 5.1.3. Others
- 5.2. Market Analysis, Insights and Forecast - by Type
- 5.2.1. VTE Prevention
- 5.2.2. VTE Treatment
- 5.3. Market Analysis, Insights and Forecast - by Region
- 5.3.1. North America
- 5.3.2. South America
- 5.3.3. Europe
- 5.3.4. Middle East & Africa
- 5.3.5. Asia Pacific
- 5.1. Market Analysis, Insights and Forecast - by Application
- 6. North America Vte Prevention And Treatment Solutions Analysis, Insights and Forecast, 2020-2032
- 6.1. Market Analysis, Insights and Forecast - by Application
- 6.1.1. Hospital
- 6.1.2. Medical Institutions
- 6.1.3. Others
- 6.2. Market Analysis, Insights and Forecast - by Type
- 6.2.1. VTE Prevention
- 6.2.2. VTE Treatment
- 6.1. Market Analysis, Insights and Forecast - by Application
- 7. South America Vte Prevention And Treatment Solutions Analysis, Insights and Forecast, 2020-2032
- 7.1. Market Analysis, Insights and Forecast - by Application
- 7.1.1. Hospital
- 7.1.2. Medical Institutions
- 7.1.3. Others
- 7.2. Market Analysis, Insights and Forecast - by Type
- 7.2.1. VTE Prevention
- 7.2.2. VTE Treatment
- 7.1. Market Analysis, Insights and Forecast - by Application
- 8. Europe Vte Prevention And Treatment Solutions Analysis, Insights and Forecast, 2020-2032
- 8.1. Market Analysis, Insights and Forecast - by Application
- 8.1.1. Hospital
- 8.1.2. Medical Institutions
- 8.1.3. Others
- 8.2. Market Analysis, Insights and Forecast - by Type
- 8.2.1. VTE Prevention
- 8.2.2. VTE Treatment
- 8.1. Market Analysis, Insights and Forecast - by Application
- 9. Middle East & Africa Vte Prevention And Treatment Solutions Analysis, Insights and Forecast, 2020-2032
- 9.1. Market Analysis, Insights and Forecast - by Application
- 9.1.1. Hospital
- 9.1.2. Medical Institutions
- 9.1.3. Others
- 9.2. Market Analysis, Insights and Forecast - by Type
- 9.2.1. VTE Prevention
- 9.2.2. VTE Treatment
- 9.1. Market Analysis, Insights and Forecast - by Application
- 10. Asia Pacific Vte Prevention And Treatment Solutions Analysis, Insights and Forecast, 2020-2032
- 10.1. Market Analysis, Insights and Forecast - by Application
- 10.1.1. Hospital
- 10.1.2. Medical Institutions
- 10.1.3. Others
- 10.2. Market Analysis, Insights and Forecast - by Type
- 10.2.1. VTE Prevention
- 10.2.2. VTE Treatment
- 10.1. Market Analysis, Insights and Forecast - by Application
- 11. Competitive Analysis
- 11.1. Global Market Share Analysis 2025
- 11.2. Company Profiles
- 11.2.1 ArjoHuntleigh AB
- 11.2.1.1. Overview
- 11.2.1.2. Products
- 11.2.1.3. SWOT Analysis
- 11.2.1.4. Recent Developments
- 11.2.1.5. Financials (Based on Availability)
- 11.2.2 BTG International Ltd.
- 11.2.2.1. Overview
- 11.2.2.2. Products
- 11.2.2.3. SWOT Analysis
- 11.2.2.4. Recent Developments
- 11.2.2.5. Financials (Based on Availability)
- 11.2.3 AngioDynamics
- 11.2.3.1. Overview
- 11.2.3.2. Products
- 11.2.3.3. SWOT Analysis
- 11.2.3.4. Recent Developments
- 11.2.3.5. Financials (Based on Availability)
- 11.2.4 Cardinal Health Inc.
- 11.2.4.1. Overview
- 11.2.4.2. Products
- 11.2.4.3. SWOT Analysis
- 11.2.4.4. Recent Developments
- 11.2.4.5. Financials (Based on Availability)
- 11.2.5 Stryker Corporation
- 11.2.5.1. Overview
- 11.2.5.2. Products
- 11.2.5.3. SWOT Analysis
- 11.2.5.4. Recent Developments
- 11.2.5.5. Financials (Based on Availability)
- 11.2.6 EKOS Corp
- 11.2.6.1. Overview
- 11.2.6.2. Products
- 11.2.6.3. SWOT Analysis
- 11.2.6.4. Recent Developments
- 11.2.6.5. Financials (Based on Availability)
- 11.2.7 DJO Global Inc.
- 11.2.7.1. Overview
- 11.2.7.2. Products
- 11.2.7.3. SWOT Analysis
- 11.2.7.4. Recent Developments
- 11.2.7.5. Financials (Based on Availability)
- 11.2.8 Boston Scientific Corp.
- 11.2.8.1. Overview
- 11.2.8.2. Products
- 11.2.8.3. SWOT Analysis
- 11.2.8.4. Recent Developments
- 11.2.8.5. Financials (Based on Availability)
- 11.2.9 Teleflex Inc.
- 11.2.9.1. Overview
- 11.2.9.2. Products
- 11.2.9.3. SWOT Analysis
- 11.2.9.4. Recent Developments
- 11.2.9.5. Financials (Based on Availability)
- 11.2.10 Xiangyu Medical
- 11.2.10.1. Overview
- 11.2.10.2. Products
- 11.2.10.3. SWOT Analysis
- 11.2.10.4. Recent Developments
- 11.2.10.5. Financials (Based on Availability)
- 11.2.11 SYNYIAI
- 11.2.11.1. Overview
- 11.2.11.2. Products
- 11.2.11.3. SWOT Analysis
- 11.2.11.4. Recent Developments
- 11.2.11.5. Financials (Based on Availability)
- 11.2.12 Huimei Technology
- 11.2.12.1. Overview
- 11.2.12.2. Products
- 11.2.12.3. SWOT Analysis
- 11.2.12.4. Recent Developments
- 11.2.12.5. Financials (Based on Availability)
- 11.2.13 Lifotronic
- 11.2.13.1. Overview
- 11.2.13.2. Products
- 11.2.13.3. SWOT Analysis
- 11.2.13.4. Recent Developments
- 11.2.13.5. Financials (Based on Availability)
- 11.2.1 ArjoHuntleigh AB
List of Figures
- Figure 1: Global Vte Prevention And Treatment Solutions Revenue Breakdown (million, %) by Region 2025 & 2033
- Figure 2: North America Vte Prevention And Treatment Solutions Revenue (million), by Application 2025 & 2033
- Figure 3: North America Vte Prevention And Treatment Solutions Revenue Share (%), by Application 2025 & 2033
- Figure 4: North America Vte Prevention And Treatment Solutions Revenue (million), by Type 2025 & 2033
- Figure 5: North America Vte Prevention And Treatment Solutions Revenue Share (%), by Type 2025 & 2033
- Figure 6: North America Vte Prevention And Treatment Solutions Revenue (million), by Country 2025 & 2033
- Figure 7: North America Vte Prevention And Treatment Solutions Revenue Share (%), by Country 2025 & 2033
- Figure 8: South America Vte Prevention And Treatment Solutions Revenue (million), by Application 2025 & 2033
- Figure 9: South America Vte Prevention And Treatment Solutions Revenue Share (%), by Application 2025 & 2033
- Figure 10: South America Vte Prevention And Treatment Solutions Revenue (million), by Type 2025 & 2033
- Figure 11: South America Vte Prevention And Treatment Solutions Revenue Share (%), by Type 2025 & 2033
- Figure 12: South America Vte Prevention And Treatment Solutions Revenue (million), by Country 2025 & 2033
- Figure 13: South America Vte Prevention And Treatment Solutions Revenue Share (%), by Country 2025 & 2033
- Figure 14: Europe Vte Prevention And Treatment Solutions Revenue (million), by Application 2025 & 2033
- Figure 15: Europe Vte Prevention And Treatment Solutions Revenue Share (%), by Application 2025 & 2033
- Figure 16: Europe Vte Prevention And Treatment Solutions Revenue (million), by Type 2025 & 2033
- Figure 17: Europe Vte Prevention And Treatment Solutions Revenue Share (%), by Type 2025 & 2033
- Figure 18: Europe Vte Prevention And Treatment Solutions Revenue (million), by Country 2025 & 2033
- Figure 19: Europe Vte Prevention And Treatment Solutions Revenue Share (%), by Country 2025 & 2033
- Figure 20: Middle East & Africa Vte Prevention And Treatment Solutions Revenue (million), by Application 2025 & 2033
- Figure 21: Middle East & Africa Vte Prevention And Treatment Solutions Revenue Share (%), by Application 2025 & 2033
- Figure 22: Middle East & Africa Vte Prevention And Treatment Solutions Revenue (million), by Type 2025 & 2033
- Figure 23: Middle East & Africa Vte Prevention And Treatment Solutions Revenue Share (%), by Type 2025 & 2033
- Figure 24: Middle East & Africa Vte Prevention And Treatment Solutions Revenue (million), by Country 2025 & 2033
- Figure 25: Middle East & Africa Vte Prevention And Treatment Solutions Revenue Share (%), by Country 2025 & 2033
- Figure 26: Asia Pacific Vte Prevention And Treatment Solutions Revenue (million), by Application 2025 & 2033
- Figure 27: Asia Pacific Vte Prevention And Treatment Solutions Revenue Share (%), by Application 2025 & 2033
- Figure 28: Asia Pacific Vte Prevention And Treatment Solutions Revenue (million), by Type 2025 & 2033
- Figure 29: Asia Pacific Vte Prevention And Treatment Solutions Revenue Share (%), by Type 2025 & 2033
- Figure 30: Asia Pacific Vte Prevention And Treatment Solutions Revenue (million), by Country 2025 & 2033
- Figure 31: Asia Pacific Vte Prevention And Treatment Solutions Revenue Share (%), by Country 2025 & 2033
List of Tables
- Table 1: Global Vte Prevention And Treatment Solutions Revenue million Forecast, by Application 2020 & 2033
- Table 2: Global Vte Prevention And Treatment Solutions Revenue million Forecast, by Type 2020 & 2033
- Table 3: Global Vte Prevention And Treatment Solutions Revenue million Forecast, by Region 2020 & 2033
- Table 4: Global Vte Prevention And Treatment Solutions Revenue million Forecast, by Application 2020 & 2033
- Table 5: Global Vte Prevention And Treatment Solutions Revenue million Forecast, by Type 2020 & 2033
- Table 6: Global Vte Prevention And Treatment Solutions Revenue million Forecast, by Country 2020 & 2033
- Table 7: United States Vte Prevention And Treatment Solutions Revenue (million) Forecast, by Application 2020 & 2033
- Table 8: Canada Vte Prevention And Treatment Solutions Revenue (million) Forecast, by Application 2020 & 2033
- Table 9: Mexico Vte Prevention And Treatment Solutions Revenue (million) Forecast, by Application 2020 & 2033
- Table 10: Global Vte Prevention And Treatment Solutions Revenue million Forecast, by Application 2020 & 2033
- Table 11: Global Vte Prevention And Treatment Solutions Revenue million Forecast, by Type 2020 & 2033
- Table 12: Global Vte Prevention And Treatment Solutions Revenue million Forecast, by Country 2020 & 2033
- Table 13: Brazil Vte Prevention And Treatment Solutions Revenue (million) Forecast, by Application 2020 & 2033
- Table 14: Argentina Vte Prevention And Treatment Solutions Revenue (million) Forecast, by Application 2020 & 2033
- Table 15: Rest of South America Vte Prevention And Treatment Solutions Revenue (million) Forecast, by Application 2020 & 2033
- Table 16: Global Vte Prevention And Treatment Solutions Revenue million Forecast, by Application 2020 & 2033
- Table 17: Global Vte Prevention And Treatment Solutions Revenue million Forecast, by Type 2020 & 2033
- Table 18: Global Vte Prevention And Treatment Solutions Revenue million Forecast, by Country 2020 & 2033
- Table 19: United Kingdom Vte Prevention And Treatment Solutions Revenue (million) Forecast, by Application 2020 & 2033
- Table 20: Germany Vte Prevention And Treatment Solutions Revenue (million) Forecast, by Application 2020 & 2033
- Table 21: France Vte Prevention And Treatment Solutions Revenue (million) Forecast, by Application 2020 & 2033
- Table 22: Italy Vte Prevention And Treatment Solutions Revenue (million) Forecast, by Application 2020 & 2033
- Table 23: Spain Vte Prevention And Treatment Solutions Revenue (million) Forecast, by Application 2020 & 2033
- Table 24: Russia Vte Prevention And Treatment Solutions Revenue (million) Forecast, by Application 2020 & 2033
- Table 25: Benelux Vte Prevention And Treatment Solutions Revenue (million) Forecast, by Application 2020 & 2033
- Table 26: Nordics Vte Prevention And Treatment Solutions Revenue (million) Forecast, by Application 2020 & 2033
- Table 27: Rest of Europe Vte Prevention And Treatment Solutions Revenue (million) Forecast, by Application 2020 & 2033
- Table 28: Global Vte Prevention And Treatment Solutions Revenue million Forecast, by Application 2020 & 2033
- Table 29: Global Vte Prevention And Treatment Solutions Revenue million Forecast, by Type 2020 & 2033
- Table 30: Global Vte Prevention And Treatment Solutions Revenue million Forecast, by Country 2020 & 2033
- Table 31: Turkey Vte Prevention And Treatment Solutions Revenue (million) Forecast, by Application 2020 & 2033
- Table 32: Israel Vte Prevention And Treatment Solutions Revenue (million) Forecast, by Application 2020 & 2033
- Table 33: GCC Vte Prevention And Treatment Solutions Revenue (million) Forecast, by Application 2020 & 2033
- Table 34: North Africa Vte Prevention And Treatment Solutions Revenue (million) Forecast, by Application 2020 & 2033
- Table 35: South Africa Vte Prevention And Treatment Solutions Revenue (million) Forecast, by Application 2020 & 2033
- Table 36: Rest of Middle East & Africa Vte Prevention And Treatment Solutions Revenue (million) Forecast, by Application 2020 & 2033
- Table 37: Global Vte Prevention And Treatment Solutions Revenue million Forecast, by Application 2020 & 2033
- Table 38: Global Vte Prevention And Treatment Solutions Revenue million Forecast, by Type 2020 & 2033
- Table 39: Global Vte Prevention And Treatment Solutions Revenue million Forecast, by Country 2020 & 2033
- Table 40: China Vte Prevention And Treatment Solutions Revenue (million) Forecast, by Application 2020 & 2033
- Table 41: India Vte Prevention And Treatment Solutions Revenue (million) Forecast, by Application 2020 & 2033
- Table 42: Japan Vte Prevention And Treatment Solutions Revenue (million) Forecast, by Application 2020 & 2033
- Table 43: South Korea Vte Prevention And Treatment Solutions Revenue (million) Forecast, by Application 2020 & 2033
- Table 44: ASEAN Vte Prevention And Treatment Solutions Revenue (million) Forecast, by Application 2020 & 2033
- Table 45: Oceania Vte Prevention And Treatment Solutions Revenue (million) Forecast, by Application 2020 & 2033
- Table 46: Rest of Asia Pacific Vte Prevention And Treatment Solutions Revenue (million) Forecast, by Application 2020 & 2033
Frequently Asked Questions
1. What is the projected Compound Annual Growth Rate (CAGR) of the Vte Prevention And Treatment Solutions?
The projected CAGR is approximately XXX%.
2. Which companies are prominent players in the Vte Prevention And Treatment Solutions?
Key companies in the market include ArjoHuntleigh AB, BTG International Ltd., AngioDynamics, Cardinal Health Inc., Stryker Corporation, EKOS Corp, DJO Global Inc., Boston Scientific Corp., Teleflex Inc., Xiangyu Medical, SYNYIAI, Huimei Technology, Lifotronic.
3. What are the main segments of the Vte Prevention And Treatment Solutions?
The market segments include Application, Type.
4. Can you provide details about the market size?
The market size is estimated to be USD XXX million as of 2022.
5. What are some drivers contributing to market growth?
N/A
6. What are the notable trends driving market growth?
N/A
7. Are there any restraints impacting market growth?
N/A
8. Can you provide examples of recent developments in the market?
N/A
9. What pricing options are available for accessing the report?
Pricing options include single-user, multi-user, and enterprise licenses priced at USD 2900.00, USD 4350.00, and USD 5800.00 respectively.
10. Is the market size provided in terms of value or volume?
The market size is provided in terms of value, measured in million.
11. Are there any specific market keywords associated with the report?
Yes, the market keyword associated with the report is "Vte Prevention And Treatment Solutions," which aids in identifying and referencing the specific market segment covered.
12. How do I determine which pricing option suits my needs best?
The pricing options vary based on user requirements and access needs. Individual users may opt for single-user licenses, while businesses requiring broader access may choose multi-user or enterprise licenses for cost-effective access to the report.
13. Are there any additional resources or data provided in the Vte Prevention And Treatment Solutions report?
While the report offers comprehensive insights, it's advisable to review the specific contents or supplementary materials provided to ascertain if additional resources or data are available.
14. How can I stay updated on further developments or reports in the Vte Prevention And Treatment Solutions?
To stay informed about further developments, trends, and reports in the Vte Prevention And Treatment Solutions, consider subscribing to industry newsletters, following relevant companies and organizations, or regularly checking reputable industry news sources and publications.
Methodology
Step 1 - Identification of Relevant Samples Size from Population Database


Step 2 - Approaches for Defining Global Market Size (Value, Volume* & Price*)

Note*: In applicable scenarios
Step 3 - Data Sources
Primary Research
- Web Analytics
- Survey Reports
- Research Institute
- Latest Research Reports
- Opinion Leaders
Secondary Research
- Annual Reports
- White Paper
- Latest Press Release
- Industry Association
- Paid Database
- Investor Presentations

Step 4 - Data Triangulation
Involves using different sources of information in order to increase the validity of a study
These sources are likely to be stakeholders in a program - participants, other researchers, program staff, other community members, and so on.
Then we put all data in single framework & apply various statistical tools to find out the dynamic on the market.
During the analysis stage, feedback from the stakeholder groups would be compared to determine areas of agreement as well as areas of divergence