

Key Insights
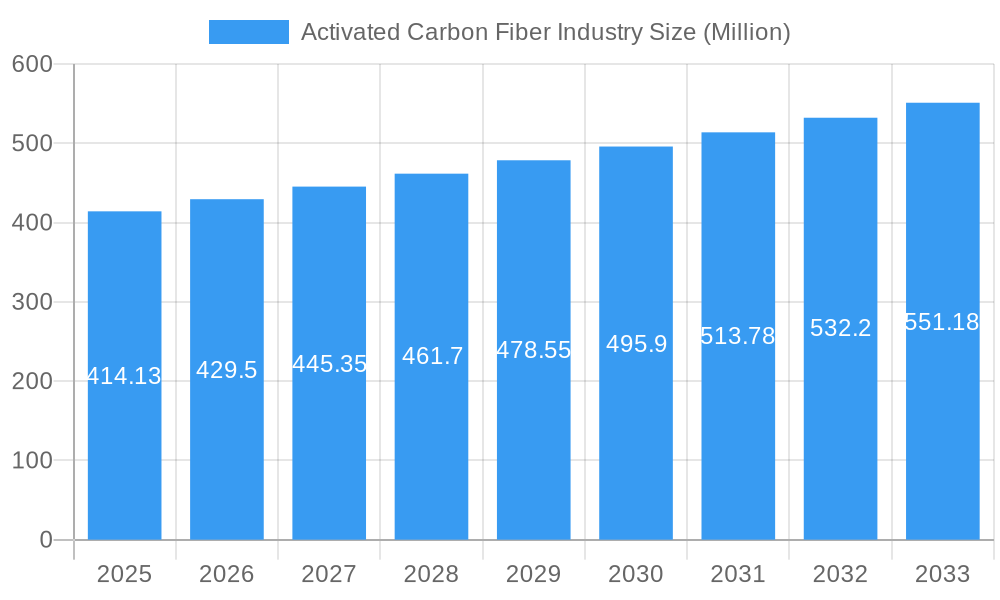
The global Activated Carbon Fiber (ACF) market is poised for steady expansion, projected to reach a valuation of approximately $414.13 million by 2025. This growth is underpinned by a Compound Annual Growth Rate (CAGR) of 3.71% over the forecast period of 2025-2033. The inherent versatility and superior adsorption capabilities of ACF are driving its adoption across a diverse range of high-demand applications. Key growth engines include the burgeoning need for advanced purification solutions in both industrial and environmental sectors, stemming from increasingly stringent regulations concerning air and water quality. Furthermore, the critical role of ACF in chemical separation and catalysis, where its high surface area and specific pore structures facilitate efficient reactions and separations, will continue to fuel market expansion. The demand for robust protective clothing, especially in hazardous environments, and the increasing integration of ACF in next-generation medical devices, such as wound dressings and drug delivery systems, also contribute significantly to market momentum. The burgeoning field of energy storage, particularly in supercapacitors, represents another substantial growth avenue, driven by the global push towards sustainable energy solutions and efficient power management.
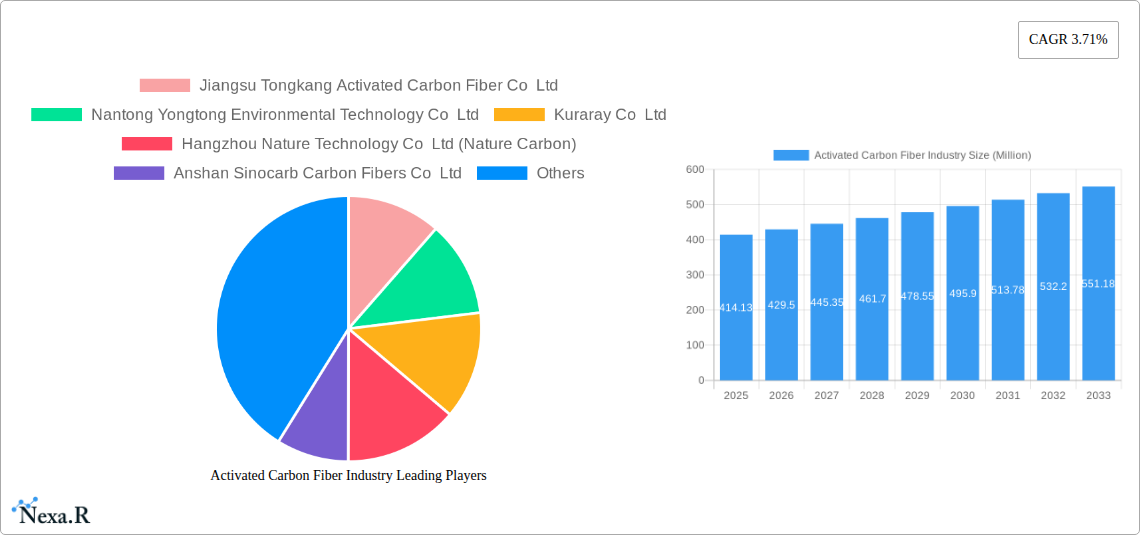
Activated Carbon Fiber Industry Market Size (In Million)
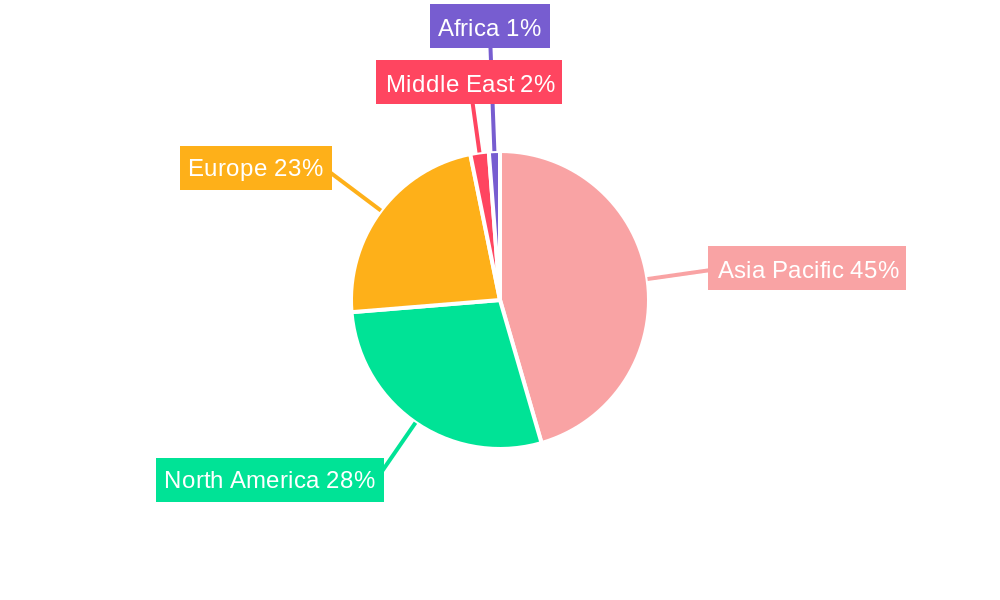
The ACF market exhibits a dynamic landscape shaped by evolving raw material sources and an expanding application spectrum. While synthetic fibers, including pitch-based, PAN-based, and phenolic-based materials, currently dominate, there is a growing interest in natural fiber-based ACF due to sustainability concerns and cost-effectiveness. The market's segmentation highlights the widespread utility of ACF, with purification and chemical separation applications leading the charge. The growth in protective clothing and medical applications is directly correlated with advancements in material science and the increasing emphasis on safety and healthcare. The rapid development of energy storage technologies, especially supercapacitors, is a significant trend, promising substantial growth in the coming years. Geographically, the Asia Pacific region, particularly China and India, is expected to remain a dominant force, driven by robust industrial growth, increasing environmental awareness, and significant investments in manufacturing. North America and Europe will also contribute substantially to market growth, propelled by technological innovation and stringent regulatory frameworks. Emerging economies in the Middle East and South Africa present nascent but promising opportunities for market penetration.
Activated Carbon Fiber Industry Company Market Share
Here is a comprehensive, SEO-optimized report description for the Activated Carbon Fiber Industry, meticulously crafted to meet your requirements.
Activated Carbon Fiber Industry Market Dynamics & Structure
The Activated Carbon Fiber (ACF) industry is characterized by a moderately concentrated market, driven by escalating demand for advanced filtration and purification solutions across diverse sectors. Technological innovation remains a pivotal driver, with ongoing research focused on enhancing adsorption capacities, developing novel precursor materials, and optimizing production processes for cost-efficiency. Regulatory frameworks, particularly those related to environmental protection and air/water quality standards, are increasingly influencing market growth, pushing industries to adopt superior filtration technologies. Competitive product substitutes, such as granular activated carbon and zeolites, present a notable challenge, necessitating continuous product development and differentiation by ACF manufacturers. End-user demographics are shifting towards industries with stringent environmental compliance requirements and advanced technological needs, including electronics, healthcare, and energy storage. Mergers and acquisitions (M&A) trends are observed as key players seek to consolidate market share, acquire proprietary technologies, and expand their global reach. For instance, the base year of 2025 is anticipated to see a flurry of strategic alliances as companies aim to capture a larger portion of the estimated $2,500 Million market. Innovation barriers, such as the high cost of specialized precursor materials and the complex manufacturing processes, are significant but are being addressed through collaborative R&D initiatives.
- Market Concentration: Moderately concentrated with key players dominating specific application segments.
- Technological Innovation Drivers: Enhanced adsorption, novel precursor materials, process optimization.
- Regulatory Frameworks: Environmental standards, air and water quality mandates.
- Competitive Product Substitutes: Granular activated carbon, zeolites.
- End-User Demographics: Environmental compliance industries, healthcare, energy storage, electronics.
- M&A Trends: Consolidation of market share, technology acquisition, global expansion.
- Innovation Barriers: High precursor costs, complex manufacturing.
Activated Carbon Fiber Industry Growth Trends & Insights
The Activated Carbon Fiber (ACF) industry is poised for robust expansion, driven by a confluence of factors that are reshaping global demand and technological landscapes. The market size, projected to reach approximately $4,500 Million by 2033 from an estimated $2,500 Million in the base year of 2025, signifies a substantial compound annual growth rate (CAGR) of around xx%. This impressive growth is fueled by the escalating global emphasis on environmental sustainability and the increasing stringency of pollution control regulations. Adoption rates for ACF are steadily rising across various applications, from industrial emissions control and water purification to advanced medical devices and high-performance energy storage solutions. The unique properties of ACF, including its high surface area, microporous structure, and excellent electrical conductivity, make it an indispensable material for tackling complex separation and purification challenges.
Technological disruptions are continuously innovating the ACF landscape. Advancements in precursor material synthesis, such as the development of advanced pitch-based and PAN-based fibers, are leading to enhanced performance characteristics and cost reductions. Furthermore, research into novel activation methods and surface modifications is opening up new application frontiers. For example, the integration of ACF into supercapacitors is revolutionizing energy storage technology, offering higher energy density and faster charging capabilities. Consumer behavior shifts are also playing a significant role. Growing awareness among both industrial consumers and the general public regarding the detrimental effects of pollution is driving demand for cleaner technologies and products. This trend is particularly evident in the demand for ACF in air purifiers, water filters, and personal protective equipment. The historical period from 2019 to 2024 witnessed consistent growth, laying a strong foundation for the accelerated expansion anticipated in the forecast period of 2025–2033. The estimated year of 2025 is set to be a pivotal point, with the market already demonstrating its capacity for significant value creation.
- Market Size Evolution: Projected to grow from an estimated $2,500 Million in 2025 to $4,500 Million by 2033.
- CAGR: Anticipated to be around xx% during the forecast period.
- Adoption Rates: Steadily increasing across purification, medical, and energy storage sectors.
- Technological Disruptions: Innovations in precursor materials (pitch, PAN), activation methods, and surface modifications.
- Consumer Behavior Shifts: Growing demand for sustainable technologies and products, influenced by environmental awareness.
- Market Penetration: Deepening penetration in industrial, environmental, and advanced technology applications.
- Historical Growth (2019-2024): Consistent upward trend establishing a strong market foundation.
Dominant Regions, Countries, or Segments in Activated Carbon Fiber Industry
The Activated Carbon Fiber (ACF) industry's dominance is multifaceted, with distinct regions, countries, and application segments leading market growth. Asia-Pacific, particularly China, is a powerhouse in ACF production and consumption. This dominance is attributed to a robust industrial manufacturing base, extensive environmental regulations, and significant government support for advanced materials. The country's sheer scale of manufacturing across sectors like textiles, electronics, and automotive directly translates into a massive demand for purification and separation solutions provided by ACF. China's capacity in producing synthetic raw materials, especially pitch-based and PAN-based ACF, further solidifies its leadership. The Purification application segment is the undisputed leader, accounting for an estimated 60% of the global ACF market share in 2025. This segment encompasses air and water purification for industrial processes, municipal water treatment, and household air purifiers, all of which are experiencing unprecedented demand due to global environmental concerns.
Within the raw material segment, Synthetic ACF, predominantly Pitch-based and Pan-based, commands the largest market share, estimated at over 90%. These synthetic precursors offer superior control over pore structure and performance characteristics compared to natural alternatives, making them ideal for high-end applications. The Chemical Separation and Catalysis segment is another significant growth engine, driven by the chemical and petrochemical industries' need for efficient separation processes and catalytic support. The growth in this segment is further propelled by advancements in catalyst design that leverage the unique surface properties of ACF. Countries like Japan and South Korea also play crucial roles, particularly in the development of high-performance ACF for niche applications such as Super Capacitors and Medical devices. Japan's technological prowess in advanced materials has led to significant contributions in ACF development for energy storage. The Medical application, though smaller in market share currently, is projected for substantial growth, driven by advancements in wound dressings, drug delivery systems, and hemodialysis filters, with an estimated market size of $350 Million in 2025.
- Dominant Region: Asia-Pacific, led by China.
- Dominant Country (Production & Consumption): China.
- Key Drivers in Asia-Pacific: Strong industrial base, stringent environmental regulations, government support, advanced material manufacturing capabilities.
- Dominant Application Segment: Purification (estimated 60% market share in 2025).
- Key Drivers in Purification: Environmental concerns, industrial emissions control, water treatment, air filtration.
- Dominant Raw Material Segment: Synthetic (Pitch-based, PAN-based) (estimated over 90% market share).
- Key Drivers in Synthetic Raw Materials: Tailored pore structure, superior performance, cost-effectiveness for high-end applications.
- Significant Application Segments: Chemical Separation and Catalysis, Super Capacitors, Medical.
- Growth Potential in Medical Applications: Estimated market size of $350 Million in 2025.
- Key Contributors in Advanced Applications: Japan and South Korea.
Activated Carbon Fiber Industry Product Landscape
The Activated Carbon Fiber (ACF) product landscape is characterized by continuous innovation, focusing on tailoring material properties for specific, high-performance applications. Manufacturers are increasingly developing ACF with tailored pore size distributions, surface functionalities, and activated properties to achieve superior adsorption kinetics and capacities. Key product innovations include enhanced ACF for gas separation in industrial processes, ultra-fine ACF for medical filtration, and high-conductivity ACF composites for next-generation supercapacitors. For instance, advancements in pitch-based ACF have yielded products with exceptional surface areas exceeding 2,500 m²/g, making them ideal for volatile organic compound (VOC) capture. The unique selling proposition of ACF lies in its high surface area-to-volume ratio, lightweight nature, and rapid adsorption/desorption capabilities compared to traditional granular activated carbon. Technological advancements are also extending into the functionalization of ACF surfaces, enabling selective adsorption of specific pollutants or catalytic activity for chemical reactions.
Key Drivers, Barriers & Challenges in Activated Carbon Fiber Industry
Key Drivers:
The Activated Carbon Fiber (ACF) industry is propelled by a trifecta of powerful drivers: increasing global environmental consciousness and stringent regulations mandating cleaner air and water are the primary catalysts. The escalating demand for high-performance materials in advanced applications like energy storage (supercapacitors) and healthcare (medical filters) is also a significant growth accelerant. Furthermore, ongoing technological advancements in precursor materials and manufacturing processes are leading to more efficient, cost-effective, and versatile ACF products.
Barriers & Challenges:
Despite the promising outlook, the ACF market faces several significant hurdles. High production costs associated with specialized precursor materials and complex manufacturing processes remain a primary barrier to widespread adoption, particularly in price-sensitive markets. Developing and scaling up novel activation techniques requires substantial capital investment. Supply chain vulnerabilities for key raw materials can also pose challenges. Regulatory hurdles, while driving demand, can also introduce complexities in compliance for new product development. Competitive pressures from established activated carbon alternatives like granular activated carbon and zeolites, which often have lower price points, necessitate continuous innovation and value proposition demonstration for ACF. The estimated market share of granular activated carbon, while not directly competing in all ACF niches, represents a significant alternative in broad purification applications, impacting ACF's penetration.
Emerging Opportunities in Activated Carbon Fiber Industry
Emerging opportunities in the Activated Carbon Fiber (ACF) industry are predominantly centered on untapped applications and evolving consumer preferences for sustainable solutions. The burgeoning demand for advanced air and water purification systems in residential and commercial buildings presents a significant market. Furthermore, the rapid growth of the electric vehicle (EV) market is creating substantial demand for high-performance ACF in supercapacitors and battery components, offering faster charging and extended range. The healthcare sector continues to be a fertile ground for innovation, with ACF showing promise in advanced drug delivery systems, wearable health monitoring devices, and more efficient hemodialysis membranes, with a projected market value of $400 Million by 2028. There's also growing interest in ACF for environmental remediation of soil and industrial wastewater, particularly for persistent organic pollutants.
Growth Accelerators in the Activated Carbon Fiber Industry Industry
Several catalysts are accelerating the long-term growth trajectory of the Activated Carbon Fiber (ACF) industry. Breakthroughs in material science are enabling the development of ACF with enhanced selectivity, capacity, and durability, opening doors to novel applications. Strategic partnerships between ACF manufacturers and end-users in sectors like renewable energy and advanced manufacturing are fostering co-development and accelerating market penetration. For instance, collaborations focused on integrating ACF into next-generation battery technologies are a key growth accelerator. Market expansion strategies, including the establishment of manufacturing facilities in high-growth regions and the development of tailored product portfolios for specific regional needs, are also playing a crucial role. The increasing adoption of Industry 4.0 principles in ACF production is enhancing efficiency and quality control, further driving growth.
Key Players Shaping the Activated Carbon Fiber Industry Market
- Jiangsu Tongkang Activated Carbon Fiber Co Ltd
- Nantong Yongtong Environmental Technology Co Ltd
- Kuraray Co Ltd
- Hangzhou Nature Technology Co Ltd (Nature Carbon)
- Anshan Sinocarb Carbon Fibers Co Ltd
- Unitika LTD
- China Beihai Fiberglass Co Ltd
- Toyobo Co Ltd
- Osaka Gas Chemicals Co Ltd
- Evertech Envisafe Ecology Co Ltd
- HPMS Graphite
Notable Milestones in Activated Carbon Fiber Industry Sector
- 2019: Increased investment in R&D for PAN-based ACF for high-performance applications.
- 2020: Launch of new ACF formulations for advanced air filtration systems addressing emerging air quality concerns.
- 2021: Significant advancements in pitch-based ACF production leading to cost reductions and wider applicability.
- 2022: Growing adoption of ACF in supercapacitor technology, demonstrating improved energy density and cycle life.
- 2023: Emergence of new players focusing on sustainable manufacturing processes for ACF.
- 2024: Increased collaborations between ACF manufacturers and research institutions to explore novel applications in the medical field.
- 2025 (Projected): Anticipated breakthroughs in functionalized ACF for selective pollutant removal and catalytic processes.
- 2026-2033 (Projected): Continued expansion of ACF in energy storage, healthcare, and advanced industrial purification sectors.
In-Depth Activated Carbon Fiber Industry Market Outlook
The future of the Activated Carbon Fiber (ACF) industry is exceptionally bright, characterized by sustained growth driven by technological advancements and critical global needs. Growth accelerators, including the relentless pursuit of sustainable environmental solutions and the burgeoning demand for high-performance materials in emerging technologies like electric vehicles and advanced medical devices, are setting a robust trajectory. Strategic partnerships and market expansion initiatives will further solidify the industry's reach. The ACF market is expected to continue its upward climb, driven by innovation that delivers superior adsorption, filtration, and energy storage capabilities, making it an indispensable material for a cleaner and more technologically advanced future. The estimated market size in the forecast period is poised to witness significant value creation, offering substantial opportunities for stakeholders.
Activated Carbon Fiber Industry Segmentation
-
1. Raw Material
- 1.1. Natural
-
1.2. Synthetic
- 1.2.1. Pitch-based
- 1.2.2. Pan-based
- 1.2.3. Phenolic-based
- 1.2.4. Viscose-based
- 1.2.5. Other Materials
-
2. Application
- 2.1. Purification
- 2.2. Chemical Separation and Catalysis
- 2.3. Protective Clothing
- 2.4. Medical
- 2.5. Super Capacitors
- 2.6. Other Applications
Activated Carbon Fiber Industry Segmentation By Geography
-
1. Asia Pacific
- 1.1. China
- 1.2. India
- 1.3. Japan
- 1.4. South Korea
- 1.5. Rest of Asia Pacific
-
2. North America
- 2.1. United States
- 2.2. Mexico
- 2.3. Canada
-
3. Europe
- 3.1. Germany
- 3.2. United Kingdom
- 3.3. France
- 3.4. Italy
- 3.5. Rest of Europe
- 4. Middle East
-
5. Saudi Arabia
- 5.1. South Africa
- 5.2. Rest of Middle East
Activated Carbon Fiber Industry Regional Market Share
Geographic Coverage of Activated Carbon Fiber Industry
Activated Carbon Fiber Industry REPORT HIGHLIGHTS
| Aspects | Details |
|---|---|
| Study Period | 2020-2034 |
| Base Year | 2025 |
| Estimated Year | 2026 |
| Forecast Period | 2026-2034 |
| Historical Period | 2020-2025 |
| Growth Rate | CAGR of 3.71% from 2020-2034 |
| Segmentation |
|
Table of Contents
- 1. Introduction
- 1.1. Research Scope
- 1.2. Market Segmentation
- 1.3. Research Objective
- 1.4. Definitions and Assumptions
- 2. Executive Summary
- 2.1. Market Snapshot
- 3. Market Dynamics
- 3.1. Market Drivers
- 3.2. Market Restrains
- 3.3. Market Trends
- 3.4. Market Opportunities
- 4. Market Factor Analysis
- 4.1. Porters Five Forces
- 4.1.1. Bargaining Power of Suppliers
- 4.1.2. Bargaining Power of Buyers
- 4.1.3. Threat of New Entrants
- 4.1.4. Threat of Substitutes
- 4.1.5. Competitive Rivalry
- 4.2. PESTEL analysis
- 4.3. BCG Analysis
- 4.3.1. Stars (High Growth, High Market Share)
- 4.3.2. Cash Cows (Low Growth, High Market Share)
- 4.3.3. Question Mark (High Growth, Low Market Share)
- 4.3.4. Dogs (Low Growth, Low Market Share)
- 4.4. Ansoff Matrix Analysis
- 4.5. Supply Chain Analysis
- 4.6. Regulatory Landscape
- 4.7. Current Market Potential and Opportunity Assessment (TAM–SAM–SOM Framework)
- 4.8. NRP Analyst Note
- 4.1. Porters Five Forces
- 5. Market Analysis, Insights and Forecast 2021-2033
- 5.1. Market Analysis, Insights and Forecast - by Raw Material
- 5.1.1. Natural
- 5.1.2. Synthetic
- 5.1.2.1. Pitch-based
- 5.1.2.2. Pan-based
- 5.1.2.3. Phenolic-based
- 5.1.2.4. Viscose-based
- 5.1.2.5. Other Materials
- 5.2. Market Analysis, Insights and Forecast - by Application
- 5.2.1. Purification
- 5.2.2. Chemical Separation and Catalysis
- 5.2.3. Protective Clothing
- 5.2.4. Medical
- 5.2.5. Super Capacitors
- 5.2.6. Other Applications
- 5.3. Market Analysis, Insights and Forecast - by Region
- 5.3.1. Asia Pacific
- 5.3.2. North America
- 5.3.3. Europe
- 5.3.4. Middle East
- 5.3.5. Saudi Arabia
- 5.1. Market Analysis, Insights and Forecast - by Raw Material
- 6. Global Activated Carbon Fiber Industry Analysis, Insights and Forecast, 2021-2033
- 6.1. Market Analysis, Insights and Forecast - by Raw Material
- 6.1.1. Natural
- 6.1.2. Synthetic
- 6.1.2.1. Pitch-based
- 6.1.2.2. Pan-based
- 6.1.2.3. Phenolic-based
- 6.1.2.4. Viscose-based
- 6.1.2.5. Other Materials
- 6.2. Market Analysis, Insights and Forecast - by Application
- 6.2.1. Purification
- 6.2.2. Chemical Separation and Catalysis
- 6.2.3. Protective Clothing
- 6.2.4. Medical
- 6.2.5. Super Capacitors
- 6.2.6. Other Applications
- 6.1. Market Analysis, Insights and Forecast - by Raw Material
- 7. Asia Pacific Activated Carbon Fiber Industry Analysis, Insights and Forecast, 2020-2032
- 7.1. Market Analysis, Insights and Forecast - by Raw Material
- 7.1.1. Natural
- 7.1.2. Synthetic
- 7.1.2.1. Pitch-based
- 7.1.2.2. Pan-based
- 7.1.2.3. Phenolic-based
- 7.1.2.4. Viscose-based
- 7.1.2.5. Other Materials
- 7.2. Market Analysis, Insights and Forecast - by Application
- 7.2.1. Purification
- 7.2.2. Chemical Separation and Catalysis
- 7.2.3. Protective Clothing
- 7.2.4. Medical
- 7.2.5. Super Capacitors
- 7.2.6. Other Applications
- 7.1. Market Analysis, Insights and Forecast - by Raw Material
- 8. North America Activated Carbon Fiber Industry Analysis, Insights and Forecast, 2020-2032
- 8.1. Market Analysis, Insights and Forecast - by Raw Material
- 8.1.1. Natural
- 8.1.2. Synthetic
- 8.1.2.1. Pitch-based
- 8.1.2.2. Pan-based
- 8.1.2.3. Phenolic-based
- 8.1.2.4. Viscose-based
- 8.1.2.5. Other Materials
- 8.2. Market Analysis, Insights and Forecast - by Application
- 8.2.1. Purification
- 8.2.2. Chemical Separation and Catalysis
- 8.2.3. Protective Clothing
- 8.2.4. Medical
- 8.2.5. Super Capacitors
- 8.2.6. Other Applications
- 8.1. Market Analysis, Insights and Forecast - by Raw Material
- 9. Europe Activated Carbon Fiber Industry Analysis, Insights and Forecast, 2020-2032
- 9.1. Market Analysis, Insights and Forecast - by Raw Material
- 9.1.1. Natural
- 9.1.2. Synthetic
- 9.1.2.1. Pitch-based
- 9.1.2.2. Pan-based
- 9.1.2.3. Phenolic-based
- 9.1.2.4. Viscose-based
- 9.1.2.5. Other Materials
- 9.2. Market Analysis, Insights and Forecast - by Application
- 9.2.1. Purification
- 9.2.2. Chemical Separation and Catalysis
- 9.2.3. Protective Clothing
- 9.2.4. Medical
- 9.2.5. Super Capacitors
- 9.2.6. Other Applications
- 9.1. Market Analysis, Insights and Forecast - by Raw Material
- 10. Middle East Activated Carbon Fiber Industry Analysis, Insights and Forecast, 2020-2032
- 10.1. Market Analysis, Insights and Forecast - by Raw Material
- 10.1.1. Natural
- 10.1.2. Synthetic
- 10.1.2.1. Pitch-based
- 10.1.2.2. Pan-based
- 10.1.2.3. Phenolic-based
- 10.1.2.4. Viscose-based
- 10.1.2.5. Other Materials
- 10.2. Market Analysis, Insights and Forecast - by Application
- 10.2.1. Purification
- 10.2.2. Chemical Separation and Catalysis
- 10.2.3. Protective Clothing
- 10.2.4. Medical
- 10.2.5. Super Capacitors
- 10.2.6. Other Applications
- 10.1. Market Analysis, Insights and Forecast - by Raw Material
- 11. Saudi Arabia Activated Carbon Fiber Industry Analysis, Insights and Forecast, 2020-2032
- 11.1. Market Analysis, Insights and Forecast - by Raw Material
- 11.1.1. Natural
- 11.1.2. Synthetic
- 11.1.2.1. Pitch-based
- 11.1.2.2. Pan-based
- 11.1.2.3. Phenolic-based
- 11.1.2.4. Viscose-based
- 11.1.2.5. Other Materials
- 11.2. Market Analysis, Insights and Forecast - by Application
- 11.2.1. Purification
- 11.2.2. Chemical Separation and Catalysis
- 11.2.3. Protective Clothing
- 11.2.4. Medical
- 11.2.5. Super Capacitors
- 11.2.6. Other Applications
- 11.1. Market Analysis, Insights and Forecast - by Raw Material
- 12. Competitive Analysis
- 12.1. Company Profiles
- 12.1.1 Jiangsu Tongkang Activated Carbon Fiber Co Ltd
- 12.1.1.1. Company Overview
- 12.1.1.2. Products
- 12.1.1.3. Company Financials
- 12.1.1.4. SWOT Analysis
- 12.1.2 Nantong Yongtong Environmental Technology Co Ltd
- 12.1.2.1. Company Overview
- 12.1.2.2. Products
- 12.1.2.3. Company Financials
- 12.1.2.4. SWOT Analysis
- 12.1.3 Kuraray Co Ltd
- 12.1.3.1. Company Overview
- 12.1.3.2. Products
- 12.1.3.3. Company Financials
- 12.1.3.4. SWOT Analysis
- 12.1.4 Hangzhou Nature Technology Co Ltd (Nature Carbon)
- 12.1.4.1. Company Overview
- 12.1.4.2. Products
- 12.1.4.3. Company Financials
- 12.1.4.4. SWOT Analysis
- 12.1.5 Anshan Sinocarb Carbon Fibers Co Ltd
- 12.1.5.1. Company Overview
- 12.1.5.2. Products
- 12.1.5.3. Company Financials
- 12.1.5.4. SWOT Analysis
- 12.1.6 Unitika LTD*List Not Exhaustive
- 12.1.6.1. Company Overview
- 12.1.6.2. Products
- 12.1.6.3. Company Financials
- 12.1.6.4. SWOT Analysis
- 12.1.7 China Beihai Fiberglass Co Ltd
- 12.1.7.1. Company Overview
- 12.1.7.2. Products
- 12.1.7.3. Company Financials
- 12.1.7.4. SWOT Analysis
- 12.1.8 Toyobo Co Ltd
- 12.1.8.1. Company Overview
- 12.1.8.2. Products
- 12.1.8.3. Company Financials
- 12.1.8.4. SWOT Analysis
- 12.1.9 Osaka Gas Chemicals Co Ltd
- 12.1.9.1. Company Overview
- 12.1.9.2. Products
- 12.1.9.3. Company Financials
- 12.1.9.4. SWOT Analysis
- 12.1.10 Evertech Envisafe Ecology Co Ltd
- 12.1.10.1. Company Overview
- 12.1.10.2. Products
- 12.1.10.3. Company Financials
- 12.1.10.4. SWOT Analysis
- 12.1.11 HPMS Graphite
- 12.1.11.1. Company Overview
- 12.1.11.2. Products
- 12.1.11.3. Company Financials
- 12.1.11.4. SWOT Analysis
- 12.1.1 Jiangsu Tongkang Activated Carbon Fiber Co Ltd
- 12.2. Market Entropy
- 12.2.1 Company's Key Areas Served
- 12.2.2 Recent Developments
- 12.3. Company Market Share Analysis 2025
- 12.3.1 Top 5 Companies Market Share Analysis
- 12.3.2 Top 3 Companies Market Share Analysis
- 12.4. List of Potential Customers
- 13. Research Methodology
List of Figures
- Figure 1: Global Activated Carbon Fiber Industry Revenue Breakdown (Million, %) by Region 2025 & 2033
- Figure 2: Asia Pacific Activated Carbon Fiber Industry Revenue (Million), by Raw Material 2025 & 2033
- Figure 3: Asia Pacific Activated Carbon Fiber Industry Revenue Share (%), by Raw Material 2025 & 2033
- Figure 4: Asia Pacific Activated Carbon Fiber Industry Revenue (Million), by Application 2025 & 2033
- Figure 5: Asia Pacific Activated Carbon Fiber Industry Revenue Share (%), by Application 2025 & 2033
- Figure 6: Asia Pacific Activated Carbon Fiber Industry Revenue (Million), by Country 2025 & 2033
- Figure 7: Asia Pacific Activated Carbon Fiber Industry Revenue Share (%), by Country 2025 & 2033
- Figure 8: North America Activated Carbon Fiber Industry Revenue (Million), by Raw Material 2025 & 2033
- Figure 9: North America Activated Carbon Fiber Industry Revenue Share (%), by Raw Material 2025 & 2033
- Figure 10: North America Activated Carbon Fiber Industry Revenue (Million), by Application 2025 & 2033
- Figure 11: North America Activated Carbon Fiber Industry Revenue Share (%), by Application 2025 & 2033
- Figure 12: North America Activated Carbon Fiber Industry Revenue (Million), by Country 2025 & 2033
- Figure 13: North America Activated Carbon Fiber Industry Revenue Share (%), by Country 2025 & 2033
- Figure 14: Europe Activated Carbon Fiber Industry Revenue (Million), by Raw Material 2025 & 2033
- Figure 15: Europe Activated Carbon Fiber Industry Revenue Share (%), by Raw Material 2025 & 2033
- Figure 16: Europe Activated Carbon Fiber Industry Revenue (Million), by Application 2025 & 2033
- Figure 17: Europe Activated Carbon Fiber Industry Revenue Share (%), by Application 2025 & 2033
- Figure 18: Europe Activated Carbon Fiber Industry Revenue (Million), by Country 2025 & 2033
- Figure 19: Europe Activated Carbon Fiber Industry Revenue Share (%), by Country 2025 & 2033
- Figure 20: Middle East Activated Carbon Fiber Industry Revenue (Million), by Raw Material 2025 & 2033
- Figure 21: Middle East Activated Carbon Fiber Industry Revenue Share (%), by Raw Material 2025 & 2033
- Figure 22: Middle East Activated Carbon Fiber Industry Revenue (Million), by Application 2025 & 2033
- Figure 23: Middle East Activated Carbon Fiber Industry Revenue Share (%), by Application 2025 & 2033
- Figure 24: Middle East Activated Carbon Fiber Industry Revenue (Million), by Country 2025 & 2033
- Figure 25: Middle East Activated Carbon Fiber Industry Revenue Share (%), by Country 2025 & 2033
- Figure 26: Saudi Arabia Activated Carbon Fiber Industry Revenue (Million), by Raw Material 2025 & 2033
- Figure 27: Saudi Arabia Activated Carbon Fiber Industry Revenue Share (%), by Raw Material 2025 & 2033
- Figure 28: Saudi Arabia Activated Carbon Fiber Industry Revenue (Million), by Application 2025 & 2033
- Figure 29: Saudi Arabia Activated Carbon Fiber Industry Revenue Share (%), by Application 2025 & 2033
- Figure 30: Saudi Arabia Activated Carbon Fiber Industry Revenue (Million), by Country 2025 & 2033
- Figure 31: Saudi Arabia Activated Carbon Fiber Industry Revenue Share (%), by Country 2025 & 2033
List of Tables
- Table 1: Global Activated Carbon Fiber Industry Revenue Million Forecast, by Raw Material 2020 & 2033
- Table 2: Global Activated Carbon Fiber Industry Revenue Million Forecast, by Application 2020 & 2033
- Table 3: Global Activated Carbon Fiber Industry Revenue Million Forecast, by Region 2020 & 2033
- Table 4: Global Activated Carbon Fiber Industry Revenue Million Forecast, by Raw Material 2020 & 2033
- Table 5: Global Activated Carbon Fiber Industry Revenue Million Forecast, by Application 2020 & 2033
- Table 6: Global Activated Carbon Fiber Industry Revenue Million Forecast, by Country 2020 & 2033
- Table 7: China Activated Carbon Fiber Industry Revenue (Million) Forecast, by Application 2020 & 2033
- Table 8: India Activated Carbon Fiber Industry Revenue (Million) Forecast, by Application 2020 & 2033
- Table 9: Japan Activated Carbon Fiber Industry Revenue (Million) Forecast, by Application 2020 & 2033
- Table 10: South Korea Activated Carbon Fiber Industry Revenue (Million) Forecast, by Application 2020 & 2033
- Table 11: Rest of Asia Pacific Activated Carbon Fiber Industry Revenue (Million) Forecast, by Application 2020 & 2033
- Table 12: Global Activated Carbon Fiber Industry Revenue Million Forecast, by Raw Material 2020 & 2033
- Table 13: Global Activated Carbon Fiber Industry Revenue Million Forecast, by Application 2020 & 2033
- Table 14: Global Activated Carbon Fiber Industry Revenue Million Forecast, by Country 2020 & 2033
- Table 15: United States Activated Carbon Fiber Industry Revenue (Million) Forecast, by Application 2020 & 2033
- Table 16: Mexico Activated Carbon Fiber Industry Revenue (Million) Forecast, by Application 2020 & 2033
- Table 17: Canada Activated Carbon Fiber Industry Revenue (Million) Forecast, by Application 2020 & 2033
- Table 18: Global Activated Carbon Fiber Industry Revenue Million Forecast, by Raw Material 2020 & 2033
- Table 19: Global Activated Carbon Fiber Industry Revenue Million Forecast, by Application 2020 & 2033
- Table 20: Global Activated Carbon Fiber Industry Revenue Million Forecast, by Country 2020 & 2033
- Table 21: Germany Activated Carbon Fiber Industry Revenue (Million) Forecast, by Application 2020 & 2033
- Table 22: United Kingdom Activated Carbon Fiber Industry Revenue (Million) Forecast, by Application 2020 & 2033
- Table 23: France Activated Carbon Fiber Industry Revenue (Million) Forecast, by Application 2020 & 2033
- Table 24: Italy Activated Carbon Fiber Industry Revenue (Million) Forecast, by Application 2020 & 2033
- Table 25: Rest of Europe Activated Carbon Fiber Industry Revenue (Million) Forecast, by Application 2020 & 2033
- Table 26: Global Activated Carbon Fiber Industry Revenue Million Forecast, by Raw Material 2020 & 2033
- Table 27: Global Activated Carbon Fiber Industry Revenue Million Forecast, by Application 2020 & 2033
- Table 28: Global Activated Carbon Fiber Industry Revenue Million Forecast, by Country 2020 & 2033
- Table 29: Global Activated Carbon Fiber Industry Revenue Million Forecast, by Raw Material 2020 & 2033
- Table 30: Global Activated Carbon Fiber Industry Revenue Million Forecast, by Application 2020 & 2033
- Table 31: Global Activated Carbon Fiber Industry Revenue Million Forecast, by Country 2020 & 2033
- Table 32: South Africa Activated Carbon Fiber Industry Revenue (Million) Forecast, by Application 2020 & 2033
- Table 33: Rest of Middle East Activated Carbon Fiber Industry Revenue (Million) Forecast, by Application 2020 & 2033
Frequently Asked Questions
1. What is the projected Compound Annual Growth Rate (CAGR) of the Activated Carbon Fiber Industry?
The projected CAGR is approximately 3.71%.
2. Which companies are prominent players in the Activated Carbon Fiber Industry?
Key companies in the market include Jiangsu Tongkang Activated Carbon Fiber Co Ltd, Nantong Yongtong Environmental Technology Co Ltd, Kuraray Co Ltd, Hangzhou Nature Technology Co Ltd (Nature Carbon), Anshan Sinocarb Carbon Fibers Co Ltd, Unitika LTD*List Not Exhaustive, China Beihai Fiberglass Co Ltd, Toyobo Co Ltd, Osaka Gas Chemicals Co Ltd, Evertech Envisafe Ecology Co Ltd, HPMS Graphite.
3. What are the main segments of the Activated Carbon Fiber Industry?
The market segments include Raw Material, Application.
4. Can you provide details about the market size?
The market size is estimated to be USD 414.13 Million as of 2022.
5. What are some drivers contributing to market growth?
Increasing Environmental Concerns Related to Air and Water Pollution; Superior Properties of Activated Carbon Fiber.
6. What are the notable trends driving market growth?
Increasing Demand from the Purification Industry.
7. Are there any restraints impacting market growth?
Concerns Related to Raw Materials.
8. Can you provide examples of recent developments in the market?
N/A
9. What pricing options are available for accessing the report?
Pricing options include single-user, multi-user, and enterprise licenses priced at USD 4750, USD 5250, and USD 8750 respectively.
10. Is the market size provided in terms of value or volume?
The market size is provided in terms of value, measured in Million.
11. Are there any specific market keywords associated with the report?
Yes, the market keyword associated with the report is "Activated Carbon Fiber Industry," which aids in identifying and referencing the specific market segment covered.
12. How do I determine which pricing option suits my needs best?
The pricing options vary based on user requirements and access needs. Individual users may opt for single-user licenses, while businesses requiring broader access may choose multi-user or enterprise licenses for cost-effective access to the report.
13. Are there any additional resources or data provided in the Activated Carbon Fiber Industry report?
While the report offers comprehensive insights, it's advisable to review the specific contents or supplementary materials provided to ascertain if additional resources or data are available.
14. How can I stay updated on further developments or reports in the Activated Carbon Fiber Industry?
To stay informed about further developments, trends, and reports in the Activated Carbon Fiber Industry, consider subscribing to industry newsletters, following relevant companies and organizations, or regularly checking reputable industry news sources and publications.
Methodology
Step 1 - Identification of Relevant Samples Size from Population Database


Step 2 - Approaches for Defining Global Market Size (Value, Volume* & Price*)

Note*: In applicable scenarios
Step 3 - Data Sources
Primary Research
- Web Analytics
- Survey Reports
- Research Institute
- Latest Research Reports
- Opinion Leaders
Secondary Research
- Annual Reports
- White Paper
- Latest Press Release
- Industry Association
- Paid Database
- Investor Presentations

Step 4 - Data Triangulation
Involves using different sources of information in order to increase the validity of a study
These sources are likely to be stakeholders in a program - participants, other researchers, program staff, other community members, and so on.
Then we put all data in single framework & apply various statistical tools to find out the dynamic on the market.
During the analysis stage, feedback from the stakeholder groups would be compared to determine areas of agreement as well as areas of divergence