

Key Insights
The global ammonium phosphate market is forecast to reach $528.26 million by 2025, exhibiting a Compound Annual Growth Rate (CAGR) of 5.4% from 2025 to 2033. This expansion is primarily driven by escalating demand for fertilizers in agriculture, spurred by a growing global population and the imperative to boost crop yields for food security. The growth of the global agricultural sector, alongside increased adoption of high-efficiency fertilizers and advancements in nutrient delivery systems, are key market accelerators. Despite challenges posed by volatile raw material prices and environmental regulations, the market outlook remains strong, particularly in agriculturally significant regions.
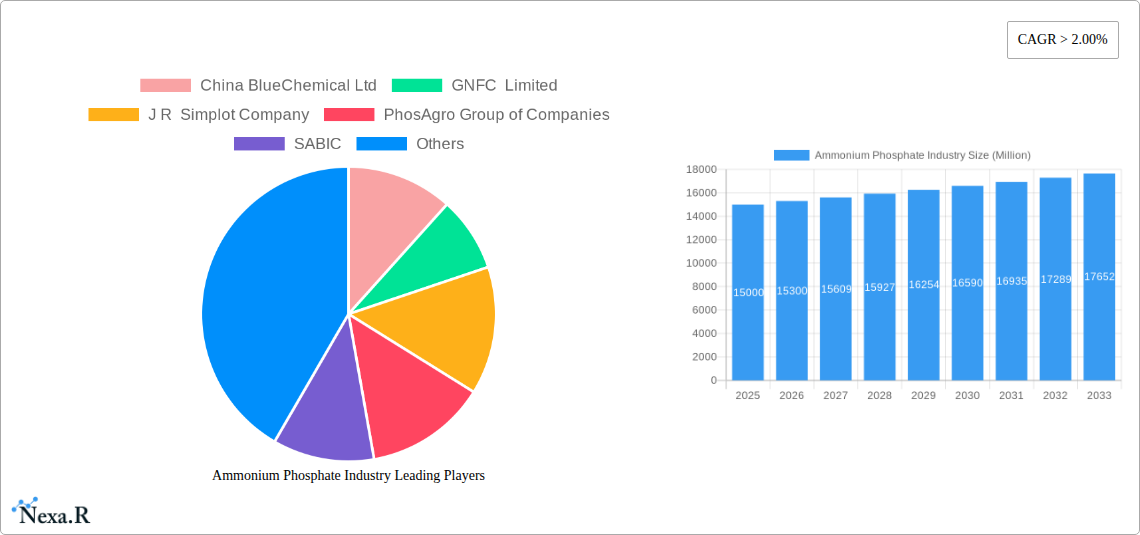
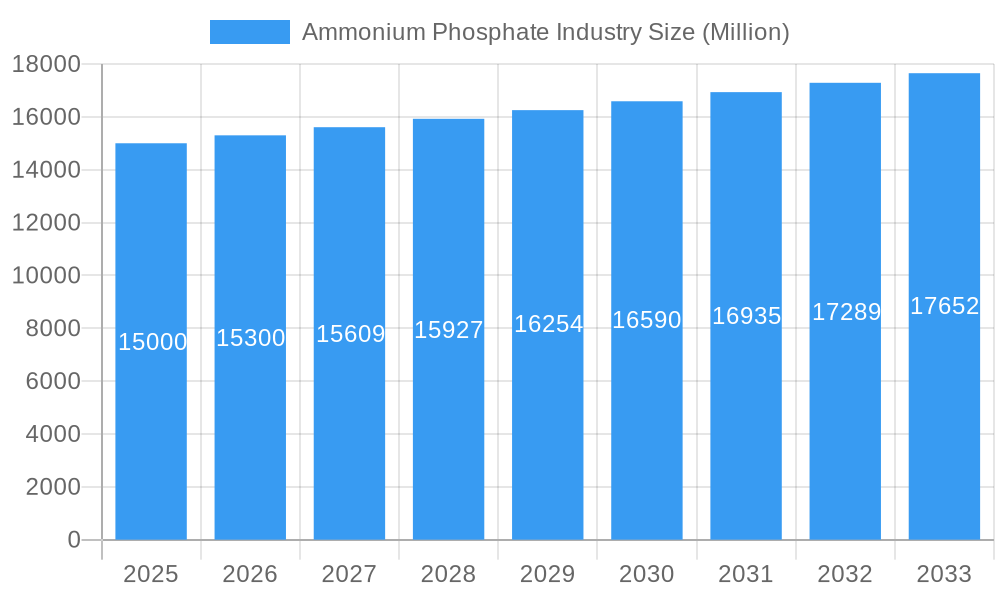
Ammonium Phosphate Industry Market Size (In Million)
Leading companies such as China BlueChemical Ltd, GNFC Limited, J R Simplot Company, PhosAgro Group of Companies, SABIC, Shifang Chuanxi Xingda Chemical Co Ltd, The Mosaic Company, and Yara are actively influencing the market through strategic investments, product innovation, and mergers and acquisitions. The market is segmented by grades and applications, with granular formulations dominating due to their ease of use in modern agriculture. Developing economies in Asia and Africa are anticipated to lead growth, while mature markets in North America and Europe are also expected to demonstrate robust performance throughout the forecast period.
Ammonium Phosphate Industry Company Market Share
Ammonium Phosphate Industry: A Comprehensive Market Report (2019-2033)
This in-depth report provides a comprehensive analysis of the Ammonium Phosphate industry, covering market dynamics, growth trends, regional performance, and key players. The study period spans from 2019 to 2033, with 2025 serving as the base and estimated year. The report leverages extensive data and expert analysis to deliver actionable insights for industry professionals, investors, and stakeholders. The parent market is the fertilizer industry, and the child market is the phosphate fertilizer segment.
Ammonium Phosphate Industry Market Dynamics & Structure
This section analyzes the competitive landscape, technological advancements, and regulatory influences shaping the Ammonium Phosphate market. The report quantifies market concentration, assessing the market share of key players like The Mosaic Company, Yara, PhosAgro Group of Companies, and others. It also explores M&A activity within the industry, estimating the volume of deals over the study period (2019-2024 at xx Million and projected to xx Million for 2025-2033).
- Market Concentration: Analysis of market share distribution among key players, revealing the degree of competition and potential for consolidation. (e.g., Top 3 players hold xx% market share in 2025).
- Technological Innovation: Assessment of R&D investments, innovative production processes, and the impact of technological advancements on market dynamics. Challenges related to innovation, such as high R&D costs, are also addressed.
- Regulatory Landscape: Examination of environmental regulations, trade policies, and safety standards impacting Ammonium Phosphate production and distribution. Analysis of their influence on market growth.
- Competitive Substitutes: Identification and analysis of alternative fertilizers and their impact on market demand. Assessment of price competition and market substitution rates.
- End-User Demographics: Profiling of major end-users (agriculture, industrial) and their influence on market demand. Segmentation based on farming practices and geographical regions.
- M&A Trends: Analysis of merger and acquisition activities, identifying key drivers and their impact on market consolidation and competitive dynamics.
Ammonium Phosphate Industry Growth Trends & Insights
This section provides a detailed analysis of the Ammonium Phosphate market's growth trajectory, utilizing robust data and forecasting models to project future market size. The report examines historical data (2019-2024) to identify past growth patterns and leverages advanced forecasting methodologies to project CAGR from 2025-2033 (projected at xx%). Factors such as technological disruptions, shifting consumer behavior (adoption of precision farming techniques), and evolving agricultural practices are explored in detail. The impact of macroeconomic factors such as global food security concerns and population growth on market demand is also assessed. The report presents detailed analysis of market penetration rates across different geographical segments and farming practices.
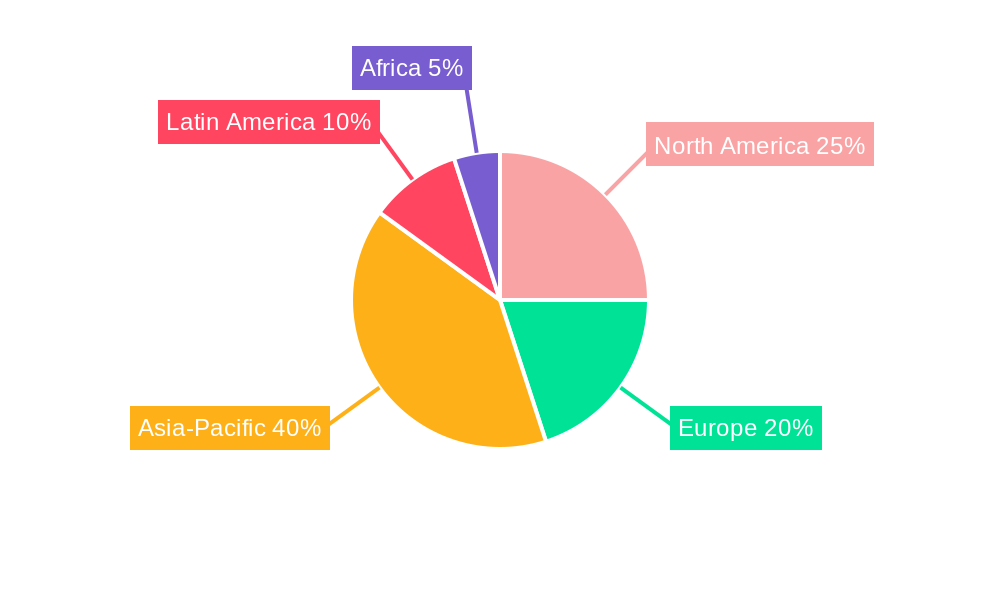
Dominant Regions, Countries, or Segments in Ammonium Phosphate Industry
This section identifies the leading geographical regions and segments driving Ammonium Phosphate market growth. The report analyzes factors contributing to regional dominance, including market size, growth rate, economic conditions, agricultural policies, and infrastructure development. It assesses the growth potential of each region, highlighting key growth drivers and opportunities.
- Key Drivers:
- North America: Strong agricultural sector, favorable government policies, and technological advancements.
- Asia-Pacific: Rapidly expanding agricultural sector, increasing demand from developing economies.
- Europe: Intensive agricultural practices and focus on sustainable farming methods.
- Market Share & Growth Potential: Detailed analysis of market share and growth prospects for each identified region, using quantitative data and qualitative insights.
Ammonium Phosphate Industry Product Landscape
The Ammonium Phosphate market offers a range of products with varying specifications and applications. This section details the diverse product portfolio, highlighting key product innovations, advancements in manufacturing technologies, and the unique selling propositions of various offerings. This analysis includes a focus on the performance metrics of different products, and the impact of these innovations on market competition.
Key Drivers, Barriers & Challenges in Ammonium Phosphate Industry
This section identifies the key factors driving market growth and the challenges hindering its expansion.
Key Drivers:
- Rising global food demand and the need for efficient fertilizers.
- Advancements in agricultural practices that enhance fertilizer uptake efficiency.
- Government initiatives and subsidies promoting fertilizer use in developing economies.
Key Challenges and Restraints:
- Fluctuations in raw material prices (phosphates, ammonia).
- Stringent environmental regulations impacting production and disposal.
- Intense competition among established players and emergence of new entrants. (xx% increase in competition from 2024 to 2025).
- Supply chain disruptions affecting production and distribution. (Impact quantified in terms of percentage change in production).
Emerging Opportunities in Ammonium Phosphate Industry
This section highlights emerging opportunities for growth, focusing on untapped markets, innovative applications, and shifts in consumer preferences. The focus is on new technologies, niche applications, and evolving trends that present avenues for expansion. For instance, the increasing popularity of sustainable agriculture practices could drive demand for specialized formulations of ammonium phosphate.
Growth Accelerators in the Ammonium Phosphate Industry
Technological breakthroughs, strategic collaborations, and expansion into new markets are key growth drivers for the Ammonium Phosphate industry. Innovative manufacturing processes leading to higher efficiency and reduced environmental impact are critical factors, while strategic partnerships could expand market reach and access new technologies. The report details these drivers and their potential impact on market expansion.
Key Players Shaping the Ammonium Phosphate Industry Market
- The Mosaic Company
- Yara
- PhosAgro Group of Companies
- SABIC
- China BlueChemical Ltd
- GNFC Limited
- J R Simplot Company
- Shifang Chuanxi Xingda Chemical Co Ltd
Notable Milestones in Ammonium Phosphate Industry Sector
- 2021 Q3: Launch of a new, high-efficiency Ammonium Phosphate formulation by The Mosaic Company.
- 2022 Q1: Acquisition of a smaller fertilizer producer by Yara International.
- 2023 Q2: Introduction of new environmental regulations impacting Ammonium Phosphate production in Europe. (Further milestones will be detailed in the complete report)
In-Depth Ammonium Phosphate Industry Market Outlook
The Ammonium Phosphate market is poised for continued growth, driven by technological advancements, increasing global food demand, and strategic market expansion by key players. The report projects a robust future for the industry, with significant opportunities for innovation and market penetration. The long-term outlook is positive, driven by factors including population growth, changing agricultural practices, and a focus on sustainable fertilizer solutions.
Ammonium Phosphate Industry Segmentation
-
1. Application
- 1.1. Fertilizer
- 1.2. Food & Beverages
- 1.3. Fire Retardant
- 1.4. Metals
Ammonium Phosphate Industry Segmentation By Geography
-
1. Asia Pacific
- 1.1. China
- 1.2. India
- 1.3. Japan
- 1.4. South Korea
- 1.5. Rest of Asia Pacific
-
2. North America
- 2.1. United States
- 2.2. Canada
- 2.3. Mexico
-
3. Europe
- 3.1. Germany
- 3.2. United Kingdom
- 3.3. Italy
- 3.4. France
- 3.5. Rest of Europe
-
4. South America
- 4.1. Brazil
- 4.2. Argentina
- 4.3. Rest of South America
-
5. Middle East and Africa
- 5.1. Saudi Arabia
- 5.2. South Africa
- 5.3. Rest of Middle East and Africa
Ammonium Phosphate Industry Regional Market Share
Geographic Coverage of Ammonium Phosphate Industry
Ammonium Phosphate Industry REPORT HIGHLIGHTS
| Aspects | Details |
|---|---|
| Study Period | 2020-2034 |
| Base Year | 2025 |
| Estimated Year | 2026 |
| Forecast Period | 2026-2034 |
| Historical Period | 2020-2025 |
| Growth Rate | CAGR of 5.4% from 2020-2034 |
| Segmentation |
|
Table of Contents
- 1. Introduction
- 1.1. Research Scope
- 1.2. Market Segmentation
- 1.3. Research Objective
- 1.4. Definitions and Assumptions
- 2. Executive Summary
- 2.1. Market Snapshot
- 3. Market Dynamics
- 3.1. Market Drivers
- 3.2. Market Restrains
- 3.3. Market Trends
- 3.4. Market Opportunities
- 4. Market Factor Analysis
- 4.1. Porters Five Forces
- 4.1.1. Bargaining Power of Suppliers
- 4.1.2. Bargaining Power of Buyers
- 4.1.3. Threat of New Entrants
- 4.1.4. Threat of Substitutes
- 4.1.5. Competitive Rivalry
- 4.2. PESTEL analysis
- 4.3. BCG Analysis
- 4.3.1. Stars (High Growth, High Market Share)
- 4.3.2. Cash Cows (Low Growth, High Market Share)
- 4.3.3. Question Mark (High Growth, Low Market Share)
- 4.3.4. Dogs (Low Growth, Low Market Share)
- 4.4. Ansoff Matrix Analysis
- 4.5. Supply Chain Analysis
- 4.6. Regulatory Landscape
- 4.7. Current Market Potential and Opportunity Assessment (TAM–SAM–SOM Framework)
- 4.8. NRP Analyst Note
- 4.1. Porters Five Forces
- 5. Market Analysis, Insights and Forecast 2021-2033
- 5.1. Market Analysis, Insights and Forecast - by Application
- 5.1.1. Fertilizer
- 5.1.2. Food & Beverages
- 5.1.3. Fire Retardant
- 5.1.4. Metals
- 5.2. Market Analysis, Insights and Forecast - by Region
- 5.2.1. Asia Pacific
- 5.2.2. North America
- 5.2.3. Europe
- 5.2.4. South America
- 5.2.5. Middle East and Africa
- 5.1. Market Analysis, Insights and Forecast - by Application
- 6. Global Ammonium Phosphate Industry Analysis, Insights and Forecast, 2021-2033
- 6.1. Market Analysis, Insights and Forecast - by Application
- 6.1.1. Fertilizer
- 6.1.2. Food & Beverages
- 6.1.3. Fire Retardant
- 6.1.4. Metals
- 6.1. Market Analysis, Insights and Forecast - by Application
- 7. Asia Pacific Ammonium Phosphate Industry Analysis, Insights and Forecast, 2020-2032
- 7.1. Market Analysis, Insights and Forecast - by Application
- 7.1.1. Fertilizer
- 7.1.2. Food & Beverages
- 7.1.3. Fire Retardant
- 7.1.4. Metals
- 7.1. Market Analysis, Insights and Forecast - by Application
- 8. North America Ammonium Phosphate Industry Analysis, Insights and Forecast, 2020-2032
- 8.1. Market Analysis, Insights and Forecast - by Application
- 8.1.1. Fertilizer
- 8.1.2. Food & Beverages
- 8.1.3. Fire Retardant
- 8.1.4. Metals
- 8.1. Market Analysis, Insights and Forecast - by Application
- 9. Europe Ammonium Phosphate Industry Analysis, Insights and Forecast, 2020-2032
- 9.1. Market Analysis, Insights and Forecast - by Application
- 9.1.1. Fertilizer
- 9.1.2. Food & Beverages
- 9.1.3. Fire Retardant
- 9.1.4. Metals
- 9.1. Market Analysis, Insights and Forecast - by Application
- 10. South America Ammonium Phosphate Industry Analysis, Insights and Forecast, 2020-2032
- 10.1. Market Analysis, Insights and Forecast - by Application
- 10.1.1. Fertilizer
- 10.1.2. Food & Beverages
- 10.1.3. Fire Retardant
- 10.1.4. Metals
- 10.1. Market Analysis, Insights and Forecast - by Application
- 11. Middle East and Africa Ammonium Phosphate Industry Analysis, Insights and Forecast, 2020-2032
- 11.1. Market Analysis, Insights and Forecast - by Application
- 11.1.1. Fertilizer
- 11.1.2. Food & Beverages
- 11.1.3. Fire Retardant
- 11.1.4. Metals
- 11.1. Market Analysis, Insights and Forecast - by Application
- 12. Competitive Analysis
- 12.1. Company Profiles
- 12.1.1 China BlueChemical Ltd
- 12.1.1.1. Company Overview
- 12.1.1.2. Products
- 12.1.1.3. Company Financials
- 12.1.1.4. SWOT Analysis
- 12.1.2 GNFC Limited
- 12.1.2.1. Company Overview
- 12.1.2.2. Products
- 12.1.2.3. Company Financials
- 12.1.2.4. SWOT Analysis
- 12.1.3 J R Simplot Company
- 12.1.3.1. Company Overview
- 12.1.3.2. Products
- 12.1.3.3. Company Financials
- 12.1.3.4. SWOT Analysis
- 12.1.4 PhosAgro Group of Companies
- 12.1.4.1. Company Overview
- 12.1.4.2. Products
- 12.1.4.3. Company Financials
- 12.1.4.4. SWOT Analysis
- 12.1.5 SABIC
- 12.1.5.1. Company Overview
- 12.1.5.2. Products
- 12.1.5.3. Company Financials
- 12.1.5.4. SWOT Analysis
- 12.1.6 Shifang Chuanxi Xingda Chemical Co Ltd
- 12.1.6.1. Company Overview
- 12.1.6.2. Products
- 12.1.6.3. Company Financials
- 12.1.6.4. SWOT Analysis
- 12.1.7 The Mosaic Company
- 12.1.7.1. Company Overview
- 12.1.7.2. Products
- 12.1.7.3. Company Financials
- 12.1.7.4. SWOT Analysis
- 12.1.8 Yara*List Not Exhaustive
- 12.1.8.1. Company Overview
- 12.1.8.2. Products
- 12.1.8.3. Company Financials
- 12.1.8.4. SWOT Analysis
- 12.1.1 China BlueChemical Ltd
- 12.2. Market Entropy
- 12.2.1 Company's Key Areas Served
- 12.2.2 Recent Developments
- 12.3. Company Market Share Analysis 2025
- 12.3.1 Top 5 Companies Market Share Analysis
- 12.3.2 Top 3 Companies Market Share Analysis
- 12.4. List of Potential Customers
- 13. Research Methodology
List of Figures
- Figure 1: Global Ammonium Phosphate Industry Revenue Breakdown (million, %) by Region 2025 & 2033
- Figure 2: Asia Pacific Ammonium Phosphate Industry Revenue (million), by Application 2025 & 2033
- Figure 3: Asia Pacific Ammonium Phosphate Industry Revenue Share (%), by Application 2025 & 2033
- Figure 4: Asia Pacific Ammonium Phosphate Industry Revenue (million), by Country 2025 & 2033
- Figure 5: Asia Pacific Ammonium Phosphate Industry Revenue Share (%), by Country 2025 & 2033
- Figure 6: North America Ammonium Phosphate Industry Revenue (million), by Application 2025 & 2033
- Figure 7: North America Ammonium Phosphate Industry Revenue Share (%), by Application 2025 & 2033
- Figure 8: North America Ammonium Phosphate Industry Revenue (million), by Country 2025 & 2033
- Figure 9: North America Ammonium Phosphate Industry Revenue Share (%), by Country 2025 & 2033
- Figure 10: Europe Ammonium Phosphate Industry Revenue (million), by Application 2025 & 2033
- Figure 11: Europe Ammonium Phosphate Industry Revenue Share (%), by Application 2025 & 2033
- Figure 12: Europe Ammonium Phosphate Industry Revenue (million), by Country 2025 & 2033
- Figure 13: Europe Ammonium Phosphate Industry Revenue Share (%), by Country 2025 & 2033
- Figure 14: South America Ammonium Phosphate Industry Revenue (million), by Application 2025 & 2033
- Figure 15: South America Ammonium Phosphate Industry Revenue Share (%), by Application 2025 & 2033
- Figure 16: South America Ammonium Phosphate Industry Revenue (million), by Country 2025 & 2033
- Figure 17: South America Ammonium Phosphate Industry Revenue Share (%), by Country 2025 & 2033
- Figure 18: Middle East and Africa Ammonium Phosphate Industry Revenue (million), by Application 2025 & 2033
- Figure 19: Middle East and Africa Ammonium Phosphate Industry Revenue Share (%), by Application 2025 & 2033
- Figure 20: Middle East and Africa Ammonium Phosphate Industry Revenue (million), by Country 2025 & 2033
- Figure 21: Middle East and Africa Ammonium Phosphate Industry Revenue Share (%), by Country 2025 & 2033
List of Tables
- Table 1: Global Ammonium Phosphate Industry Revenue million Forecast, by Application 2020 & 2033
- Table 2: Global Ammonium Phosphate Industry Revenue million Forecast, by Region 2020 & 2033
- Table 3: Global Ammonium Phosphate Industry Revenue million Forecast, by Application 2020 & 2033
- Table 4: Global Ammonium Phosphate Industry Revenue million Forecast, by Country 2020 & 2033
- Table 5: China Ammonium Phosphate Industry Revenue (million) Forecast, by Application 2020 & 2033
- Table 6: India Ammonium Phosphate Industry Revenue (million) Forecast, by Application 2020 & 2033
- Table 7: Japan Ammonium Phosphate Industry Revenue (million) Forecast, by Application 2020 & 2033
- Table 8: South Korea Ammonium Phosphate Industry Revenue (million) Forecast, by Application 2020 & 2033
- Table 9: Rest of Asia Pacific Ammonium Phosphate Industry Revenue (million) Forecast, by Application 2020 & 2033
- Table 10: Global Ammonium Phosphate Industry Revenue million Forecast, by Application 2020 & 2033
- Table 11: Global Ammonium Phosphate Industry Revenue million Forecast, by Country 2020 & 2033
- Table 12: United States Ammonium Phosphate Industry Revenue (million) Forecast, by Application 2020 & 2033
- Table 13: Canada Ammonium Phosphate Industry Revenue (million) Forecast, by Application 2020 & 2033
- Table 14: Mexico Ammonium Phosphate Industry Revenue (million) Forecast, by Application 2020 & 2033
- Table 15: Global Ammonium Phosphate Industry Revenue million Forecast, by Application 2020 & 2033
- Table 16: Global Ammonium Phosphate Industry Revenue million Forecast, by Country 2020 & 2033
- Table 17: Germany Ammonium Phosphate Industry Revenue (million) Forecast, by Application 2020 & 2033
- Table 18: United Kingdom Ammonium Phosphate Industry Revenue (million) Forecast, by Application 2020 & 2033
- Table 19: Italy Ammonium Phosphate Industry Revenue (million) Forecast, by Application 2020 & 2033
- Table 20: France Ammonium Phosphate Industry Revenue (million) Forecast, by Application 2020 & 2033
- Table 21: Rest of Europe Ammonium Phosphate Industry Revenue (million) Forecast, by Application 2020 & 2033
- Table 22: Global Ammonium Phosphate Industry Revenue million Forecast, by Application 2020 & 2033
- Table 23: Global Ammonium Phosphate Industry Revenue million Forecast, by Country 2020 & 2033
- Table 24: Brazil Ammonium Phosphate Industry Revenue (million) Forecast, by Application 2020 & 2033
- Table 25: Argentina Ammonium Phosphate Industry Revenue (million) Forecast, by Application 2020 & 2033
- Table 26: Rest of South America Ammonium Phosphate Industry Revenue (million) Forecast, by Application 2020 & 2033
- Table 27: Global Ammonium Phosphate Industry Revenue million Forecast, by Application 2020 & 2033
- Table 28: Global Ammonium Phosphate Industry Revenue million Forecast, by Country 2020 & 2033
- Table 29: Saudi Arabia Ammonium Phosphate Industry Revenue (million) Forecast, by Application 2020 & 2033
- Table 30: South Africa Ammonium Phosphate Industry Revenue (million) Forecast, by Application 2020 & 2033
- Table 31: Rest of Middle East and Africa Ammonium Phosphate Industry Revenue (million) Forecast, by Application 2020 & 2033
Frequently Asked Questions
1. What is the projected Compound Annual Growth Rate (CAGR) of the Ammonium Phosphate Industry?
The projected CAGR is approximately 5.4%.
2. Which companies are prominent players in the Ammonium Phosphate Industry?
Key companies in the market include China BlueChemical Ltd, GNFC Limited, J R Simplot Company, PhosAgro Group of Companies, SABIC, Shifang Chuanxi Xingda Chemical Co Ltd, The Mosaic Company, Yara*List Not Exhaustive.
3. What are the main segments of the Ammonium Phosphate Industry?
The market segments include Application.
4. Can you provide details about the market size?
The market size is estimated to be USD 528.26 million as of 2022.
5. What are some drivers contributing to market growth?
; Increasing Demand of Diammonium Hydrogen Phosphate in Fertilizers; Rising Demand from Brewing.
6. What are the notable trends driving market growth?
Increasing Demand from Fertilizers Segment.
7. Are there any restraints impacting market growth?
; Increasing Demand of Diammonium Hydrogen Phosphate in Fertilizers; Rising Demand from Brewing.
8. Can you provide examples of recent developments in the market?
N/A
9. What pricing options are available for accessing the report?
Pricing options include single-user, multi-user, and enterprise licenses priced at USD 4750, USD 5250, and USD 8750 respectively.
10. Is the market size provided in terms of value or volume?
The market size is provided in terms of value, measured in million.
11. Are there any specific market keywords associated with the report?
Yes, the market keyword associated with the report is "Ammonium Phosphate Industry," which aids in identifying and referencing the specific market segment covered.
12. How do I determine which pricing option suits my needs best?
The pricing options vary based on user requirements and access needs. Individual users may opt for single-user licenses, while businesses requiring broader access may choose multi-user or enterprise licenses for cost-effective access to the report.
13. Are there any additional resources or data provided in the Ammonium Phosphate Industry report?
While the report offers comprehensive insights, it's advisable to review the specific contents or supplementary materials provided to ascertain if additional resources or data are available.
14. How can I stay updated on further developments or reports in the Ammonium Phosphate Industry?
To stay informed about further developments, trends, and reports in the Ammonium Phosphate Industry, consider subscribing to industry newsletters, following relevant companies and organizations, or regularly checking reputable industry news sources and publications.
Methodology
Step 1 - Identification of Relevant Samples Size from Population Database


Step 2 - Approaches for Defining Global Market Size (Value, Volume* & Price*)

Note*: In applicable scenarios
Step 3 - Data Sources
Primary Research
- Web Analytics
- Survey Reports
- Research Institute
- Latest Research Reports
- Opinion Leaders
Secondary Research
- Annual Reports
- White Paper
- Latest Press Release
- Industry Association
- Paid Database
- Investor Presentations

Step 4 - Data Triangulation
Involves using different sources of information in order to increase the validity of a study
These sources are likely to be stakeholders in a program - participants, other researchers, program staff, other community members, and so on.
Then we put all data in single framework & apply various statistical tools to find out the dynamic on the market.
During the analysis stage, feedback from the stakeholder groups would be compared to determine areas of agreement as well as areas of divergence