

Key Insights
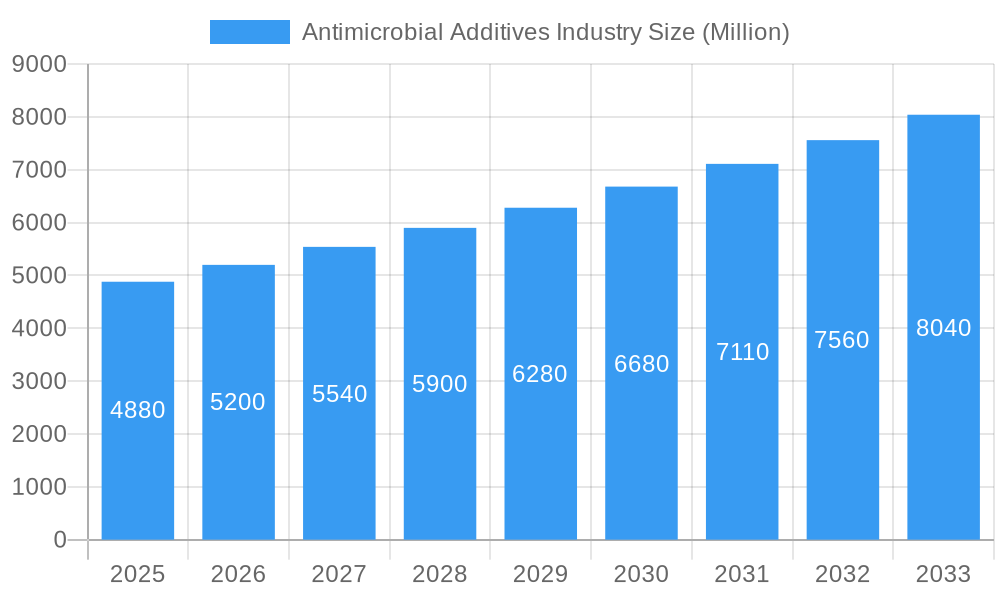
The antimicrobial additives market, valued at $4.88 billion in 2025, is projected to experience robust growth, driven by increasing concerns over hygiene and infection control across diverse sectors. A compound annual growth rate (CAGR) of 6.31% from 2025 to 2033 indicates a significant expansion, reaching an estimated market size of approximately $8.5 billion by 2033. Key drivers include the rising prevalence of healthcare-associated infections (HAIs), stringent government regulations mandating hygiene in various industries (food and beverage, healthcare, construction), and growing consumer demand for antimicrobial-treated products. The market is segmented by application (plastics, paints, pulp and paper, others), end-user industry (construction, automotive, healthcare, food and beverage, others), and type (organic, inorganic). The plastics segment is expected to dominate due to the extensive use of antimicrobial additives in packaging and medical devices. The healthcare sector is a significant end-user, fueled by the need to prevent infections in hospitals and clinics. Growth is further fueled by technological advancements leading to the development of more effective and sustainable antimicrobial agents. Geographic variations exist, with Asia Pacific expected to show significant growth due to rapid industrialization and urbanization, particularly in countries like China and India. North America and Europe, while mature markets, will continue to show steady growth due to consistent demand for high-quality antimicrobial products. Competition within the market is intense, with major players such as BASF, Clariant, and Dow Chemical vying for market share through innovation and strategic partnerships.
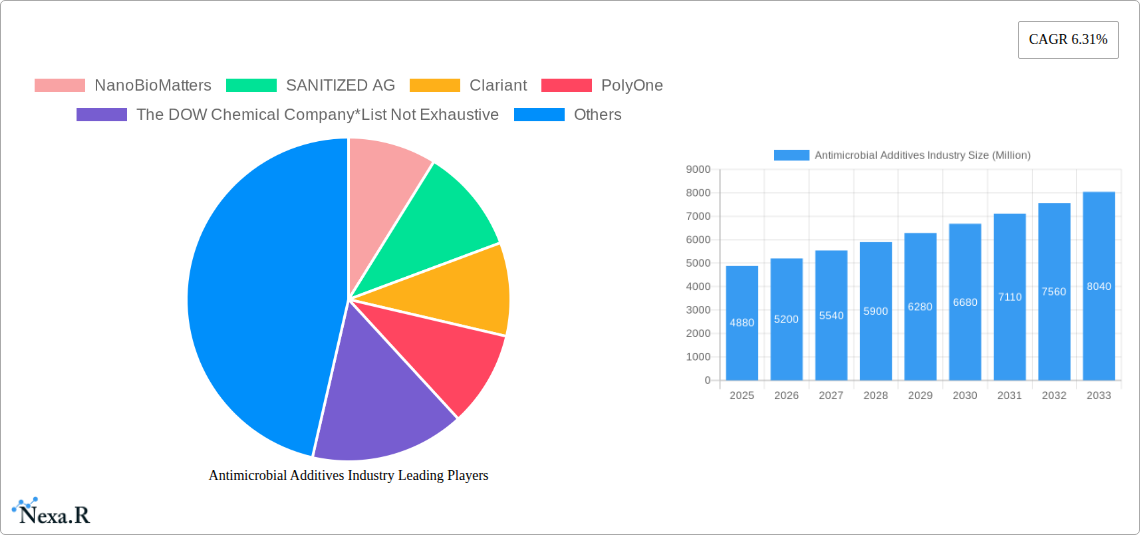
Antimicrobial Additives Industry Market Size (In Billion)
The market's growth trajectory is influenced by several factors. Increasing awareness of antimicrobial resistance (AMR) is pushing innovation towards new antimicrobial technologies. Furthermore, sustainability concerns are driving demand for eco-friendly and biodegradable antimicrobial additives. However, potential restraints include the stringent regulatory approvals required for new antimicrobial agents and concerns regarding potential toxicity and environmental impact of certain additives. Companies are addressing these challenges by focusing on developing environmentally benign and highly effective solutions, thereby further shaping the market's future trajectory. Ongoing research and development efforts focusing on novel antimicrobial mechanisms, improved efficacy, and reduced toxicity will continue to fuel the growth and innovation within this crucial market sector.
Antimicrobial Additives Industry Company Market Share
Antimicrobial Additives Market Report: 2019-2033
This comprehensive report provides an in-depth analysis of the Antimicrobial Additives market, encompassing market dynamics, growth trends, regional analysis, product landscape, key players, and future outlook. The study period covers 2019-2033, with 2025 as the base and estimated year. The report segments the market by application (Plastic, Paints, Pulp and Paper, Others), end-user industry (Construction, Automotive, Healthcare, Food and Beverage, Others), and type (Organic, Inorganic), offering granular insights into this rapidly evolving sector. The market size is projected to reach xx Million by 2033.
Antimicrobial Additives Industry Market Dynamics & Structure
The antimicrobial additives market is characterized by moderate concentration, with key players like Clariant, BASF SE, and The DOW Chemical Company holding significant market share. However, the market also exhibits a fragmented landscape with several smaller niche players. Technological innovation, driven by the rising demand for hygiene and infection control, is a major growth driver. Stringent regulatory frameworks regarding antimicrobial efficacy and safety pose both challenges and opportunities, shaping product development and market access. Competitive pressures from alternative technologies and natural antimicrobial agents are also observed. Market consolidation is evident through M&A activity, with an estimated xx M&A deals concluded between 2019-2024, resulting in a market share shift of approximately xx%.
- Market Concentration: Moderately concentrated with a few dominant players and numerous smaller companies.
- Technological Innovation: Driven by advancements in nanotechnology, bio-based materials, and improved efficacy.
- Regulatory Landscape: Stringent regulations regarding safety and efficacy are a major influence.
- Competitive Substitutes: Natural antimicrobial agents and alternative technologies are emerging competitors.
- M&A Activity: Significant consolidation through mergers and acquisitions, impacting market share.
- Innovation Barriers: High R&D costs, stringent regulatory approvals, and limited consumer awareness.
Antimicrobial Additives Industry Growth Trends & Insights
The global antimicrobial additives market witnessed robust growth during the historical period (2019-2024), expanding at a CAGR of xx%. This growth is primarily attributed to the increasing demand for hygiene and sanitation across various end-use sectors, particularly healthcare and food and beverage. The rising prevalence of infectious diseases and stricter regulations regarding hygiene standards further propelled market expansion. Technological advancements, such as the development of more effective and sustainable antimicrobial agents, have also contributed significantly to market growth. Consumer awareness regarding hygiene and personal safety has led to increased demand for antimicrobial-treated products. The market is expected to maintain its growth trajectory during the forecast period (2025-2033), with a projected CAGR of xx%, driven by factors such as increasing urbanization, expanding healthcare infrastructure, and growing consumer disposable income. Market penetration in developing economies remains significant growth opportunity.
Dominant Regions, Countries, or Segments in Antimicrobial Additives Industry
North America currently holds the largest market share in the antimicrobial additives market, driven by stringent hygiene regulations, robust healthcare infrastructure, and a high level of consumer awareness. However, the Asia-Pacific region exhibits the highest growth potential, fueled by rapid industrialization, rising population, and increasing disposable incomes. Within the application segments, the plastics sector commands the largest market share due to its extensive applications across various end-use industries. The healthcare segment, within the end-user industries, dominates due to the critical need for infection control. The organic type antimicrobial additive segment holds a larger market share compared to its inorganic counterpart driven by increasing preference for eco-friendly products.
- North America: Largest market share, driven by stringent regulations and high consumer awareness.
- Asia-Pacific: Highest growth potential, fueled by rapid industrialization and rising disposable incomes.
- Application: Plastics: Dominant segment due to widespread use across various end-use sectors.
- End-user Industry: Healthcare: Highest demand due to the critical need for infection control.
- Type: Organic: Larger market share compared to inorganic, driven by the preference for eco-friendly options.
Antimicrobial Additives Industry Product Landscape
The antimicrobial additives market showcases a diverse range of products with varying functionalities and performance characteristics. Innovations focus on enhancing efficacy, broadening applications, and improving sustainability. Nanotechnology-based additives, bio-based alternatives, and self-cleaning surfaces represent significant advancements. Unique selling propositions often emphasize broad-spectrum antimicrobial activity, long-lasting protection, and compatibility with various materials. Technological advancements are continuously improving the effectiveness and safety of antimicrobial additives.
Key Drivers, Barriers & Challenges in Antimicrobial Additives Industry
Key Drivers:
- Rising concerns about hygiene and sanitation.
- Increasing prevalence of infectious diseases.
- Stringent regulations promoting antimicrobial use in various applications.
- Technological advancements leading to improved efficacy and sustainability.
Challenges and Restraints:
- Concerns regarding the potential environmental impact of certain antimicrobial agents.
- Stringent regulatory approvals and compliance costs.
- Potential development of antimicrobial resistance.
- Price volatility of raw materials.
- Supply chain disruptions. These led to a xx% increase in production costs during 2022.
Emerging Opportunities in Antimicrobial Additives Industry
Untapped markets in developing economies present significant growth opportunities. Innovative applications in areas such as textiles, packaging, and personal care products are expanding market scope. The growing demand for sustainable and eco-friendly antimicrobial solutions is driving the development of bio-based alternatives. Evolving consumer preferences towards hygiene and safety are also shaping market demand.
Growth Accelerators in the Antimicrobial Additives Industry
Technological breakthroughs in nanotechnology and bio-based materials are key drivers of market expansion. Strategic partnerships and collaborations between additive manufacturers and end-use industry players are fostering innovation and market penetration. Expansion into new geographic markets and diversification into new applications are contributing to long-term growth.
Key Players Shaping the Antimicrobial Additives Industry Market
- NanoBioMatters
- SANITIZED AG
- Clariant
- PolyOne
- The DOW Chemical Company
- Momentive
- BASF SE
- LyondellBasell Industries Holdings B V
- RTP Company
- BioCote Limited
- Milliken Chemical
Notable Milestones in Antimicrobial Additives Industry Sector
- 2020: Launch of a new silver-based antimicrobial additive by Clariant.
- 2021: Acquisition of a smaller antimicrobial additive manufacturer by BASF SE.
- 2022: Introduction of a novel bio-based antimicrobial additive by NanoBioMatters.
- 2023: Publication of new regulatory guidelines impacting antimicrobial additive usage in the EU.
In-Depth Antimicrobial Additives Industry Market Outlook
The antimicrobial additives market is poised for continued growth, driven by sustained demand across diverse sectors. Strategic investments in R&D, focus on sustainability, and expansion into new applications will shape future market dynamics. Companies that can effectively adapt to evolving regulatory landscapes and consumer preferences are expected to gain a competitive edge. The focus on developing innovative, high-performance, and eco-friendly antimicrobial additives will be crucial for long-term success.
Antimicrobial Additives Industry Segmentation
-
1. Type
- 1.1. Organic
- 1.2. Inorganic
-
2. Application
- 2.1. Plastic
- 2.2. Paints
- 2.3. Pulp and Paper
- 2.4. Others
-
3. End-user Industry
- 3.1. Construction
- 3.2. Automotive
- 3.3. Healthcare
- 3.4. Food and Beverage
- 3.5. Others
Antimicrobial Additives Industry Segmentation By Geography
-
1. Asia Pacific
- 1.1. China
- 1.2. India
- 1.3. Japan
- 1.4. South Korea
- 1.5. Rest of Asia Pacific
-
2. North America
- 2.1. United States
- 2.2. Canada
- 2.3. Mexico
-
3. Europe
- 3.1. Germany
- 3.2. United Kingdom
- 3.3. France
- 3.4. Italy
- 3.5. Rest of Europe
-
4. South America
- 4.1. Brazil
- 4.2. Argentina
- 4.3. Rest of South America
-
5. Middle East and Africa
- 5.1. Saudi Arabia
- 5.2. South Africa
- 5.3. Rest of Middle East and Africa
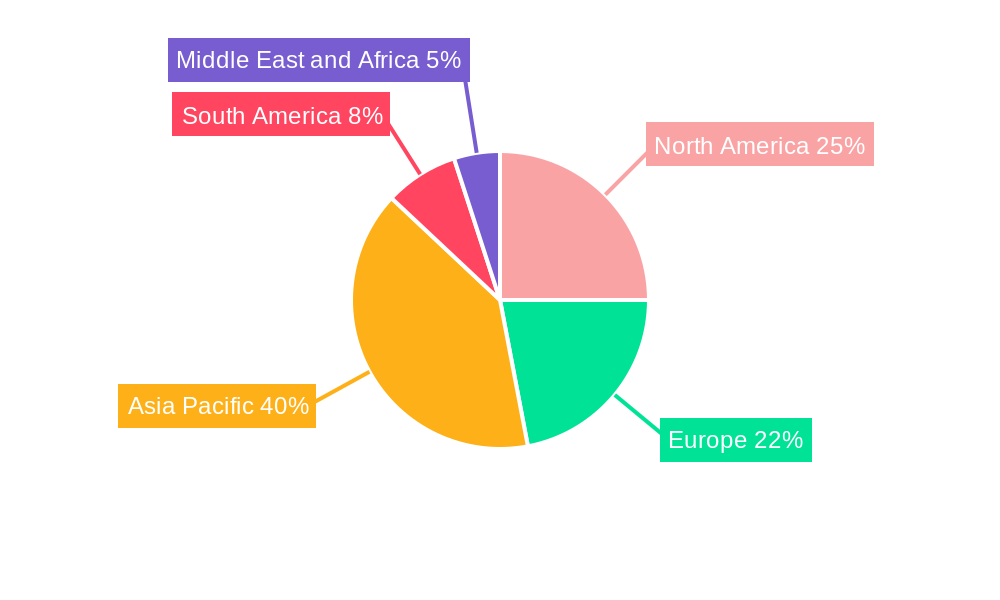
Antimicrobial Additives Industry Regional Market Share
Geographic Coverage of Antimicrobial Additives Industry
Antimicrobial Additives Industry REPORT HIGHLIGHTS
| Aspects | Details |
|---|---|
| Study Period | 2020-2034 |
| Base Year | 2025 |
| Estimated Year | 2026 |
| Forecast Period | 2026-2034 |
| Historical Period | 2020-2025 |
| Growth Rate | CAGR of 6.31% from 2020-2034 |
| Segmentation |
|
Table of Contents
- 1. Introduction
- 1.1. Research Scope
- 1.2. Market Segmentation
- 1.3. Research Objective
- 1.4. Definitions and Assumptions
- 2. Executive Summary
- 2.1. Market Snapshot
- 3. Market Dynamics
- 3.1. Market Drivers
- 3.2. Market Restrains
- 3.3. Market Trends
- 3.4. Market Opportunities
- 4. Market Factor Analysis
- 4.1. Porters Five Forces
- 4.1.1. Bargaining Power of Suppliers
- 4.1.2. Bargaining Power of Buyers
- 4.1.3. Threat of New Entrants
- 4.1.4. Threat of Substitutes
- 4.1.5. Competitive Rivalry
- 4.2. PESTEL analysis
- 4.3. BCG Analysis
- 4.3.1. Stars (High Growth, High Market Share)
- 4.3.2. Cash Cows (Low Growth, High Market Share)
- 4.3.3. Question Mark (High Growth, Low Market Share)
- 4.3.4. Dogs (Low Growth, Low Market Share)
- 4.4. Ansoff Matrix Analysis
- 4.5. Supply Chain Analysis
- 4.6. Regulatory Landscape
- 4.7. Current Market Potential and Opportunity Assessment (TAM–SAM–SOM Framework)
- 4.8. NRP Analyst Note
- 4.1. Porters Five Forces
- 5. Market Analysis, Insights and Forecast 2021-2033
- 5.1. Market Analysis, Insights and Forecast - by Type
- 5.1.1. Organic
- 5.1.2. Inorganic
- 5.2. Market Analysis, Insights and Forecast - by Application
- 5.2.1. Plastic
- 5.2.2. Paints
- 5.2.3. Pulp and Paper
- 5.2.4. Others
- 5.3. Market Analysis, Insights and Forecast - by End-user Industry
- 5.3.1. Construction
- 5.3.2. Automotive
- 5.3.3. Healthcare
- 5.3.4. Food and Beverage
- 5.3.5. Others
- 5.4. Market Analysis, Insights and Forecast - by Region
- 5.4.1. Asia Pacific
- 5.4.2. North America
- 5.4.3. Europe
- 5.4.4. South America
- 5.4.5. Middle East and Africa
- 5.1. Market Analysis, Insights and Forecast - by Type
- 6. Global Antimicrobial Additives Industry Analysis, Insights and Forecast, 2021-2033
- 6.1. Market Analysis, Insights and Forecast - by Type
- 6.1.1. Organic
- 6.1.2. Inorganic
- 6.2. Market Analysis, Insights and Forecast - by Application
- 6.2.1. Plastic
- 6.2.2. Paints
- 6.2.3. Pulp and Paper
- 6.2.4. Others
- 6.3. Market Analysis, Insights and Forecast - by End-user Industry
- 6.3.1. Construction
- 6.3.2. Automotive
- 6.3.3. Healthcare
- 6.3.4. Food and Beverage
- 6.3.5. Others
- 6.1. Market Analysis, Insights and Forecast - by Type
- 7. Asia Pacific Antimicrobial Additives Industry Analysis, Insights and Forecast, 2020-2032
- 7.1. Market Analysis, Insights and Forecast - by Type
- 7.1.1. Organic
- 7.1.2. Inorganic
- 7.2. Market Analysis, Insights and Forecast - by Application
- 7.2.1. Plastic
- 7.2.2. Paints
- 7.2.3. Pulp and Paper
- 7.2.4. Others
- 7.3. Market Analysis, Insights and Forecast - by End-user Industry
- 7.3.1. Construction
- 7.3.2. Automotive
- 7.3.3. Healthcare
- 7.3.4. Food and Beverage
- 7.3.5. Others
- 7.1. Market Analysis, Insights and Forecast - by Type
- 8. North America Antimicrobial Additives Industry Analysis, Insights and Forecast, 2020-2032
- 8.1. Market Analysis, Insights and Forecast - by Type
- 8.1.1. Organic
- 8.1.2. Inorganic
- 8.2. Market Analysis, Insights and Forecast - by Application
- 8.2.1. Plastic
- 8.2.2. Paints
- 8.2.3. Pulp and Paper
- 8.2.4. Others
- 8.3. Market Analysis, Insights and Forecast - by End-user Industry
- 8.3.1. Construction
- 8.3.2. Automotive
- 8.3.3. Healthcare
- 8.3.4. Food and Beverage
- 8.3.5. Others
- 8.1. Market Analysis, Insights and Forecast - by Type
- 9. Europe Antimicrobial Additives Industry Analysis, Insights and Forecast, 2020-2032
- 9.1. Market Analysis, Insights and Forecast - by Type
- 9.1.1. Organic
- 9.1.2. Inorganic
- 9.2. Market Analysis, Insights and Forecast - by Application
- 9.2.1. Plastic
- 9.2.2. Paints
- 9.2.3. Pulp and Paper
- 9.2.4. Others
- 9.3. Market Analysis, Insights and Forecast - by End-user Industry
- 9.3.1. Construction
- 9.3.2. Automotive
- 9.3.3. Healthcare
- 9.3.4. Food and Beverage
- 9.3.5. Others
- 9.1. Market Analysis, Insights and Forecast - by Type
- 10. South America Antimicrobial Additives Industry Analysis, Insights and Forecast, 2020-2032
- 10.1. Market Analysis, Insights and Forecast - by Type
- 10.1.1. Organic
- 10.1.2. Inorganic
- 10.2. Market Analysis, Insights and Forecast - by Application
- 10.2.1. Plastic
- 10.2.2. Paints
- 10.2.3. Pulp and Paper
- 10.2.4. Others
- 10.3. Market Analysis, Insights and Forecast - by End-user Industry
- 10.3.1. Construction
- 10.3.2. Automotive
- 10.3.3. Healthcare
- 10.3.4. Food and Beverage
- 10.3.5. Others
- 10.1. Market Analysis, Insights and Forecast - by Type
- 11. Middle East and Africa Antimicrobial Additives Industry Analysis, Insights and Forecast, 2020-2032
- 11.1. Market Analysis, Insights and Forecast - by Type
- 11.1.1. Organic
- 11.1.2. Inorganic
- 11.2. Market Analysis, Insights and Forecast - by Application
- 11.2.1. Plastic
- 11.2.2. Paints
- 11.2.3. Pulp and Paper
- 11.2.4. Others
- 11.3. Market Analysis, Insights and Forecast - by End-user Industry
- 11.3.1. Construction
- 11.3.2. Automotive
- 11.3.3. Healthcare
- 11.3.4. Food and Beverage
- 11.3.5. Others
- 11.1. Market Analysis, Insights and Forecast - by Type
- 12. Competitive Analysis
- 12.1. Company Profiles
- 12.1.1 NanoBioMatters
- 12.1.1.1. Company Overview
- 12.1.1.2. Products
- 12.1.1.3. Company Financials
- 12.1.1.4. SWOT Analysis
- 12.1.2 SANITIZED AG
- 12.1.2.1. Company Overview
- 12.1.2.2. Products
- 12.1.2.3. Company Financials
- 12.1.2.4. SWOT Analysis
- 12.1.3 Clariant
- 12.1.3.1. Company Overview
- 12.1.3.2. Products
- 12.1.3.3. Company Financials
- 12.1.3.4. SWOT Analysis
- 12.1.4 PolyOne
- 12.1.4.1. Company Overview
- 12.1.4.2. Products
- 12.1.4.3. Company Financials
- 12.1.4.4. SWOT Analysis
- 12.1.5 The DOW Chemical Company*List Not Exhaustive
- 12.1.5.1. Company Overview
- 12.1.5.2. Products
- 12.1.5.3. Company Financials
- 12.1.5.4. SWOT Analysis
- 12.1.6 Momentive
- 12.1.6.1. Company Overview
- 12.1.6.2. Products
- 12.1.6.3. Company Financials
- 12.1.6.4. SWOT Analysis
- 12.1.7 BASF SE
- 12.1.7.1. Company Overview
- 12.1.7.2. Products
- 12.1.7.3. Company Financials
- 12.1.7.4. SWOT Analysis
- 12.1.8 LyondellBasell Industries Holdings B V
- 12.1.8.1. Company Overview
- 12.1.8.2. Products
- 12.1.8.3. Company Financials
- 12.1.8.4. SWOT Analysis
- 12.1.9 RTP Company
- 12.1.9.1. Company Overview
- 12.1.9.2. Products
- 12.1.9.3. Company Financials
- 12.1.9.4. SWOT Analysis
- 12.1.10 BioCote Limited
- 12.1.10.1. Company Overview
- 12.1.10.2. Products
- 12.1.10.3. Company Financials
- 12.1.10.4. SWOT Analysis
- 12.1.11 Milliken Chemical
- 12.1.11.1. Company Overview
- 12.1.11.2. Products
- 12.1.11.3. Company Financials
- 12.1.11.4. SWOT Analysis
- 12.1.1 NanoBioMatters
- 12.2. Market Entropy
- 12.2.1 Company's Key Areas Served
- 12.2.2 Recent Developments
- 12.3. Company Market Share Analysis 2025
- 12.3.1 Top 5 Companies Market Share Analysis
- 12.3.2 Top 3 Companies Market Share Analysis
- 12.4. List of Potential Customers
- 13. Research Methodology
List of Figures
- Figure 1: Global Antimicrobial Additives Industry Revenue Breakdown (Million, %) by Region 2025 & 2033
- Figure 2: Asia Pacific Antimicrobial Additives Industry Revenue (Million), by Type 2025 & 2033
- Figure 3: Asia Pacific Antimicrobial Additives Industry Revenue Share (%), by Type 2025 & 2033
- Figure 4: Asia Pacific Antimicrobial Additives Industry Revenue (Million), by Application 2025 & 2033
- Figure 5: Asia Pacific Antimicrobial Additives Industry Revenue Share (%), by Application 2025 & 2033
- Figure 6: Asia Pacific Antimicrobial Additives Industry Revenue (Million), by End-user Industry 2025 & 2033
- Figure 7: Asia Pacific Antimicrobial Additives Industry Revenue Share (%), by End-user Industry 2025 & 2033
- Figure 8: Asia Pacific Antimicrobial Additives Industry Revenue (Million), by Country 2025 & 2033
- Figure 9: Asia Pacific Antimicrobial Additives Industry Revenue Share (%), by Country 2025 & 2033
- Figure 10: North America Antimicrobial Additives Industry Revenue (Million), by Type 2025 & 2033
- Figure 11: North America Antimicrobial Additives Industry Revenue Share (%), by Type 2025 & 2033
- Figure 12: North America Antimicrobial Additives Industry Revenue (Million), by Application 2025 & 2033
- Figure 13: North America Antimicrobial Additives Industry Revenue Share (%), by Application 2025 & 2033
- Figure 14: North America Antimicrobial Additives Industry Revenue (Million), by End-user Industry 2025 & 2033
- Figure 15: North America Antimicrobial Additives Industry Revenue Share (%), by End-user Industry 2025 & 2033
- Figure 16: North America Antimicrobial Additives Industry Revenue (Million), by Country 2025 & 2033
- Figure 17: North America Antimicrobial Additives Industry Revenue Share (%), by Country 2025 & 2033
- Figure 18: Europe Antimicrobial Additives Industry Revenue (Million), by Type 2025 & 2033
- Figure 19: Europe Antimicrobial Additives Industry Revenue Share (%), by Type 2025 & 2033
- Figure 20: Europe Antimicrobial Additives Industry Revenue (Million), by Application 2025 & 2033
- Figure 21: Europe Antimicrobial Additives Industry Revenue Share (%), by Application 2025 & 2033
- Figure 22: Europe Antimicrobial Additives Industry Revenue (Million), by End-user Industry 2025 & 2033
- Figure 23: Europe Antimicrobial Additives Industry Revenue Share (%), by End-user Industry 2025 & 2033
- Figure 24: Europe Antimicrobial Additives Industry Revenue (Million), by Country 2025 & 2033
- Figure 25: Europe Antimicrobial Additives Industry Revenue Share (%), by Country 2025 & 2033
- Figure 26: South America Antimicrobial Additives Industry Revenue (Million), by Type 2025 & 2033
- Figure 27: South America Antimicrobial Additives Industry Revenue Share (%), by Type 2025 & 2033
- Figure 28: South America Antimicrobial Additives Industry Revenue (Million), by Application 2025 & 2033
- Figure 29: South America Antimicrobial Additives Industry Revenue Share (%), by Application 2025 & 2033
- Figure 30: South America Antimicrobial Additives Industry Revenue (Million), by End-user Industry 2025 & 2033
- Figure 31: South America Antimicrobial Additives Industry Revenue Share (%), by End-user Industry 2025 & 2033
- Figure 32: South America Antimicrobial Additives Industry Revenue (Million), by Country 2025 & 2033
- Figure 33: South America Antimicrobial Additives Industry Revenue Share (%), by Country 2025 & 2033
- Figure 34: Middle East and Africa Antimicrobial Additives Industry Revenue (Million), by Type 2025 & 2033
- Figure 35: Middle East and Africa Antimicrobial Additives Industry Revenue Share (%), by Type 2025 & 2033
- Figure 36: Middle East and Africa Antimicrobial Additives Industry Revenue (Million), by Application 2025 & 2033
- Figure 37: Middle East and Africa Antimicrobial Additives Industry Revenue Share (%), by Application 2025 & 2033
- Figure 38: Middle East and Africa Antimicrobial Additives Industry Revenue (Million), by End-user Industry 2025 & 2033
- Figure 39: Middle East and Africa Antimicrobial Additives Industry Revenue Share (%), by End-user Industry 2025 & 2033
- Figure 40: Middle East and Africa Antimicrobial Additives Industry Revenue (Million), by Country 2025 & 2033
- Figure 41: Middle East and Africa Antimicrobial Additives Industry Revenue Share (%), by Country 2025 & 2033
List of Tables
- Table 1: Global Antimicrobial Additives Industry Revenue Million Forecast, by Type 2020 & 2033
- Table 2: Global Antimicrobial Additives Industry Revenue Million Forecast, by Application 2020 & 2033
- Table 3: Global Antimicrobial Additives Industry Revenue Million Forecast, by End-user Industry 2020 & 2033
- Table 4: Global Antimicrobial Additives Industry Revenue Million Forecast, by Region 2020 & 2033
- Table 5: Global Antimicrobial Additives Industry Revenue Million Forecast, by Type 2020 & 2033
- Table 6: Global Antimicrobial Additives Industry Revenue Million Forecast, by Application 2020 & 2033
- Table 7: Global Antimicrobial Additives Industry Revenue Million Forecast, by End-user Industry 2020 & 2033
- Table 8: Global Antimicrobial Additives Industry Revenue Million Forecast, by Country 2020 & 2033
- Table 9: China Antimicrobial Additives Industry Revenue (Million) Forecast, by Application 2020 & 2033
- Table 10: India Antimicrobial Additives Industry Revenue (Million) Forecast, by Application 2020 & 2033
- Table 11: Japan Antimicrobial Additives Industry Revenue (Million) Forecast, by Application 2020 & 2033
- Table 12: South Korea Antimicrobial Additives Industry Revenue (Million) Forecast, by Application 2020 & 2033
- Table 13: Rest of Asia Pacific Antimicrobial Additives Industry Revenue (Million) Forecast, by Application 2020 & 2033
- Table 14: Global Antimicrobial Additives Industry Revenue Million Forecast, by Type 2020 & 2033
- Table 15: Global Antimicrobial Additives Industry Revenue Million Forecast, by Application 2020 & 2033
- Table 16: Global Antimicrobial Additives Industry Revenue Million Forecast, by End-user Industry 2020 & 2033
- Table 17: Global Antimicrobial Additives Industry Revenue Million Forecast, by Country 2020 & 2033
- Table 18: United States Antimicrobial Additives Industry Revenue (Million) Forecast, by Application 2020 & 2033
- Table 19: Canada Antimicrobial Additives Industry Revenue (Million) Forecast, by Application 2020 & 2033
- Table 20: Mexico Antimicrobial Additives Industry Revenue (Million) Forecast, by Application 2020 & 2033
- Table 21: Global Antimicrobial Additives Industry Revenue Million Forecast, by Type 2020 & 2033
- Table 22: Global Antimicrobial Additives Industry Revenue Million Forecast, by Application 2020 & 2033
- Table 23: Global Antimicrobial Additives Industry Revenue Million Forecast, by End-user Industry 2020 & 2033
- Table 24: Global Antimicrobial Additives Industry Revenue Million Forecast, by Country 2020 & 2033
- Table 25: Germany Antimicrobial Additives Industry Revenue (Million) Forecast, by Application 2020 & 2033
- Table 26: United Kingdom Antimicrobial Additives Industry Revenue (Million) Forecast, by Application 2020 & 2033
- Table 27: France Antimicrobial Additives Industry Revenue (Million) Forecast, by Application 2020 & 2033
- Table 28: Italy Antimicrobial Additives Industry Revenue (Million) Forecast, by Application 2020 & 2033
- Table 29: Rest of Europe Antimicrobial Additives Industry Revenue (Million) Forecast, by Application 2020 & 2033
- Table 30: Global Antimicrobial Additives Industry Revenue Million Forecast, by Type 2020 & 2033
- Table 31: Global Antimicrobial Additives Industry Revenue Million Forecast, by Application 2020 & 2033
- Table 32: Global Antimicrobial Additives Industry Revenue Million Forecast, by End-user Industry 2020 & 2033
- Table 33: Global Antimicrobial Additives Industry Revenue Million Forecast, by Country 2020 & 2033
- Table 34: Brazil Antimicrobial Additives Industry Revenue (Million) Forecast, by Application 2020 & 2033
- Table 35: Argentina Antimicrobial Additives Industry Revenue (Million) Forecast, by Application 2020 & 2033
- Table 36: Rest of South America Antimicrobial Additives Industry Revenue (Million) Forecast, by Application 2020 & 2033
- Table 37: Global Antimicrobial Additives Industry Revenue Million Forecast, by Type 2020 & 2033
- Table 38: Global Antimicrobial Additives Industry Revenue Million Forecast, by Application 2020 & 2033
- Table 39: Global Antimicrobial Additives Industry Revenue Million Forecast, by End-user Industry 2020 & 2033
- Table 40: Global Antimicrobial Additives Industry Revenue Million Forecast, by Country 2020 & 2033
- Table 41: Saudi Arabia Antimicrobial Additives Industry Revenue (Million) Forecast, by Application 2020 & 2033
- Table 42: South Africa Antimicrobial Additives Industry Revenue (Million) Forecast, by Application 2020 & 2033
- Table 43: Rest of Middle East and Africa Antimicrobial Additives Industry Revenue (Million) Forecast, by Application 2020 & 2033
Frequently Asked Questions
1. What is the projected Compound Annual Growth Rate (CAGR) of the Antimicrobial Additives Industry?
The projected CAGR is approximately 6.31%.
2. Which companies are prominent players in the Antimicrobial Additives Industry?
Key companies in the market include NanoBioMatters, SANITIZED AG, Clariant, PolyOne, The DOW Chemical Company*List Not Exhaustive, Momentive, BASF SE, LyondellBasell Industries Holdings B V, RTP Company, BioCote Limited, Milliken Chemical.
3. What are the main segments of the Antimicrobial Additives Industry?
The market segments include Type, Application, End-user Industry.
4. Can you provide details about the market size?
The market size is estimated to be USD 4.88 Million as of 2022.
5. What are some drivers contributing to market growth?
; Increasing Food Packaging Segment; Growing Use of Antimicrobial Additive in Plastic Application.
6. What are the notable trends driving market growth?
Plastic Segment to Dominate the Market.
7. Are there any restraints impacting market growth?
; Toxic Nature of Antimicrobial Additive; Unfavorable Conditions Arising Due to COVID-19 Outbreak.
8. Can you provide examples of recent developments in the market?
N/A
9. What pricing options are available for accessing the report?
Pricing options include single-user, multi-user, and enterprise licenses priced at USD 4750, USD 5250, and USD 8750 respectively.
10. Is the market size provided in terms of value or volume?
The market size is provided in terms of value, measured in Million.
11. Are there any specific market keywords associated with the report?
Yes, the market keyword associated with the report is "Antimicrobial Additives Industry," which aids in identifying and referencing the specific market segment covered.
12. How do I determine which pricing option suits my needs best?
The pricing options vary based on user requirements and access needs. Individual users may opt for single-user licenses, while businesses requiring broader access may choose multi-user or enterprise licenses for cost-effective access to the report.
13. Are there any additional resources or data provided in the Antimicrobial Additives Industry report?
While the report offers comprehensive insights, it's advisable to review the specific contents or supplementary materials provided to ascertain if additional resources or data are available.
14. How can I stay updated on further developments or reports in the Antimicrobial Additives Industry?
To stay informed about further developments, trends, and reports in the Antimicrobial Additives Industry, consider subscribing to industry newsletters, following relevant companies and organizations, or regularly checking reputable industry news sources and publications.
Methodology
Step 1 - Identification of Relevant Samples Size from Population Database


Step 2 - Approaches for Defining Global Market Size (Value, Volume* & Price*)

Note*: In applicable scenarios
Step 3 - Data Sources
Primary Research
- Web Analytics
- Survey Reports
- Research Institute
- Latest Research Reports
- Opinion Leaders
Secondary Research
- Annual Reports
- White Paper
- Latest Press Release
- Industry Association
- Paid Database
- Investor Presentations

Step 4 - Data Triangulation
Involves using different sources of information in order to increase the validity of a study
These sources are likely to be stakeholders in a program - participants, other researchers, program staff, other community members, and so on.
Then we put all data in single framework & apply various statistical tools to find out the dynamic on the market.
During the analysis stage, feedback from the stakeholder groups would be compared to determine areas of agreement as well as areas of divergence