

Key Insights
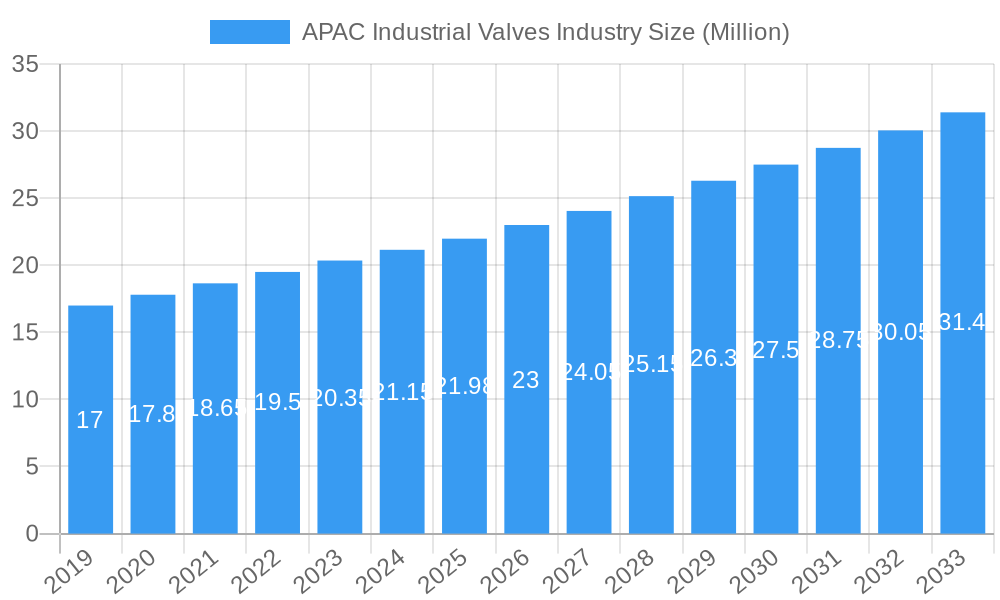
The APAC Industrial Valves Market is poised for robust expansion, projected to reach an impressive USD 21.98 Billion by 2025, exhibiting a Compound Annual Growth Rate (CAGR) of 5.67% through 2033. This growth is fueled by significant industrialization and infrastructure development across the region, particularly in key sectors like oil and gas, power generation, and water treatment. The increasing demand for efficient fluid management in these industries necessitates the adoption of advanced industrial valve technologies. Drivers such as stringent environmental regulations promoting energy efficiency and leak prevention are further propelling the market. Moreover, the burgeoning manufacturing sector, coupled with a growing emphasis on smart and automated control systems, is creating substantial opportunities for valve manufacturers. The market's trajectory is also influenced by the continuous innovation in valve design, materials, and integration with digital technologies, leading to enhanced performance, reliability, and reduced operational costs for end-users.
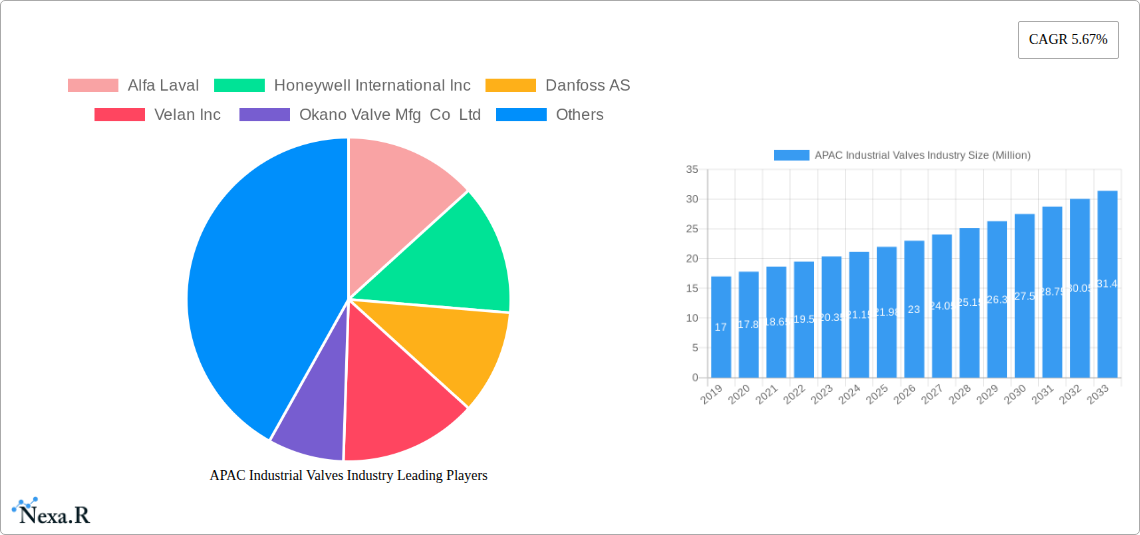
APAC Industrial Valves Industry Market Size (In Million)
The competitive landscape of the APAC Industrial Valves Market is characterized by the presence of both global giants and emerging regional players. Key trends include a rising demand for specialized valves like quarter-turn and multi-turn variants, driven by the increasing complexity of industrial processes. The oil and gas sector, encompassing upstream, mid-stream, and downstream operations, remains a dominant application segment, followed by the power generation and water & wastewater treatment industries. Geographically, China and India are expected to lead market growth due to their vast industrial bases and ongoing infrastructure projects. While restraints such as fluctuating raw material prices and intense price competition exist, the overarching trend of technological advancement and the need for operational efficiency in critical industrial applications will continue to drive the market forward. Strategic collaborations, mergers, and acquisitions are likely to shape the market, enabling companies to expand their product portfolios and geographic reach.
APAC Industrial Valves Industry Company Market Share
APAC Industrial Valves Market: Comprehensive Growth Report (2019-2033)
This in-depth report provides a definitive analysis of the APAC industrial valves market, covering critical segments, applications, and growth trajectories from 2019 to 2033. With a base year of 2025 and a forecast period extending to 2033, this study leverages high-traffic keywords and parent-child market insights to deliver unparalleled SEO visibility and actionable intelligence for industry professionals. Explore the dynamics of butterfly valves, ball valves, globe valves, gate valves, plug valves, control valves, quarter-turn valves, and multi-turn valves across key applications like oil and gas (upstream, mid-stream, downstream), power, water treatment, chemicals, food processing, pulp and paper, and mining. Gain insights into market size, technological advancements, and competitive landscapes in China, India, Japan, South Korea, Malaysia, Thailand, Indonesia, and Vietnam. All values are presented in Million Units, with a focus on predicted values where specific data is unavailable.
APAC Industrial Valves Industry Market Dynamics & Structure
The APAC industrial valves market exhibits a moderately concentrated structure, with a few global players holding significant market share, alongside a growing number of regional and local manufacturers. Technological innovation is a key driver, fueled by the demand for advanced control valves and high-performance materials capable of withstanding extreme conditions in oil and gas and power applications. Regulatory frameworks, particularly concerning environmental standards and safety in sectors like chemicals and food processing, are increasingly influencing product development and adoption. Competitive product substitutes are emerging, especially in niche applications, prompting established players to focus on value-added solutions and integrated services. End-user demographics are shifting, with an increasing reliance on automation and digital solutions across all sectors. Merger and acquisition (M&A) trends are evident, as larger companies seek to expand their product portfolios and geographical reach within the dynamic APAC region.
- Market Concentration: Dominated by a mix of multinational corporations and strong local players, with an increasing trend towards consolidation.
- Technological Innovation Drivers: Demand for smart valves, IoT integration, energy efficiency, and advanced materials for extreme environments.
- Regulatory Frameworks: Growing emphasis on emissions control, safety standards (e.g., API, ISO), and environmental compliance.
- Competitive Product Substitutes: Innovation in alternative sealing technologies and smart fluid control systems.
- End-User Demographics: Shift towards digital integration, predictive maintenance, and lifecycle service offerings.
- M&A Trends: Strategic acquisitions to gain market access, technological expertise, and expanded product lines.
APAC Industrial Valves Industry Growth Trends & Insights
The APAC industrial valves market is poised for robust growth, driven by rapid industrialization and infrastructure development across the region. Market size is projected to expand significantly, with butterfly valves and ball valves expected to lead in volume and value due to their widespread application in various industries. Adoption rates of advanced control valves are accelerating, propelled by the increasing automation in oil and gas, power generation, and water treatment plants. Technological disruptions are primarily centered around the integration of IoT, artificial intelligence (AI), and advanced analytics for predictive maintenance and operational efficiency. These technologies enable real-time monitoring, diagnostics, and remote control, enhancing the reliability and lifespan of industrial valves. Consumer behavior is shifting towards a preference for integrated solutions, focusing on total cost of ownership rather than just initial purchase price. This includes a demand for lifecycle services, customized solutions, and sustainable product offerings. The region's burgeoning manufacturing sector, coupled with substantial investments in renewable energy and infrastructure projects, further fuels the demand for high-performance industrial valves.
- Market Size Evolution: Projected to witness a substantial Compound Annual Growth Rate (CAGR) of XX% from 2025-2033, reaching an estimated market value of X,XXX Million Units by 2033.
- Adoption Rates: Increasing adoption of smart valves and digital twin technologies for enhanced operational efficiency and predictive maintenance.
- Technological Disruptions: Integration of IoT, AI, and data analytics for real-time monitoring, diagnostics, and remote control capabilities.
- Consumer Behavior Shifts: Growing preference for lifecycle services, customized solutions, and energy-efficient, sustainable valve products.
- Market Penetration: Significant growth expected in emerging economies within APAC, driven by infrastructure development and industrial expansion.
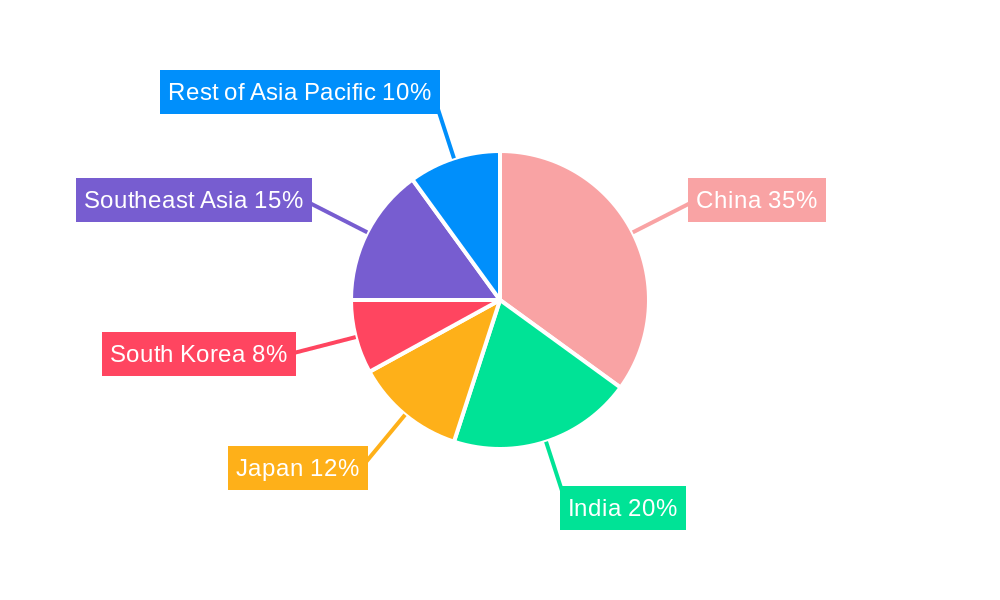
Dominant Regions, Countries, or Segments in APAC Industrial Valves Industry
China is unequivocally the dominant region in the APAC industrial valves market, driven by its colossal manufacturing base, substantial investments in infrastructure, and a rapidly expanding energy sector. Within China, the oil and gas segment, encompassing upstream, mid-stream, and downstream operations, is a primary consumer of industrial valves, with particular demand for ball valves and gate valves for pipeline transportation and processing. The power sector, including both traditional and renewable energy sources, also represents a significant market for various valve types, especially globe valves for precise flow control.
Geographically, China leads due to its sheer market size and industrial output. However, India is emerging as a rapidly growing market, fueled by government initiatives like "Make in India" and significant investments in infrastructure, water treatment, and the oil and gas sector. South Korea and Japan remain key markets, characterized by a focus on high-technology applications, precision engineering, and advanced control valves for industries such as electronics and specialized manufacturing.
- Dominant Country: China, accounting for an estimated XX% of the total APAC industrial valves market share in 2025.
- Key Drivers in China: Massive industrial output, extensive oil and gas exploration and refining, rapid development of power infrastructure (including renewables), and government support for manufacturing.
- Emerging Market: India, exhibiting a CAGR of XX% during the forecast period, driven by infrastructure projects, water scarcity solutions, and the expanding chemical and petrochemical industries.
- Technological Hubs: Japan and South Korea, focusing on high-performance and smart valve technologies for advanced manufacturing and automation.
- Segment Dominance: Ball valves and gate valves are leading by volume due to their widespread use in oil and gas and water infrastructure. Control valves are experiencing rapid growth in adoption.
- Application Dominance: Oil and Gas, followed closely by Power and Water treatment, are the largest application segments.
APAC Industrial Valves Industry Product Landscape
The APAC industrial valves market is characterized by a diverse product landscape, with established offerings like butterfly valves, ball valves, globe valves, gate valves, and plug valves continuing to dominate. However, there's a significant push towards innovation in control valves and specialized quarter-turn and multi-turn valves designed for enhanced precision, durability, and energy efficiency. Product innovations are increasingly focused on materials science, incorporating advanced alloys and coatings for corrosive environments and extreme temperatures encountered in oil and gas and chemical processing. Smart valve technologies, featuring integrated sensors and connectivity for remote monitoring and diagnostics, are gaining traction. These advancements translate into improved performance metrics such as tighter shut-off capabilities, reduced leakage rates, and extended service life, providing unique selling propositions for manufacturers in this competitive market.
Key Drivers, Barriers & Challenges in APAC Industrial Valves Industry
The APAC industrial valves market is propelled by several key drivers. Rapid industrialization and infrastructure development across emerging economies, particularly in China and India, create a sustained demand for a wide range of industrial valves. Government initiatives promoting manufacturing and energy security, coupled with increasing investments in the oil and gas sector, particularly in exploration and refining, are significant growth catalysts. The growing emphasis on water treatment and management, driven by population growth and environmental concerns, also fuels demand for specialized valves.
However, the market faces several barriers and challenges. Intense price competition, especially from local manufacturers, can exert pressure on profit margins for global players. Supply chain disruptions, as seen in recent global events, can impact lead times and the availability of raw materials. Stringent regulatory compliance in certain sectors, such as chemicals and food processing, requires significant investment in product development and certification. Furthermore, the need for skilled labor to install, operate, and maintain sophisticated valve systems can be a constraint in some developing regions.
Emerging Opportunities in APAC Industrial Valves Industry
Emerging opportunities in the APAC industrial valves market lie in the growing demand for smart and connected valve solutions, driven by Industry 4.0 initiatives. The increasing focus on sustainable practices and environmental regulations is opening avenues for energy-efficient valves and solutions for emissions control. The expansion of renewable energy projects, such as solar and wind farms, presents new application areas for specialized valve technologies. Furthermore, the aging infrastructure in some developed APAC nations necessitates replacement and upgrades, creating a consistent demand for high-quality industrial valves. Untapped markets in Southeast Asia and the growing industrialization of countries like Vietnam and Indonesia offer significant expansion potential.
Growth Accelerators in the APAC Industrial Valves Industry Industry
Several factors are acting as growth accelerators for the APAC industrial valves industry. Technological breakthroughs in smart valve technology, including the integration of AI and IoT for predictive maintenance and remote monitoring, are enhancing operational efficiency and reducing downtime for end-users. Strategic partnerships and collaborations between valve manufacturers and technology providers are enabling the development of more integrated and intelligent fluid control solutions. Market expansion strategies, including mergers, acquisitions, and the establishment of local manufacturing and service hubs, are allowing companies to better serve the diverse needs of the APAC region. The ongoing digital transformation across industries is creating a continuous demand for advanced valve components that can seamlessly integrate into automated systems.
Key Players Shaping the APAC Industrial Valves Industry Market
- Alfa Laval
- Honeywell International Inc
- Danfoss AS
- Velan Inc
- Okano Valve Mfg Co Ltd
- SAMSON AKTIENGESELLSCHAFT
- Flowserve Corporation
- The Weir Group PLC
- Georg Fischer Ltd
- Baker Hughes
- Emerson Electric Co
- CIRCOR International Inc
- AVK Holding AS
- PARKER HANNIFIN CORP
- EBRO ARMATUREN Gebr Brer GmbH
- Hitachi Metals Ltd
- ITT Inc
- NIBCO
- IMI Critical Engineering
- Crane Co
- Valvitalia SpA
- Curtiss-Wright Corporation
- Schlumberger Limited
- KITZ Corporation
Notable Milestones in APAC Industrial Valves Industry Sector
- March 2022: Flowserve announced a partnership with Gradiant to accelerate growth in the water technology market. Gradiant develops and delivers advanced water and wastewater treatment facilities with a primary focus in the Asia Pacific.
- February 2022: Emerson announced the opening of a new integrated manufacturing facility at Mahindra World City in Chennai, Tamil Nadu. At its new Chennai facility, Emerson has integrated manufacturing under one roof to leverage production synergies for some of its industry-leading products. This facility will manufacture fluid control and pneumatics products, including solenoid valves, air preparation units, cylinders, pneumatic valves and manifolds, position monitoring, and high-pressure regulators for Emerson's field-proven brand ASCO, AVENTICS, TopWorx, and TESCOM. The facility also makes Emerson pressure management products, including pressure regulators, cryogenic service valves, tank safety products, and blow-off/blow-down valves for its Fisher, Jeon, Enardo, Varec, Cash, and Yarway brands.
In-Depth APAC Industrial Valves Industry Market Outlook
The APAC industrial valves market is set for sustained growth, driven by continued industrial expansion and technological advancements. Future market potential lies in the increasing adoption of smart valves with advanced digital capabilities, catering to the Industry 4.0 revolution. Strategic opportunities include focusing on sustainable solutions, supporting the burgeoning renewable energy sector, and addressing the upgrade needs of aging infrastructure. The evolving regulatory landscape will also necessitate innovative valve designs that meet stringent environmental and safety standards. The market outlook is exceptionally positive, with a clear trajectory towards more intelligent, efficient, and sustainable fluid control systems shaping the future of industrial operations across the Asia-Pacific region.
APAC Industrial Valves Industry Segmentation
-
1. Type
- 1.1. Butterfly Valve
- 1.2. Ball Valve
- 1.3. Globe Valve
- 1.4. Gate Valve
- 1.5. Plug Valve
- 1.6. Other Types
-
2. Product
- 2.1. Quarter-turn Valve
- 2.2. Multi-turn Valve
- 2.3. Other Products (Control Valves)
-
3. Application
- 3.1. Power
-
3.2. Water an
- 3.2.1. Metal, Mineral, and Mining
- 3.2.2. Other Applications
- 3.3. By Chemicals
-
3.4. Oil and Gas
- 3.4.1. Upstream
- 3.4.2. Mid-stream
- 3.4.3. Downstream
- 3.5. Food Processing
- 3.6. Pulp and Paper
-
4. Geography
- 4.1. China
- 4.2. India
- 4.3. Japan
- 4.4. South Korea
- 4.5. Malaysia
- 4.6. Thailand
- 4.7. Indonesia
- 4.8. Vietnam
- 4.9. Rest of Asia-Pacific
APAC Industrial Valves Industry Segmentation By Geography
- 1. China
- 2. India
- 3. Japan
- 4. South Korea
- 5. Malaysia
- 6. Thailand
- 7. Indonesia
- 8. Vietnam
- 9. Rest of Asia Pacific
APAC Industrial Valves Industry Regional Market Share
Geographic Coverage of APAC Industrial Valves Industry
APAC Industrial Valves Industry REPORT HIGHLIGHTS
| Aspects | Details |
|---|---|
| Study Period | 2020-2034 |
| Base Year | 2025 |
| Estimated Year | 2026 |
| Forecast Period | 2026-2034 |
| Historical Period | 2020-2025 |
| Growth Rate | CAGR of 5.67% from 2020-2034 |
| Segmentation |
|
Table of Contents
- 1. Introduction
- 1.1. Research Scope
- 1.2. Market Segmentation
- 1.3. Research Objective
- 1.4. Definitions and Assumptions
- 2. Executive Summary
- 2.1. Market Snapshot
- 3. Market Dynamics
- 3.1. Market Drivers
- 3.2. Market Restrains
- 3.3. Market Trends
- 3.4. Market Opportunities
- 4. Market Factor Analysis
- 4.1. Porters Five Forces
- 4.1.1. Bargaining Power of Suppliers
- 4.1.2. Bargaining Power of Buyers
- 4.1.3. Threat of New Entrants
- 4.1.4. Threat of Substitutes
- 4.1.5. Competitive Rivalry
- 4.2. PESTEL analysis
- 4.3. BCG Analysis
- 4.3.1. Stars (High Growth, High Market Share)
- 4.3.2. Cash Cows (Low Growth, High Market Share)
- 4.3.3. Question Mark (High Growth, Low Market Share)
- 4.3.4. Dogs (Low Growth, Low Market Share)
- 4.4. Ansoff Matrix Analysis
- 4.5. Supply Chain Analysis
- 4.6. Regulatory Landscape
- 4.7. Current Market Potential and Opportunity Assessment (TAM–SAM–SOM Framework)
- 4.8. NRP Analyst Note
- 4.1. Porters Five Forces
- 5. Market Analysis, Insights and Forecast 2021-2033
- 5.1. Market Analysis, Insights and Forecast - by Type
- 5.1.1. Butterfly Valve
- 5.1.2. Ball Valve
- 5.1.3. Globe Valve
- 5.1.4. Gate Valve
- 5.1.5. Plug Valve
- 5.1.6. Other Types
- 5.2. Market Analysis, Insights and Forecast - by Product
- 5.2.1. Quarter-turn Valve
- 5.2.2. Multi-turn Valve
- 5.2.3. Other Products (Control Valves)
- 5.3. Market Analysis, Insights and Forecast - by Application
- 5.3.1. Power
- 5.3.2. Water an
- 5.3.2.1. Metal, Mineral, and Mining
- 5.3.2.2. Other Applications
- 5.3.3. By Chemicals
- 5.3.4. Oil and Gas
- 5.3.4.1. Upstream
- 5.3.4.2. Mid-stream
- 5.3.4.3. Downstream
- 5.3.5. Food Processing
- 5.3.6. Pulp and Paper
- 5.4. Market Analysis, Insights and Forecast - by Geography
- 5.4.1. China
- 5.4.2. India
- 5.4.3. Japan
- 5.4.4. South Korea
- 5.4.5. Malaysia
- 5.4.6. Thailand
- 5.4.7. Indonesia
- 5.4.8. Vietnam
- 5.4.9. Rest of Asia-Pacific
- 5.5. Market Analysis, Insights and Forecast - by Region
- 5.5.1. China
- 5.5.2. India
- 5.5.3. Japan
- 5.5.4. South Korea
- 5.5.5. Malaysia
- 5.5.6. Thailand
- 5.5.7. Indonesia
- 5.5.8. Vietnam
- 5.5.9. Rest of Asia Pacific
- 5.1. Market Analysis, Insights and Forecast - by Type
- 6. Global APAC Industrial Valves Industry Analysis, Insights and Forecast, 2021-2033
- 6.1. Market Analysis, Insights and Forecast - by Type
- 6.1.1. Butterfly Valve
- 6.1.2. Ball Valve
- 6.1.3. Globe Valve
- 6.1.4. Gate Valve
- 6.1.5. Plug Valve
- 6.1.6. Other Types
- 6.2. Market Analysis, Insights and Forecast - by Product
- 6.2.1. Quarter-turn Valve
- 6.2.2. Multi-turn Valve
- 6.2.3. Other Products (Control Valves)
- 6.3. Market Analysis, Insights and Forecast - by Application
- 6.3.1. Power
- 6.3.2. Water an
- 6.3.2.1. Metal, Mineral, and Mining
- 6.3.2.2. Other Applications
- 6.3.3. By Chemicals
- 6.3.4. Oil and Gas
- 6.3.4.1. Upstream
- 6.3.4.2. Mid-stream
- 6.3.4.3. Downstream
- 6.3.5. Food Processing
- 6.3.6. Pulp and Paper
- 6.4. Market Analysis, Insights and Forecast - by Geography
- 6.4.1. China
- 6.4.2. India
- 6.4.3. Japan
- 6.4.4. South Korea
- 6.4.5. Malaysia
- 6.4.6. Thailand
- 6.4.7. Indonesia
- 6.4.8. Vietnam
- 6.4.9. Rest of Asia-Pacific
- 6.1. Market Analysis, Insights and Forecast - by Type
- 7. China APAC Industrial Valves Industry Analysis, Insights and Forecast, 2020-2032
- 7.1. Market Analysis, Insights and Forecast - by Type
- 7.1.1. Butterfly Valve
- 7.1.2. Ball Valve
- 7.1.3. Globe Valve
- 7.1.4. Gate Valve
- 7.1.5. Plug Valve
- 7.1.6. Other Types
- 7.2. Market Analysis, Insights and Forecast - by Product
- 7.2.1. Quarter-turn Valve
- 7.2.2. Multi-turn Valve
- 7.2.3. Other Products (Control Valves)
- 7.3. Market Analysis, Insights and Forecast - by Application
- 7.3.1. Power
- 7.3.2. Water an
- 7.3.2.1. Metal, Mineral, and Mining
- 7.3.2.2. Other Applications
- 7.3.3. By Chemicals
- 7.3.4. Oil and Gas
- 7.3.4.1. Upstream
- 7.3.4.2. Mid-stream
- 7.3.4.3. Downstream
- 7.3.5. Food Processing
- 7.3.6. Pulp and Paper
- 7.4. Market Analysis, Insights and Forecast - by Geography
- 7.4.1. China
- 7.4.2. India
- 7.4.3. Japan
- 7.4.4. South Korea
- 7.4.5. Malaysia
- 7.4.6. Thailand
- 7.4.7. Indonesia
- 7.4.8. Vietnam
- 7.4.9. Rest of Asia-Pacific
- 7.1. Market Analysis, Insights and Forecast - by Type
- 8. India APAC Industrial Valves Industry Analysis, Insights and Forecast, 2020-2032
- 8.1. Market Analysis, Insights and Forecast - by Type
- 8.1.1. Butterfly Valve
- 8.1.2. Ball Valve
- 8.1.3. Globe Valve
- 8.1.4. Gate Valve
- 8.1.5. Plug Valve
- 8.1.6. Other Types
- 8.2. Market Analysis, Insights and Forecast - by Product
- 8.2.1. Quarter-turn Valve
- 8.2.2. Multi-turn Valve
- 8.2.3. Other Products (Control Valves)
- 8.3. Market Analysis, Insights and Forecast - by Application
- 8.3.1. Power
- 8.3.2. Water an
- 8.3.2.1. Metal, Mineral, and Mining
- 8.3.2.2. Other Applications
- 8.3.3. By Chemicals
- 8.3.4. Oil and Gas
- 8.3.4.1. Upstream
- 8.3.4.2. Mid-stream
- 8.3.4.3. Downstream
- 8.3.5. Food Processing
- 8.3.6. Pulp and Paper
- 8.4. Market Analysis, Insights and Forecast - by Geography
- 8.4.1. China
- 8.4.2. India
- 8.4.3. Japan
- 8.4.4. South Korea
- 8.4.5. Malaysia
- 8.4.6. Thailand
- 8.4.7. Indonesia
- 8.4.8. Vietnam
- 8.4.9. Rest of Asia-Pacific
- 8.1. Market Analysis, Insights and Forecast - by Type
- 9. Japan APAC Industrial Valves Industry Analysis, Insights and Forecast, 2020-2032
- 9.1. Market Analysis, Insights and Forecast - by Type
- 9.1.1. Butterfly Valve
- 9.1.2. Ball Valve
- 9.1.3. Globe Valve
- 9.1.4. Gate Valve
- 9.1.5. Plug Valve
- 9.1.6. Other Types
- 9.2. Market Analysis, Insights and Forecast - by Product
- 9.2.1. Quarter-turn Valve
- 9.2.2. Multi-turn Valve
- 9.2.3. Other Products (Control Valves)
- 9.3. Market Analysis, Insights and Forecast - by Application
- 9.3.1. Power
- 9.3.2. Water an
- 9.3.2.1. Metal, Mineral, and Mining
- 9.3.2.2. Other Applications
- 9.3.3. By Chemicals
- 9.3.4. Oil and Gas
- 9.3.4.1. Upstream
- 9.3.4.2. Mid-stream
- 9.3.4.3. Downstream
- 9.3.5. Food Processing
- 9.3.6. Pulp and Paper
- 9.4. Market Analysis, Insights and Forecast - by Geography
- 9.4.1. China
- 9.4.2. India
- 9.4.3. Japan
- 9.4.4. South Korea
- 9.4.5. Malaysia
- 9.4.6. Thailand
- 9.4.7. Indonesia
- 9.4.8. Vietnam
- 9.4.9. Rest of Asia-Pacific
- 9.1. Market Analysis, Insights and Forecast - by Type
- 10. South Korea APAC Industrial Valves Industry Analysis, Insights and Forecast, 2020-2032
- 10.1. Market Analysis, Insights and Forecast - by Type
- 10.1.1. Butterfly Valve
- 10.1.2. Ball Valve
- 10.1.3. Globe Valve
- 10.1.4. Gate Valve
- 10.1.5. Plug Valve
- 10.1.6. Other Types
- 10.2. Market Analysis, Insights and Forecast - by Product
- 10.2.1. Quarter-turn Valve
- 10.2.2. Multi-turn Valve
- 10.2.3. Other Products (Control Valves)
- 10.3. Market Analysis, Insights and Forecast - by Application
- 10.3.1. Power
- 10.3.2. Water an
- 10.3.2.1. Metal, Mineral, and Mining
- 10.3.2.2. Other Applications
- 10.3.3. By Chemicals
- 10.3.4. Oil and Gas
- 10.3.4.1. Upstream
- 10.3.4.2. Mid-stream
- 10.3.4.3. Downstream
- 10.3.5. Food Processing
- 10.3.6. Pulp and Paper
- 10.4. Market Analysis, Insights and Forecast - by Geography
- 10.4.1. China
- 10.4.2. India
- 10.4.3. Japan
- 10.4.4. South Korea
- 10.4.5. Malaysia
- 10.4.6. Thailand
- 10.4.7. Indonesia
- 10.4.8. Vietnam
- 10.4.9. Rest of Asia-Pacific
- 10.1. Market Analysis, Insights and Forecast - by Type
- 11. Malaysia APAC Industrial Valves Industry Analysis, Insights and Forecast, 2020-2032
- 11.1. Market Analysis, Insights and Forecast - by Type
- 11.1.1. Butterfly Valve
- 11.1.2. Ball Valve
- 11.1.3. Globe Valve
- 11.1.4. Gate Valve
- 11.1.5. Plug Valve
- 11.1.6. Other Types
- 11.2. Market Analysis, Insights and Forecast - by Product
- 11.2.1. Quarter-turn Valve
- 11.2.2. Multi-turn Valve
- 11.2.3. Other Products (Control Valves)
- 11.3. Market Analysis, Insights and Forecast - by Application
- 11.3.1. Power
- 11.3.2. Water an
- 11.3.2.1. Metal, Mineral, and Mining
- 11.3.2.2. Other Applications
- 11.3.3. By Chemicals
- 11.3.4. Oil and Gas
- 11.3.4.1. Upstream
- 11.3.4.2. Mid-stream
- 11.3.4.3. Downstream
- 11.3.5. Food Processing
- 11.3.6. Pulp and Paper
- 11.4. Market Analysis, Insights and Forecast - by Geography
- 11.4.1. China
- 11.4.2. India
- 11.4.3. Japan
- 11.4.4. South Korea
- 11.4.5. Malaysia
- 11.4.6. Thailand
- 11.4.7. Indonesia
- 11.4.8. Vietnam
- 11.4.9. Rest of Asia-Pacific
- 11.1. Market Analysis, Insights and Forecast - by Type
- 12. Thailand APAC Industrial Valves Industry Analysis, Insights and Forecast, 2020-2032
- 12.1. Market Analysis, Insights and Forecast - by Type
- 12.1.1. Butterfly Valve
- 12.1.2. Ball Valve
- 12.1.3. Globe Valve
- 12.1.4. Gate Valve
- 12.1.5. Plug Valve
- 12.1.6. Other Types
- 12.2. Market Analysis, Insights and Forecast - by Product
- 12.2.1. Quarter-turn Valve
- 12.2.2. Multi-turn Valve
- 12.2.3. Other Products (Control Valves)
- 12.3. Market Analysis, Insights and Forecast - by Application
- 12.3.1. Power
- 12.3.2. Water an
- 12.3.2.1. Metal, Mineral, and Mining
- 12.3.2.2. Other Applications
- 12.3.3. By Chemicals
- 12.3.4. Oil and Gas
- 12.3.4.1. Upstream
- 12.3.4.2. Mid-stream
- 12.3.4.3. Downstream
- 12.3.5. Food Processing
- 12.3.6. Pulp and Paper
- 12.4. Market Analysis, Insights and Forecast - by Geography
- 12.4.1. China
- 12.4.2. India
- 12.4.3. Japan
- 12.4.4. South Korea
- 12.4.5. Malaysia
- 12.4.6. Thailand
- 12.4.7. Indonesia
- 12.4.8. Vietnam
- 12.4.9. Rest of Asia-Pacific
- 12.1. Market Analysis, Insights and Forecast - by Type
- 13. Indonesia APAC Industrial Valves Industry Analysis, Insights and Forecast, 2020-2032
- 13.1. Market Analysis, Insights and Forecast - by Type
- 13.1.1. Butterfly Valve
- 13.1.2. Ball Valve
- 13.1.3. Globe Valve
- 13.1.4. Gate Valve
- 13.1.5. Plug Valve
- 13.1.6. Other Types
- 13.2. Market Analysis, Insights and Forecast - by Product
- 13.2.1. Quarter-turn Valve
- 13.2.2. Multi-turn Valve
- 13.2.3. Other Products (Control Valves)
- 13.3. Market Analysis, Insights and Forecast - by Application
- 13.3.1. Power
- 13.3.2. Water an
- 13.3.2.1. Metal, Mineral, and Mining
- 13.3.2.2. Other Applications
- 13.3.3. By Chemicals
- 13.3.4. Oil and Gas
- 13.3.4.1. Upstream
- 13.3.4.2. Mid-stream
- 13.3.4.3. Downstream
- 13.3.5. Food Processing
- 13.3.6. Pulp and Paper
- 13.4. Market Analysis, Insights and Forecast - by Geography
- 13.4.1. China
- 13.4.2. India
- 13.4.3. Japan
- 13.4.4. South Korea
- 13.4.5. Malaysia
- 13.4.6. Thailand
- 13.4.7. Indonesia
- 13.4.8. Vietnam
- 13.4.9. Rest of Asia-Pacific
- 13.1. Market Analysis, Insights and Forecast - by Type
- 14. Vietnam APAC Industrial Valves Industry Analysis, Insights and Forecast, 2020-2032
- 14.1. Market Analysis, Insights and Forecast - by Type
- 14.1.1. Butterfly Valve
- 14.1.2. Ball Valve
- 14.1.3. Globe Valve
- 14.1.4. Gate Valve
- 14.1.5. Plug Valve
- 14.1.6. Other Types
- 14.2. Market Analysis, Insights and Forecast - by Product
- 14.2.1. Quarter-turn Valve
- 14.2.2. Multi-turn Valve
- 14.2.3. Other Products (Control Valves)
- 14.3. Market Analysis, Insights and Forecast - by Application
- 14.3.1. Power
- 14.3.2. Water an
- 14.3.2.1. Metal, Mineral, and Mining
- 14.3.2.2. Other Applications
- 14.3.3. By Chemicals
- 14.3.4. Oil and Gas
- 14.3.4.1. Upstream
- 14.3.4.2. Mid-stream
- 14.3.4.3. Downstream
- 14.3.5. Food Processing
- 14.3.6. Pulp and Paper
- 14.4. Market Analysis, Insights and Forecast - by Geography
- 14.4.1. China
- 14.4.2. India
- 14.4.3. Japan
- 14.4.4. South Korea
- 14.4.5. Malaysia
- 14.4.6. Thailand
- 14.4.7. Indonesia
- 14.4.8. Vietnam
- 14.4.9. Rest of Asia-Pacific
- 14.1. Market Analysis, Insights and Forecast - by Type
- 15. Rest of Asia Pacific APAC Industrial Valves Industry Analysis, Insights and Forecast, 2020-2032
- 15.1. Market Analysis, Insights and Forecast - by Type
- 15.1.1. Butterfly Valve
- 15.1.2. Ball Valve
- 15.1.3. Globe Valve
- 15.1.4. Gate Valve
- 15.1.5. Plug Valve
- 15.1.6. Other Types
- 15.2. Market Analysis, Insights and Forecast - by Product
- 15.2.1. Quarter-turn Valve
- 15.2.2. Multi-turn Valve
- 15.2.3. Other Products (Control Valves)
- 15.3. Market Analysis, Insights and Forecast - by Application
- 15.3.1. Power
- 15.3.2. Water an
- 15.3.2.1. Metal, Mineral, and Mining
- 15.3.2.2. Other Applications
- 15.3.3. By Chemicals
- 15.3.4. Oil and Gas
- 15.3.4.1. Upstream
- 15.3.4.2. Mid-stream
- 15.3.4.3. Downstream
- 15.3.5. Food Processing
- 15.3.6. Pulp and Paper
- 15.4. Market Analysis, Insights and Forecast - by Geography
- 15.4.1. China
- 15.4.2. India
- 15.4.3. Japan
- 15.4.4. South Korea
- 15.4.5. Malaysia
- 15.4.6. Thailand
- 15.4.7. Indonesia
- 15.4.8. Vietnam
- 15.4.9. Rest of Asia-Pacific
- 15.1. Market Analysis, Insights and Forecast - by Type
- 16. Competitive Analysis
- 16.1. Company Profiles
- 16.1.1 Alfa Laval
- 16.1.1.1. Company Overview
- 16.1.1.2. Products
- 16.1.1.3. Company Financials
- 16.1.1.4. SWOT Analysis
- 16.1.2 Honeywell International Inc
- 16.1.2.1. Company Overview
- 16.1.2.2. Products
- 16.1.2.3. Company Financials
- 16.1.2.4. SWOT Analysis
- 16.1.3 Danfoss AS
- 16.1.3.1. Company Overview
- 16.1.3.2. Products
- 16.1.3.3. Company Financials
- 16.1.3.4. SWOT Analysis
- 16.1.4 Velan Inc
- 16.1.4.1. Company Overview
- 16.1.4.2. Products
- 16.1.4.3. Company Financials
- 16.1.4.4. SWOT Analysis
- 16.1.5 Okano Valve Mfg Co Ltd
- 16.1.5.1. Company Overview
- 16.1.5.2. Products
- 16.1.5.3. Company Financials
- 16.1.5.4. SWOT Analysis
- 16.1.6 SAMSON AKTIENGESELLSCHAFT
- 16.1.6.1. Company Overview
- 16.1.6.2. Products
- 16.1.6.3. Company Financials
- 16.1.6.4. SWOT Analysis
- 16.1.7 Flowserve Corporation
- 16.1.7.1. Company Overview
- 16.1.7.2. Products
- 16.1.7.3. Company Financials
- 16.1.7.4. SWOT Analysis
- 16.1.8 The Weir Group PLC
- 16.1.8.1. Company Overview
- 16.1.8.2. Products
- 16.1.8.3. Company Financials
- 16.1.8.4. SWOT Analysis
- 16.1.9 Georg Fischer Ltd
- 16.1.9.1. Company Overview
- 16.1.9.2. Products
- 16.1.9.3. Company Financials
- 16.1.9.4. SWOT Analysis
- 16.1.10 Baker Hughes
- 16.1.10.1. Company Overview
- 16.1.10.2. Products
- 16.1.10.3. Company Financials
- 16.1.10.4. SWOT Analysis
- 16.1.11 Emerson Electric Co
- 16.1.11.1. Company Overview
- 16.1.11.2. Products
- 16.1.11.3. Company Financials
- 16.1.11.4. SWOT Analysis
- 16.1.12 CIRCOR International Inc
- 16.1.12.1. Company Overview
- 16.1.12.2. Products
- 16.1.12.3. Company Financials
- 16.1.12.4. SWOT Analysis
- 16.1.13 AVK Holding AS
- 16.1.13.1. Company Overview
- 16.1.13.2. Products
- 16.1.13.3. Company Financials
- 16.1.13.4. SWOT Analysis
- 16.1.14 PARKER HANNIFIN CORP
- 16.1.14.1. Company Overview
- 16.1.14.2. Products
- 16.1.14.3. Company Financials
- 16.1.14.4. SWOT Analysis
- 16.1.15 EBRO ARMATUREN Gebr Brer GmbH
- 16.1.15.1. Company Overview
- 16.1.15.2. Products
- 16.1.15.3. Company Financials
- 16.1.15.4. SWOT Analysis
- 16.1.16 Hitachi Metals Ltd
- 16.1.16.1. Company Overview
- 16.1.16.2. Products
- 16.1.16.3. Company Financials
- 16.1.16.4. SWOT Analysis
- 16.1.17 ITT Inc
- 16.1.17.1. Company Overview
- 16.1.17.2. Products
- 16.1.17.3. Company Financials
- 16.1.17.4. SWOT Analysis
- 16.1.18 NIBCO
- 16.1.18.1. Company Overview
- 16.1.18.2. Products
- 16.1.18.3. Company Financials
- 16.1.18.4. SWOT Analysis
- 16.1.19 IMI Critical Engineering
- 16.1.19.1. Company Overview
- 16.1.19.2. Products
- 16.1.19.3. Company Financials
- 16.1.19.4. SWOT Analysis
- 16.1.20 Crane Co
- 16.1.20.1. Company Overview
- 16.1.20.2. Products
- 16.1.20.3. Company Financials
- 16.1.20.4. SWOT Analysis
- 16.1.21 Valvitalia SpA
- 16.1.21.1. Company Overview
- 16.1.21.2. Products
- 16.1.21.3. Company Financials
- 16.1.21.4. SWOT Analysis
- 16.1.22 Curtiss-Wright Corporation
- 16.1.22.1. Company Overview
- 16.1.22.2. Products
- 16.1.22.3. Company Financials
- 16.1.22.4. SWOT Analysis
- 16.1.23 Schlumberger Limited
- 16.1.23.1. Company Overview
- 16.1.23.2. Products
- 16.1.23.3. Company Financials
- 16.1.23.4. SWOT Analysis
- 16.1.24 KITZ Corporation
- 16.1.24.1. Company Overview
- 16.1.24.2. Products
- 16.1.24.3. Company Financials
- 16.1.24.4. SWOT Analysis
- 16.1.1 Alfa Laval
- 16.2. Market Entropy
- 16.2.1 Company's Key Areas Served
- 16.2.2 Recent Developments
- 16.3. Company Market Share Analysis 2025
- 16.3.1 Top 5 Companies Market Share Analysis
- 16.3.2 Top 3 Companies Market Share Analysis
- 16.4. List of Potential Customers
- 17. Research Methodology
List of Figures
- Figure 1: Global APAC Industrial Valves Industry Revenue Breakdown (Million, %) by Region 2025 & 2033
- Figure 2: Global APAC Industrial Valves Industry Volume Breakdown (K Units, %) by Region 2025 & 2033
- Figure 3: China APAC Industrial Valves Industry Revenue (Million), by Type 2025 & 2033
- Figure 4: China APAC Industrial Valves Industry Volume (K Units), by Type 2025 & 2033
- Figure 5: China APAC Industrial Valves Industry Revenue Share (%), by Type 2025 & 2033
- Figure 6: China APAC Industrial Valves Industry Volume Share (%), by Type 2025 & 2033
- Figure 7: China APAC Industrial Valves Industry Revenue (Million), by Product 2025 & 2033
- Figure 8: China APAC Industrial Valves Industry Volume (K Units), by Product 2025 & 2033
- Figure 9: China APAC Industrial Valves Industry Revenue Share (%), by Product 2025 & 2033
- Figure 10: China APAC Industrial Valves Industry Volume Share (%), by Product 2025 & 2033
- Figure 11: China APAC Industrial Valves Industry Revenue (Million), by Application 2025 & 2033
- Figure 12: China APAC Industrial Valves Industry Volume (K Units), by Application 2025 & 2033
- Figure 13: China APAC Industrial Valves Industry Revenue Share (%), by Application 2025 & 2033
- Figure 14: China APAC Industrial Valves Industry Volume Share (%), by Application 2025 & 2033
- Figure 15: China APAC Industrial Valves Industry Revenue (Million), by Geography 2025 & 2033
- Figure 16: China APAC Industrial Valves Industry Volume (K Units), by Geography 2025 & 2033
- Figure 17: China APAC Industrial Valves Industry Revenue Share (%), by Geography 2025 & 2033
- Figure 18: China APAC Industrial Valves Industry Volume Share (%), by Geography 2025 & 2033
- Figure 19: China APAC Industrial Valves Industry Revenue (Million), by Country 2025 & 2033
- Figure 20: China APAC Industrial Valves Industry Volume (K Units), by Country 2025 & 2033
- Figure 21: China APAC Industrial Valves Industry Revenue Share (%), by Country 2025 & 2033
- Figure 22: China APAC Industrial Valves Industry Volume Share (%), by Country 2025 & 2033
- Figure 23: India APAC Industrial Valves Industry Revenue (Million), by Type 2025 & 2033
- Figure 24: India APAC Industrial Valves Industry Volume (K Units), by Type 2025 & 2033
- Figure 25: India APAC Industrial Valves Industry Revenue Share (%), by Type 2025 & 2033
- Figure 26: India APAC Industrial Valves Industry Volume Share (%), by Type 2025 & 2033
- Figure 27: India APAC Industrial Valves Industry Revenue (Million), by Product 2025 & 2033
- Figure 28: India APAC Industrial Valves Industry Volume (K Units), by Product 2025 & 2033
- Figure 29: India APAC Industrial Valves Industry Revenue Share (%), by Product 2025 & 2033
- Figure 30: India APAC Industrial Valves Industry Volume Share (%), by Product 2025 & 2033
- Figure 31: India APAC Industrial Valves Industry Revenue (Million), by Application 2025 & 2033
- Figure 32: India APAC Industrial Valves Industry Volume (K Units), by Application 2025 & 2033
- Figure 33: India APAC Industrial Valves Industry Revenue Share (%), by Application 2025 & 2033
- Figure 34: India APAC Industrial Valves Industry Volume Share (%), by Application 2025 & 2033
- Figure 35: India APAC Industrial Valves Industry Revenue (Million), by Geography 2025 & 2033
- Figure 36: India APAC Industrial Valves Industry Volume (K Units), by Geography 2025 & 2033
- Figure 37: India APAC Industrial Valves Industry Revenue Share (%), by Geography 2025 & 2033
- Figure 38: India APAC Industrial Valves Industry Volume Share (%), by Geography 2025 & 2033
- Figure 39: India APAC Industrial Valves Industry Revenue (Million), by Country 2025 & 2033
- Figure 40: India APAC Industrial Valves Industry Volume (K Units), by Country 2025 & 2033
- Figure 41: India APAC Industrial Valves Industry Revenue Share (%), by Country 2025 & 2033
- Figure 42: India APAC Industrial Valves Industry Volume Share (%), by Country 2025 & 2033
- Figure 43: Japan APAC Industrial Valves Industry Revenue (Million), by Type 2025 & 2033
- Figure 44: Japan APAC Industrial Valves Industry Volume (K Units), by Type 2025 & 2033
- Figure 45: Japan APAC Industrial Valves Industry Revenue Share (%), by Type 2025 & 2033
- Figure 46: Japan APAC Industrial Valves Industry Volume Share (%), by Type 2025 & 2033
- Figure 47: Japan APAC Industrial Valves Industry Revenue (Million), by Product 2025 & 2033
- Figure 48: Japan APAC Industrial Valves Industry Volume (K Units), by Product 2025 & 2033
- Figure 49: Japan APAC Industrial Valves Industry Revenue Share (%), by Product 2025 & 2033
- Figure 50: Japan APAC Industrial Valves Industry Volume Share (%), by Product 2025 & 2033
- Figure 51: Japan APAC Industrial Valves Industry Revenue (Million), by Application 2025 & 2033
- Figure 52: Japan APAC Industrial Valves Industry Volume (K Units), by Application 2025 & 2033
- Figure 53: Japan APAC Industrial Valves Industry Revenue Share (%), by Application 2025 & 2033
- Figure 54: Japan APAC Industrial Valves Industry Volume Share (%), by Application 2025 & 2033
- Figure 55: Japan APAC Industrial Valves Industry Revenue (Million), by Geography 2025 & 2033
- Figure 56: Japan APAC Industrial Valves Industry Volume (K Units), by Geography 2025 & 2033
- Figure 57: Japan APAC Industrial Valves Industry Revenue Share (%), by Geography 2025 & 2033
- Figure 58: Japan APAC Industrial Valves Industry Volume Share (%), by Geography 2025 & 2033
- Figure 59: Japan APAC Industrial Valves Industry Revenue (Million), by Country 2025 & 2033
- Figure 60: Japan APAC Industrial Valves Industry Volume (K Units), by Country 2025 & 2033
- Figure 61: Japan APAC Industrial Valves Industry Revenue Share (%), by Country 2025 & 2033
- Figure 62: Japan APAC Industrial Valves Industry Volume Share (%), by Country 2025 & 2033
- Figure 63: South Korea APAC Industrial Valves Industry Revenue (Million), by Type 2025 & 2033
- Figure 64: South Korea APAC Industrial Valves Industry Volume (K Units), by Type 2025 & 2033
- Figure 65: South Korea APAC Industrial Valves Industry Revenue Share (%), by Type 2025 & 2033
- Figure 66: South Korea APAC Industrial Valves Industry Volume Share (%), by Type 2025 & 2033
- Figure 67: South Korea APAC Industrial Valves Industry Revenue (Million), by Product 2025 & 2033
- Figure 68: South Korea APAC Industrial Valves Industry Volume (K Units), by Product 2025 & 2033
- Figure 69: South Korea APAC Industrial Valves Industry Revenue Share (%), by Product 2025 & 2033
- Figure 70: South Korea APAC Industrial Valves Industry Volume Share (%), by Product 2025 & 2033
- Figure 71: South Korea APAC Industrial Valves Industry Revenue (Million), by Application 2025 & 2033
- Figure 72: South Korea APAC Industrial Valves Industry Volume (K Units), by Application 2025 & 2033
- Figure 73: South Korea APAC Industrial Valves Industry Revenue Share (%), by Application 2025 & 2033
- Figure 74: South Korea APAC Industrial Valves Industry Volume Share (%), by Application 2025 & 2033
- Figure 75: South Korea APAC Industrial Valves Industry Revenue (Million), by Geography 2025 & 2033
- Figure 76: South Korea APAC Industrial Valves Industry Volume (K Units), by Geography 2025 & 2033
- Figure 77: South Korea APAC Industrial Valves Industry Revenue Share (%), by Geography 2025 & 2033
- Figure 78: South Korea APAC Industrial Valves Industry Volume Share (%), by Geography 2025 & 2033
- Figure 79: South Korea APAC Industrial Valves Industry Revenue (Million), by Country 2025 & 2033
- Figure 80: South Korea APAC Industrial Valves Industry Volume (K Units), by Country 2025 & 2033
- Figure 81: South Korea APAC Industrial Valves Industry Revenue Share (%), by Country 2025 & 2033
- Figure 82: South Korea APAC Industrial Valves Industry Volume Share (%), by Country 2025 & 2033
- Figure 83: Malaysia APAC Industrial Valves Industry Revenue (Million), by Type 2025 & 2033
- Figure 84: Malaysia APAC Industrial Valves Industry Volume (K Units), by Type 2025 & 2033
- Figure 85: Malaysia APAC Industrial Valves Industry Revenue Share (%), by Type 2025 & 2033
- Figure 86: Malaysia APAC Industrial Valves Industry Volume Share (%), by Type 2025 & 2033
- Figure 87: Malaysia APAC Industrial Valves Industry Revenue (Million), by Product 2025 & 2033
- Figure 88: Malaysia APAC Industrial Valves Industry Volume (K Units), by Product 2025 & 2033
- Figure 89: Malaysia APAC Industrial Valves Industry Revenue Share (%), by Product 2025 & 2033
- Figure 90: Malaysia APAC Industrial Valves Industry Volume Share (%), by Product 2025 & 2033
- Figure 91: Malaysia APAC Industrial Valves Industry Revenue (Million), by Application 2025 & 2033
- Figure 92: Malaysia APAC Industrial Valves Industry Volume (K Units), by Application 2025 & 2033
- Figure 93: Malaysia APAC Industrial Valves Industry Revenue Share (%), by Application 2025 & 2033
- Figure 94: Malaysia APAC Industrial Valves Industry Volume Share (%), by Application 2025 & 2033
- Figure 95: Malaysia APAC Industrial Valves Industry Revenue (Million), by Geography 2025 & 2033
- Figure 96: Malaysia APAC Industrial Valves Industry Volume (K Units), by Geography 2025 & 2033
- Figure 97: Malaysia APAC Industrial Valves Industry Revenue Share (%), by Geography 2025 & 2033
- Figure 98: Malaysia APAC Industrial Valves Industry Volume Share (%), by Geography 2025 & 2033
- Figure 99: Malaysia APAC Industrial Valves Industry Revenue (Million), by Country 2025 & 2033
- Figure 100: Malaysia APAC Industrial Valves Industry Volume (K Units), by Country 2025 & 2033
- Figure 101: Malaysia APAC Industrial Valves Industry Revenue Share (%), by Country 2025 & 2033
- Figure 102: Malaysia APAC Industrial Valves Industry Volume Share (%), by Country 2025 & 2033
- Figure 103: Thailand APAC Industrial Valves Industry Revenue (Million), by Type 2025 & 2033
- Figure 104: Thailand APAC Industrial Valves Industry Volume (K Units), by Type 2025 & 2033
- Figure 105: Thailand APAC Industrial Valves Industry Revenue Share (%), by Type 2025 & 2033
- Figure 106: Thailand APAC Industrial Valves Industry Volume Share (%), by Type 2025 & 2033
- Figure 107: Thailand APAC Industrial Valves Industry Revenue (Million), by Product 2025 & 2033
- Figure 108: Thailand APAC Industrial Valves Industry Volume (K Units), by Product 2025 & 2033
- Figure 109: Thailand APAC Industrial Valves Industry Revenue Share (%), by Product 2025 & 2033
- Figure 110: Thailand APAC Industrial Valves Industry Volume Share (%), by Product 2025 & 2033
- Figure 111: Thailand APAC Industrial Valves Industry Revenue (Million), by Application 2025 & 2033
- Figure 112: Thailand APAC Industrial Valves Industry Volume (K Units), by Application 2025 & 2033
- Figure 113: Thailand APAC Industrial Valves Industry Revenue Share (%), by Application 2025 & 2033
- Figure 114: Thailand APAC Industrial Valves Industry Volume Share (%), by Application 2025 & 2033
- Figure 115: Thailand APAC Industrial Valves Industry Revenue (Million), by Geography 2025 & 2033
- Figure 116: Thailand APAC Industrial Valves Industry Volume (K Units), by Geography 2025 & 2033
- Figure 117: Thailand APAC Industrial Valves Industry Revenue Share (%), by Geography 2025 & 2033
- Figure 118: Thailand APAC Industrial Valves Industry Volume Share (%), by Geography 2025 & 2033
- Figure 119: Thailand APAC Industrial Valves Industry Revenue (Million), by Country 2025 & 2033
- Figure 120: Thailand APAC Industrial Valves Industry Volume (K Units), by Country 2025 & 2033
- Figure 121: Thailand APAC Industrial Valves Industry Revenue Share (%), by Country 2025 & 2033
- Figure 122: Thailand APAC Industrial Valves Industry Volume Share (%), by Country 2025 & 2033
- Figure 123: Indonesia APAC Industrial Valves Industry Revenue (Million), by Type 2025 & 2033
- Figure 124: Indonesia APAC Industrial Valves Industry Volume (K Units), by Type 2025 & 2033
- Figure 125: Indonesia APAC Industrial Valves Industry Revenue Share (%), by Type 2025 & 2033
- Figure 126: Indonesia APAC Industrial Valves Industry Volume Share (%), by Type 2025 & 2033
- Figure 127: Indonesia APAC Industrial Valves Industry Revenue (Million), by Product 2025 & 2033
- Figure 128: Indonesia APAC Industrial Valves Industry Volume (K Units), by Product 2025 & 2033
- Figure 129: Indonesia APAC Industrial Valves Industry Revenue Share (%), by Product 2025 & 2033
- Figure 130: Indonesia APAC Industrial Valves Industry Volume Share (%), by Product 2025 & 2033
- Figure 131: Indonesia APAC Industrial Valves Industry Revenue (Million), by Application 2025 & 2033
- Figure 132: Indonesia APAC Industrial Valves Industry Volume (K Units), by Application 2025 & 2033
- Figure 133: Indonesia APAC Industrial Valves Industry Revenue Share (%), by Application 2025 & 2033
- Figure 134: Indonesia APAC Industrial Valves Industry Volume Share (%), by Application 2025 & 2033
- Figure 135: Indonesia APAC Industrial Valves Industry Revenue (Million), by Geography 2025 & 2033
- Figure 136: Indonesia APAC Industrial Valves Industry Volume (K Units), by Geography 2025 & 2033
- Figure 137: Indonesia APAC Industrial Valves Industry Revenue Share (%), by Geography 2025 & 2033
- Figure 138: Indonesia APAC Industrial Valves Industry Volume Share (%), by Geography 2025 & 2033
- Figure 139: Indonesia APAC Industrial Valves Industry Revenue (Million), by Country 2025 & 2033
- Figure 140: Indonesia APAC Industrial Valves Industry Volume (K Units), by Country 2025 & 2033
- Figure 141: Indonesia APAC Industrial Valves Industry Revenue Share (%), by Country 2025 & 2033
- Figure 142: Indonesia APAC Industrial Valves Industry Volume Share (%), by Country 2025 & 2033
- Figure 143: Vietnam APAC Industrial Valves Industry Revenue (Million), by Type 2025 & 2033
- Figure 144: Vietnam APAC Industrial Valves Industry Volume (K Units), by Type 2025 & 2033
- Figure 145: Vietnam APAC Industrial Valves Industry Revenue Share (%), by Type 2025 & 2033
- Figure 146: Vietnam APAC Industrial Valves Industry Volume Share (%), by Type 2025 & 2033
- Figure 147: Vietnam APAC Industrial Valves Industry Revenue (Million), by Product 2025 & 2033
- Figure 148: Vietnam APAC Industrial Valves Industry Volume (K Units), by Product 2025 & 2033
- Figure 149: Vietnam APAC Industrial Valves Industry Revenue Share (%), by Product 2025 & 2033
- Figure 150: Vietnam APAC Industrial Valves Industry Volume Share (%), by Product 2025 & 2033
- Figure 151: Vietnam APAC Industrial Valves Industry Revenue (Million), by Application 2025 & 2033
- Figure 152: Vietnam APAC Industrial Valves Industry Volume (K Units), by Application 2025 & 2033
- Figure 153: Vietnam APAC Industrial Valves Industry Revenue Share (%), by Application 2025 & 2033
- Figure 154: Vietnam APAC Industrial Valves Industry Volume Share (%), by Application 2025 & 2033
- Figure 155: Vietnam APAC Industrial Valves Industry Revenue (Million), by Geography 2025 & 2033
- Figure 156: Vietnam APAC Industrial Valves Industry Volume (K Units), by Geography 2025 & 2033
- Figure 157: Vietnam APAC Industrial Valves Industry Revenue Share (%), by Geography 2025 & 2033
- Figure 158: Vietnam APAC Industrial Valves Industry Volume Share (%), by Geography 2025 & 2033
- Figure 159: Vietnam APAC Industrial Valves Industry Revenue (Million), by Country 2025 & 2033
- Figure 160: Vietnam APAC Industrial Valves Industry Volume (K Units), by Country 2025 & 2033
- Figure 161: Vietnam APAC Industrial Valves Industry Revenue Share (%), by Country 2025 & 2033
- Figure 162: Vietnam APAC Industrial Valves Industry Volume Share (%), by Country 2025 & 2033
- Figure 163: Rest of Asia Pacific APAC Industrial Valves Industry Revenue (Million), by Type 2025 & 2033
- Figure 164: Rest of Asia Pacific APAC Industrial Valves Industry Volume (K Units), by Type 2025 & 2033
- Figure 165: Rest of Asia Pacific APAC Industrial Valves Industry Revenue Share (%), by Type 2025 & 2033
- Figure 166: Rest of Asia Pacific APAC Industrial Valves Industry Volume Share (%), by Type 2025 & 2033
- Figure 167: Rest of Asia Pacific APAC Industrial Valves Industry Revenue (Million), by Product 2025 & 2033
- Figure 168: Rest of Asia Pacific APAC Industrial Valves Industry Volume (K Units), by Product 2025 & 2033
- Figure 169: Rest of Asia Pacific APAC Industrial Valves Industry Revenue Share (%), by Product 2025 & 2033
- Figure 170: Rest of Asia Pacific APAC Industrial Valves Industry Volume Share (%), by Product 2025 & 2033
- Figure 171: Rest of Asia Pacific APAC Industrial Valves Industry Revenue (Million), by Application 2025 & 2033
- Figure 172: Rest of Asia Pacific APAC Industrial Valves Industry Volume (K Units), by Application 2025 & 2033
- Figure 173: Rest of Asia Pacific APAC Industrial Valves Industry Revenue Share (%), by Application 2025 & 2033
- Figure 174: Rest of Asia Pacific APAC Industrial Valves Industry Volume Share (%), by Application 2025 & 2033
- Figure 175: Rest of Asia Pacific APAC Industrial Valves Industry Revenue (Million), by Geography 2025 & 2033
- Figure 176: Rest of Asia Pacific APAC Industrial Valves Industry Volume (K Units), by Geography 2025 & 2033
- Figure 177: Rest of Asia Pacific APAC Industrial Valves Industry Revenue Share (%), by Geography 2025 & 2033
- Figure 178: Rest of Asia Pacific APAC Industrial Valves Industry Volume Share (%), by Geography 2025 & 2033
- Figure 179: Rest of Asia Pacific APAC Industrial Valves Industry Revenue (Million), by Country 2025 & 2033
- Figure 180: Rest of Asia Pacific APAC Industrial Valves Industry Volume (K Units), by Country 2025 & 2033
- Figure 181: Rest of Asia Pacific APAC Industrial Valves Industry Revenue Share (%), by Country 2025 & 2033
- Figure 182: Rest of Asia Pacific APAC Industrial Valves Industry Volume Share (%), by Country 2025 & 2033
List of Tables
- Table 1: Global APAC Industrial Valves Industry Revenue Million Forecast, by Type 2020 & 2033
- Table 2: Global APAC Industrial Valves Industry Volume K Units Forecast, by Type 2020 & 2033
- Table 3: Global APAC Industrial Valves Industry Revenue Million Forecast, by Product 2020 & 2033
- Table 4: Global APAC Industrial Valves Industry Volume K Units Forecast, by Product 2020 & 2033
- Table 5: Global APAC Industrial Valves Industry Revenue Million Forecast, by Application 2020 & 2033
- Table 6: Global APAC Industrial Valves Industry Volume K Units Forecast, by Application 2020 & 2033
- Table 7: Global APAC Industrial Valves Industry Revenue Million Forecast, by Geography 2020 & 2033
- Table 8: Global APAC Industrial Valves Industry Volume K Units Forecast, by Geography 2020 & 2033
- Table 9: Global APAC Industrial Valves Industry Revenue Million Forecast, by Region 2020 & 2033
- Table 10: Global APAC Industrial Valves Industry Volume K Units Forecast, by Region 2020 & 2033
- Table 11: Global APAC Industrial Valves Industry Revenue Million Forecast, by Type 2020 & 2033
- Table 12: Global APAC Industrial Valves Industry Volume K Units Forecast, by Type 2020 & 2033
- Table 13: Global APAC Industrial Valves Industry Revenue Million Forecast, by Product 2020 & 2033
- Table 14: Global APAC Industrial Valves Industry Volume K Units Forecast, by Product 2020 & 2033
- Table 15: Global APAC Industrial Valves Industry Revenue Million Forecast, by Application 2020 & 2033
- Table 16: Global APAC Industrial Valves Industry Volume K Units Forecast, by Application 2020 & 2033
- Table 17: Global APAC Industrial Valves Industry Revenue Million Forecast, by Geography 2020 & 2033
- Table 18: Global APAC Industrial Valves Industry Volume K Units Forecast, by Geography 2020 & 2033
- Table 19: Global APAC Industrial Valves Industry Revenue Million Forecast, by Country 2020 & 2033
- Table 20: Global APAC Industrial Valves Industry Volume K Units Forecast, by Country 2020 & 2033
- Table 21: Global APAC Industrial Valves Industry Revenue Million Forecast, by Type 2020 & 2033
- Table 22: Global APAC Industrial Valves Industry Volume K Units Forecast, by Type 2020 & 2033
- Table 23: Global APAC Industrial Valves Industry Revenue Million Forecast, by Product 2020 & 2033
- Table 24: Global APAC Industrial Valves Industry Volume K Units Forecast, by Product 2020 & 2033
- Table 25: Global APAC Industrial Valves Industry Revenue Million Forecast, by Application 2020 & 2033
- Table 26: Global APAC Industrial Valves Industry Volume K Units Forecast, by Application 2020 & 2033
- Table 27: Global APAC Industrial Valves Industry Revenue Million Forecast, by Geography 2020 & 2033
- Table 28: Global APAC Industrial Valves Industry Volume K Units Forecast, by Geography 2020 & 2033
- Table 29: Global APAC Industrial Valves Industry Revenue Million Forecast, by Country 2020 & 2033
- Table 30: Global APAC Industrial Valves Industry Volume K Units Forecast, by Country 2020 & 2033
- Table 31: Global APAC Industrial Valves Industry Revenue Million Forecast, by Type 2020 & 2033
- Table 32: Global APAC Industrial Valves Industry Volume K Units Forecast, by Type 2020 & 2033
- Table 33: Global APAC Industrial Valves Industry Revenue Million Forecast, by Product 2020 & 2033
- Table 34: Global APAC Industrial Valves Industry Volume K Units Forecast, by Product 2020 & 2033
- Table 35: Global APAC Industrial Valves Industry Revenue Million Forecast, by Application 2020 & 2033
- Table 36: Global APAC Industrial Valves Industry Volume K Units Forecast, by Application 2020 & 2033
- Table 37: Global APAC Industrial Valves Industry Revenue Million Forecast, by Geography 2020 & 2033
- Table 38: Global APAC Industrial Valves Industry Volume K Units Forecast, by Geography 2020 & 2033
- Table 39: Global APAC Industrial Valves Industry Revenue Million Forecast, by Country 2020 & 2033
- Table 40: Global APAC Industrial Valves Industry Volume K Units Forecast, by Country 2020 & 2033
- Table 41: Global APAC Industrial Valves Industry Revenue Million Forecast, by Type 2020 & 2033
- Table 42: Global APAC Industrial Valves Industry Volume K Units Forecast, by Type 2020 & 2033
- Table 43: Global APAC Industrial Valves Industry Revenue Million Forecast, by Product 2020 & 2033
- Table 44: Global APAC Industrial Valves Industry Volume K Units Forecast, by Product 2020 & 2033
- Table 45: Global APAC Industrial Valves Industry Revenue Million Forecast, by Application 2020 & 2033
- Table 46: Global APAC Industrial Valves Industry Volume K Units Forecast, by Application 2020 & 2033
- Table 47: Global APAC Industrial Valves Industry Revenue Million Forecast, by Geography 2020 & 2033
- Table 48: Global APAC Industrial Valves Industry Volume K Units Forecast, by Geography 2020 & 2033
- Table 49: Global APAC Industrial Valves Industry Revenue Million Forecast, by Country 2020 & 2033
- Table 50: Global APAC Industrial Valves Industry Volume K Units Forecast, by Country 2020 & 2033
- Table 51: Global APAC Industrial Valves Industry Revenue Million Forecast, by Type 2020 & 2033
- Table 52: Global APAC Industrial Valves Industry Volume K Units Forecast, by Type 2020 & 2033
- Table 53: Global APAC Industrial Valves Industry Revenue Million Forecast, by Product 2020 & 2033
- Table 54: Global APAC Industrial Valves Industry Volume K Units Forecast, by Product 2020 & 2033
- Table 55: Global APAC Industrial Valves Industry Revenue Million Forecast, by Application 2020 & 2033
- Table 56: Global APAC Industrial Valves Industry Volume K Units Forecast, by Application 2020 & 2033
- Table 57: Global APAC Industrial Valves Industry Revenue Million Forecast, by Geography 2020 & 2033
- Table 58: Global APAC Industrial Valves Industry Volume K Units Forecast, by Geography 2020 & 2033
- Table 59: Global APAC Industrial Valves Industry Revenue Million Forecast, by Country 2020 & 2033
- Table 60: Global APAC Industrial Valves Industry Volume K Units Forecast, by Country 2020 & 2033
- Table 61: Global APAC Industrial Valves Industry Revenue Million Forecast, by Type 2020 & 2033
- Table 62: Global APAC Industrial Valves Industry Volume K Units Forecast, by Type 2020 & 2033
- Table 63: Global APAC Industrial Valves Industry Revenue Million Forecast, by Product 2020 & 2033
- Table 64: Global APAC Industrial Valves Industry Volume K Units Forecast, by Product 2020 & 2033
- Table 65: Global APAC Industrial Valves Industry Revenue Million Forecast, by Application 2020 & 2033
- Table 66: Global APAC Industrial Valves Industry Volume K Units Forecast, by Application 2020 & 2033
- Table 67: Global APAC Industrial Valves Industry Revenue Million Forecast, by Geography 2020 & 2033
- Table 68: Global APAC Industrial Valves Industry Volume K Units Forecast, by Geography 2020 & 2033
- Table 69: Global APAC Industrial Valves Industry Revenue Million Forecast, by Country 2020 & 2033
- Table 70: Global APAC Industrial Valves Industry Volume K Units Forecast, by Country 2020 & 2033
- Table 71: Global APAC Industrial Valves Industry Revenue Million Forecast, by Type 2020 & 2033
- Table 72: Global APAC Industrial Valves Industry Volume K Units Forecast, by Type 2020 & 2033
- Table 73: Global APAC Industrial Valves Industry Revenue Million Forecast, by Product 2020 & 2033
- Table 74: Global APAC Industrial Valves Industry Volume K Units Forecast, by Product 2020 & 2033
- Table 75: Global APAC Industrial Valves Industry Revenue Million Forecast, by Application 2020 & 2033
- Table 76: Global APAC Industrial Valves Industry Volume K Units Forecast, by Application 2020 & 2033
- Table 77: Global APAC Industrial Valves Industry Revenue Million Forecast, by Geography 2020 & 2033
- Table 78: Global APAC Industrial Valves Industry Volume K Units Forecast, by Geography 2020 & 2033
- Table 79: Global APAC Industrial Valves Industry Revenue Million Forecast, by Country 2020 & 2033
- Table 80: Global APAC Industrial Valves Industry Volume K Units Forecast, by Country 2020 & 2033
- Table 81: Global APAC Industrial Valves Industry Revenue Million Forecast, by Type 2020 & 2033
- Table 82: Global APAC Industrial Valves Industry Volume K Units Forecast, by Type 2020 & 2033
- Table 83: Global APAC Industrial Valves Industry Revenue Million Forecast, by Product 2020 & 2033
- Table 84: Global APAC Industrial Valves Industry Volume K Units Forecast, by Product 2020 & 2033
- Table 85: Global APAC Industrial Valves Industry Revenue Million Forecast, by Application 2020 & 2033
- Table 86: Global APAC Industrial Valves Industry Volume K Units Forecast, by Application 2020 & 2033
- Table 87: Global APAC Industrial Valves Industry Revenue Million Forecast, by Geography 2020 & 2033
- Table 88: Global APAC Industrial Valves Industry Volume K Units Forecast, by Geography 2020 & 2033
- Table 89: Global APAC Industrial Valves Industry Revenue Million Forecast, by Country 2020 & 2033
- Table 90: Global APAC Industrial Valves Industry Volume K Units Forecast, by Country 2020 & 2033
- Table 91: Global APAC Industrial Valves Industry Revenue Million Forecast, by Type 2020 & 2033
- Table 92: Global APAC Industrial Valves Industry Volume K Units Forecast, by Type 2020 & 2033
- Table 93: Global APAC Industrial Valves Industry Revenue Million Forecast, by Product 2020 & 2033
- Table 94: Global APAC Industrial Valves Industry Volume K Units Forecast, by Product 2020 & 2033
- Table 95: Global APAC Industrial Valves Industry Revenue Million Forecast, by Application 2020 & 2033
- Table 96: Global APAC Industrial Valves Industry Volume K Units Forecast, by Application 2020 & 2033
- Table 97: Global APAC Industrial Valves Industry Revenue Million Forecast, by Geography 2020 & 2033
- Table 98: Global APAC Industrial Valves Industry Volume K Units Forecast, by Geography 2020 & 2033
- Table 99: Global APAC Industrial Valves Industry Revenue Million Forecast, by Country 2020 & 2033
- Table 100: Global APAC Industrial Valves Industry Volume K Units Forecast, by Country 2020 & 2033
Frequently Asked Questions
1. What is the projected Compound Annual Growth Rate (CAGR) of the APAC Industrial Valves Industry?
The projected CAGR is approximately 5.67%.
2. Which companies are prominent players in the APAC Industrial Valves Industry?
Key companies in the market include Alfa Laval, Honeywell International Inc, Danfoss AS, Velan Inc , Okano Valve Mfg Co Ltd, SAMSON AKTIENGESELLSCHAFT, Flowserve Corporation, The Weir Group PLC, Georg Fischer Ltd, Baker Hughes, Emerson Electric Co, CIRCOR International Inc, AVK Holding AS, PARKER HANNIFIN CORP, EBRO ARMATUREN Gebr Brer GmbH, Hitachi Metals Ltd, ITT Inc, NIBCO, IMI Critical Engineering, Crane Co, Valvitalia SpA, Curtiss-Wright Corporation, Schlumberger Limited, KITZ Corporation.
3. What are the main segments of the APAC Industrial Valves Industry?
The market segments include Type, Product, Application, Geography.
4. Can you provide details about the market size?
The market size is estimated to be USD 21.98 Million as of 2022.
5. What are some drivers contributing to market growth?
Increasing Demand for Valves from Water Treatment Plants; Increasing Demand for Valves in the Oil and Gas Industry; Other Drivers.
6. What are the notable trends driving market growth?
Growing Demand in the Oil and Gas Industry.
7. Are there any restraints impacting market growth?
Impact of the COVID-19 Outbreak.
8. Can you provide examples of recent developments in the market?
March 2022: Flowserve announced a partnership with Gradiant to accelerate growth in the water technology market. Gradiant develops and delivers advanced water and wastewater treatment facilities with a primary focus in the Asia Pacific.
9. What pricing options are available for accessing the report?
Pricing options include single-user, multi-user, and enterprise licenses priced at USD 4750, USD 5250, and USD 8750 respectively.
10. Is the market size provided in terms of value or volume?
The market size is provided in terms of value, measured in Million and volume, measured in K Units.
11. Are there any specific market keywords associated with the report?
Yes, the market keyword associated with the report is "APAC Industrial Valves Industry," which aids in identifying and referencing the specific market segment covered.
12. How do I determine which pricing option suits my needs best?
The pricing options vary based on user requirements and access needs. Individual users may opt for single-user licenses, while businesses requiring broader access may choose multi-user or enterprise licenses for cost-effective access to the report.
13. Are there any additional resources or data provided in the APAC Industrial Valves Industry report?
While the report offers comprehensive insights, it's advisable to review the specific contents or supplementary materials provided to ascertain if additional resources or data are available.
14. How can I stay updated on further developments or reports in the APAC Industrial Valves Industry?
To stay informed about further developments, trends, and reports in the APAC Industrial Valves Industry, consider subscribing to industry newsletters, following relevant companies and organizations, or regularly checking reputable industry news sources and publications.
Methodology
Step 1 - Identification of Relevant Samples Size from Population Database


Step 2 - Approaches for Defining Global Market Size (Value, Volume* & Price*)

Note*: In applicable scenarios
Step 3 - Data Sources
Primary Research
- Web Analytics
- Survey Reports
- Research Institute
- Latest Research Reports
- Opinion Leaders
Secondary Research
- Annual Reports
- White Paper
- Latest Press Release
- Industry Association
- Paid Database
- Investor Presentations

Step 4 - Data Triangulation
Involves using different sources of information in order to increase the validity of a study
These sources are likely to be stakeholders in a program - participants, other researchers, program staff, other community members, and so on.
Then we put all data in single framework & apply various statistical tools to find out the dynamic on the market.
During the analysis stage, feedback from the stakeholder groups would be compared to determine areas of agreement as well as areas of divergence