

Key Insights
The Asia-Pacific (APAC) scale inhibitors market is poised for substantial expansion, driven by escalating industrialization, stringent water quality regulations, and a heightened demand for effective water treatment solutions across diverse industries. The market exhibits a strong growth trajectory, with a projected Compound Annual Growth Rate (CAGR) of 5.1%. This growth is primarily propelled by the expansion of power generation, oil & gas, and desalination facilities throughout the region, all of which critically depend on scale inhibitors to maintain operational integrity and prevent costly downtime associated with scaling. Moreover, increasing global awareness of water scarcity and the imperative for sustainable water management practices are significantly boosting the adoption of advanced scale inhibitor technologies.
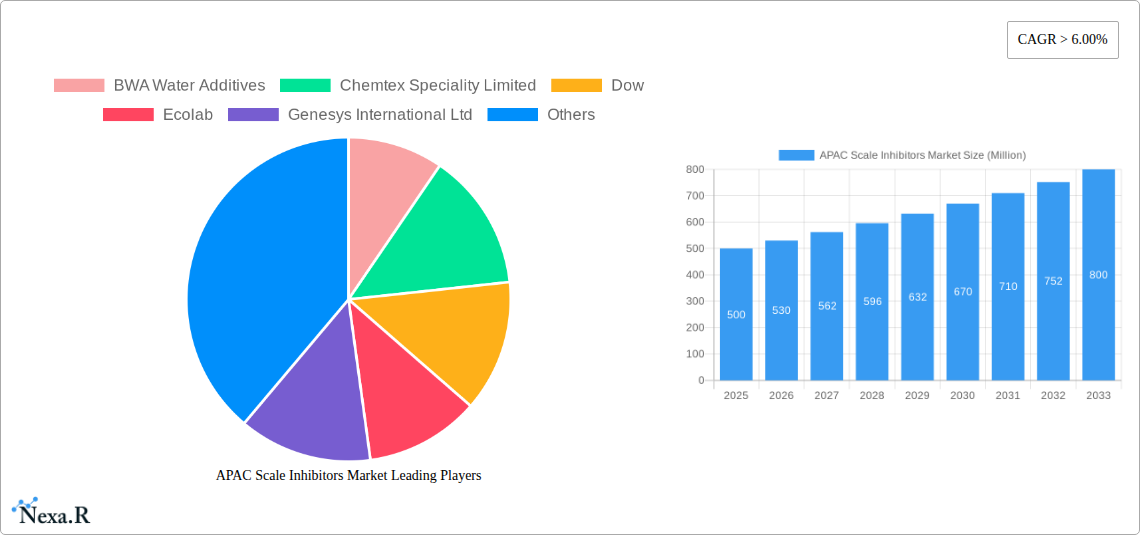
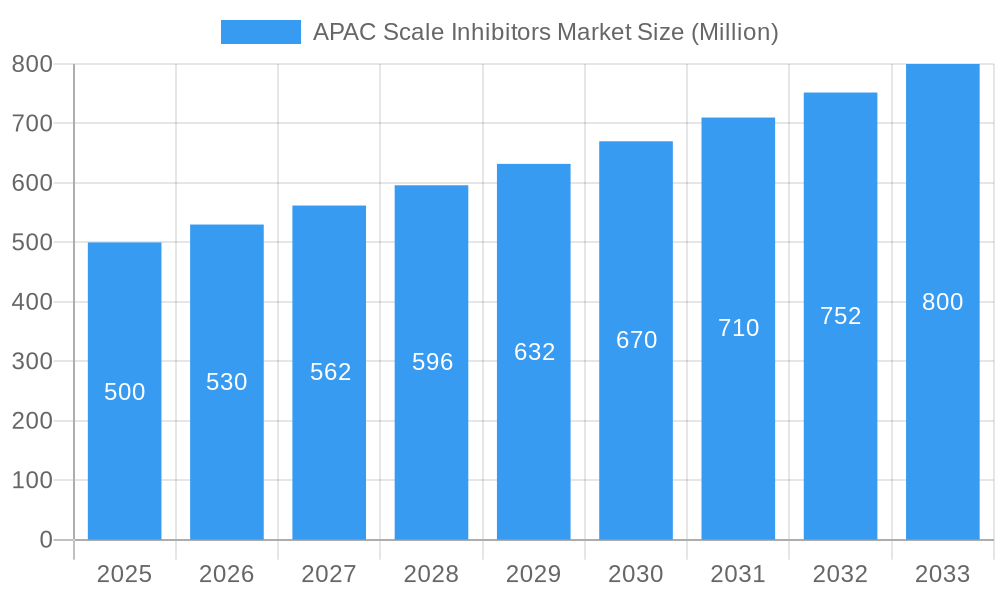
APAC Scale Inhibitors Market Market Size (In Billion)
Key market participants, including Dow, Ecolab, and Kemira, are actively contributing to this growth through continuous technological innovation, strategic collaborations, and expanded regional presence. The market is strategically segmented by inhibitor type (e.g., phosphonates, polycarboxylates), application (e.g., oil & gas, power generation), and geographical region. Current estimates indicate the APAC scale inhibitors market size was $3.98 billion in the base year 2025, and is projected to grow substantially. The competitive arena is characterized by a blend of established multinational corporations and dynamic regional players, presenting ample opportunities for both broad market penetration and specialized niche development.
APAC Scale Inhibitors Market Company Market Share
The forecast period (2025-2033) anticipates continued market expansion, particularly within the rapidly developing economies of APAC. Improvements in infrastructure and increased investments in water treatment facilities will remain key demand drivers. However, potential challenges include evolving regulatory landscapes and the ongoing need for cost-effective, environmentally sustainable inhibitor solutions. Consequently, companies prioritizing innovation, sustainability, and localized partnerships are best positioned for sustained success. Ongoing research and development in advanced scale inhibitor formulations, complemented by targeted marketing strategies addressing specific regional requirements, will be vital for capitalizing on this burgeoning market.
APAC Scale Inhibitors Market: A Comprehensive Market Report (2019-2033)
This in-depth report provides a comprehensive analysis of the Asia-Pacific (APAC) scale inhibitors market, offering invaluable insights for industry professionals, investors, and strategic decision-makers. The study covers the period from 2019 to 2033, with 2025 serving as the base and estimated year. The report meticulously examines market dynamics, growth trends, dominant segments, key players, and future opportunities within this crucial sector of the water treatment industry. The APAC scale inhibitors market, a child market under the broader water treatment chemicals market, is poised for significant expansion, driven by factors including increasing industrialization, stringent environmental regulations, and rising demand for efficient water management solutions. The total market value is projected to reach xx Million by 2033.
**
APAC Scale Inhibitors Market Dynamics & Structure
**
The APAC scale inhibitors market is characterized by a moderately fragmented landscape, with several multinational corporations and regional players vying for market share. Market concentration is relatively low, with no single dominant player controlling a significant portion. Technological innovation, particularly in the development of environmentally friendly and highly efficient scale inhibitors, is a key driver of market growth. Stringent environmental regulations across various APAC countries are pushing the adoption of eco-friendly solutions, while the increasing cost of water treatment necessitates the use of effective scale inhibitors to minimize operational expenses. Competitive product substitutes include other water treatment chemicals, but scale inhibitors maintain a crucial role due to their targeted functionality. The end-user demographics are primarily driven by industrial applications, such as power generation, oil & gas, and manufacturing, while the construction and municipal sectors also contribute significantly. M&A activity has been moderate in recent years, with xx deals recorded between 2019 and 2024, primarily driven by consolidation efforts and expansion strategies.
- Market Concentration: Moderately Fragmented (HHI xx)
- Technological Innovation: Focus on eco-friendly and high-efficiency solutions
- Regulatory Framework: Stringent environmental regulations driving adoption of eco-friendly solutions
- Competitive Substitutes: Other water treatment chemicals, but scale inhibitors maintain crucial role.
- End-User Demographics: Primarily industrial (power generation, oil & gas, manufacturing), also construction and municipal.
- M&A Trends: Moderate activity (xx deals between 2019-2024), driven by consolidation and expansion.
**
APAC Scale Inhibitors Market Growth Trends & Insights
The APAC scale inhibitors market experienced robust expansion during the historical period (2019-2024), with a Compound Annual Growth Rate (CAGR) of XX%. This significant surge is primarily attributed to the rapid pace of industrialization across key economies such as China, India, and Indonesia. The escalating investments in large-scale infrastructure projects have further amplified the demand for scale inhibitors, which are indispensable for preventing scaling issues in diverse industrial processes and critical water systems.
Technological innovation has also played a pivotal role, with the introduction of advanced polymer-based scale inhibitors enhancing product efficacy and driving widespread adoption. Furthermore, evolving consumer preferences are increasingly leaning towards environmentally friendly and sustainable solutions. This shift is compelling manufacturers to prioritize the development and marketing of eco-conscious scale inhibitors. The current market penetration rate for scale inhibitors in industrial applications stands at XX%, indicating substantial untapped potential for further growth, particularly in underpenetrated sectors. The forecast period (2025-2033) is expected to witness sustained market expansion, with a projected CAGR of XX%, propelled by continued industrial development and strategic investments in vital water infrastructure.
Dominant Regions, Countries, or Segments in APAC Scale Inhibitors Market
**
China dominates the APAC scale inhibitors market, accounting for xx% of the total market share in 2025. This dominance stems from the country's robust industrial sector, significant investments in infrastructure development, and rapid urbanization. India is another key market, exhibiting strong growth potential due to increasing industrial activity and expanding water infrastructure projects. The power generation segment is the largest end-user, followed by oil & gas and manufacturing. Several key factors contribute to this regional dominance:
- China: Robust industrial sector, significant infrastructure investments, rapid urbanization.
- India: Increasing industrial activity, expanding water infrastructure projects.
- Power Generation: Largest end-user due to high water usage and scaling concerns.
- Oil & Gas: Significant demand due to water treatment requirements in extraction and refining.
- Manufacturing: Diverse industrial processes requiring scale inhibition.
**
APAP Scale Inhibitors Market Product Landscape
**
The APAC scale inhibitors market offers a diverse range of products, including inorganic and organic scale inhibitors, tailored to specific applications and water conditions. Technological advancements have led to the development of high-performance polymers and blends exhibiting superior scaling inhibition properties and enhanced environmental compatibility. These products offer unique selling propositions such as improved efficiency, reduced dosage requirements, and minimized environmental impact. The focus is on developing tailored solutions to address specific challenges in various industries, optimizing performance and cost-effectiveness.
**
Key Drivers, Barriers & Challenges in APAC Scale Inhibitors Market
Key Drivers: The market's upward trajectory is propelled by several key factors:
- Rapid industrialization across the region.
- Increasing and sustained investments in water infrastructure development.
- The implementation and enforcement of stringent environmental regulations.
- Growing demand for efficient and effective water management solutions.
- Continuous technological advancements leading to the development of more efficient and environmentally benign scale inhibitors.
Key Challenges and Restraints: The market also faces certain headwinds that could potentially impede growth if not proactively managed:
- Volatility in raw material prices, impacting production costs and profitability.
- Disruptions within global supply chains, leading to potential shortages and delivery delays.
- Intense competition among market players, necessitating continuous innovation and competitive pricing strategies.
- The imperative for ongoing innovation to meet evolving regulatory standards and increasingly sophisticated customer demands.
Emerging Opportunities in APAC Scale Inhibitors Market
**
Untapped markets in Southeast Asia present significant opportunities for growth, along with the increasing adoption of scale inhibitors in the municipal water treatment sector. The development of innovative applications for scale inhibitors in industries such as desalination and geothermal energy represents a lucrative avenue for expansion. Evolving consumer preferences towards sustainable and environmentally benign solutions will also drive demand for eco-friendly scale inhibitors.
**
Growth Accelerators in the APAC Scale Inhibitors Market Industry
Several factors are poised to significantly accelerate the growth of the APAC scale inhibitors market:
- Strategic Partnerships: The formation of collaborative partnerships between leading scale inhibitor manufacturers and water treatment companies will foster joint development of customized and advanced solutions, driving innovation and market penetration.
- Technological Breakthroughs: Continued investment in research and development leading to significant technological advancements in scale inhibitor formulations, focusing on enhanced performance, extended lifespan, and improved environmental profiles, will be a key growth catalyst.
- Market Expansion Strategies: Proactive market expansion initiatives targeting underpenetrated industrial sectors and emerging geographic regions within APAC will unlock new avenues for growth and ensure sustainable development.
Key Players Shaping the APAC Scale Inhibitors Market Market
The APAC Scale Inhibitors Market is characterized by the presence of several prominent global and regional players, each contributing to the market's dynamism through innovation and strategic initiatives. Key entities shaping the market landscape include:
- BWA Water Additives
- Chemtex Speciality Limited
- Dow
- Ecolab
- Genesys International Ltd
- Ion Exchange India Limited
- Italmatch Chemicals S.p.A.
- Kemira
- King Lee Technologies
- Kurita Water Industries Ltd
- Solenis
- Suez
- Thermax Ltd
*This list is not exhaustive and represents some of the key contributors to the market.
Notable Milestones in APAC Scale Inhibitors Market Sector
**
- 2020: Launch of a new eco-friendly scale inhibitor by Kurita Water Industries Ltd.
- 2022: Acquisition of a regional scale inhibitor manufacturer by Ecolab.
- 2023: Introduction of advanced polymer-based scale inhibitors by Dow.
- 2024: Implementation of stricter environmental regulations in several APAC countries.
**
In-Depth APAC Scale Inhibitors Market Market Outlook
The outlook for the APAC scale inhibitors market remains exceptionally positive. The region's relentless industrialization, coupled with significant ongoing investments in infrastructure development and a heightened global awareness of sustainable water management practices, are creating a fertile ground for market expansion. Strategic investments in cutting-edge research and development, alongside the cultivation of robust strategic partnerships, are anticipated to be pivotal in driving innovation and facilitating entry into new and emerging markets. The growing emphasis on eco-friendly solutions, harmonized with continuous technological advancements, will undoubtedly continue to shape the market's trajectory, ensuring a prosperous and dynamic future for the APAC scale inhibitors market.
APAC Scale Inhibitors Market Segmentation
-
1. Type
- 1.1. Scale & Corrosion Inhibitors
- 1.2. Coagulants & Flocculants
- 1.3. pH Boosters
- 1.4. Oxygen Scavengers
- 1.5. Others
-
2. Chemistry
- 2.1. Basic Chemicals
- 2.2. Blended/Specialty Chemicals
-
3. End-user Industry
- 3.1. Power Generation
- 3.2. Steel & Metal Industry
- 3.3. Oil Refinery
- 3.4. Chemical & Petrochemical
- 3.5. Textile & Dye Industry
- 3.6. Sugar Mill
- 3.7. Paper Mill
- 3.8. Food & Beverage
- 3.9. Institutional
- 3.10. Pharmaceutical
- 3.11. Others
-
4. Geography
- 4.1. China
- 4.2. India
- 4.3. Japan
- 4.4. South Korea
- 4.5. ASEAN Countries
- 4.6. Rest of Asia-Pacific
APAC Scale Inhibitors Market Segmentation By Geography
- 1. China
- 2. India
- 3. Japan
- 4. South Korea
- 5. ASEAN Countries
- 6. Rest of Asia Pacific
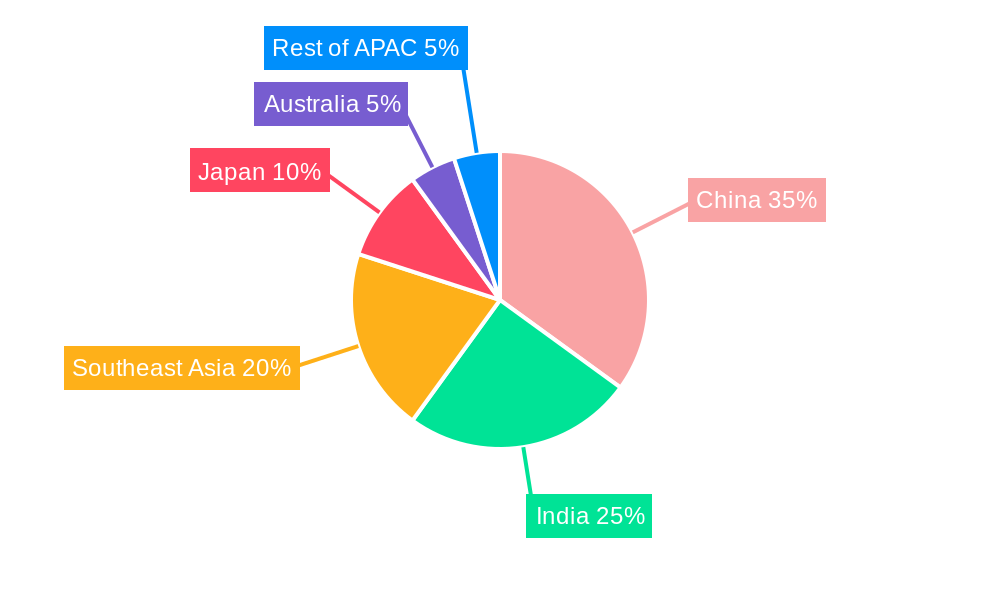
APAC Scale Inhibitors Market Regional Market Share
Geographic Coverage of APAC Scale Inhibitors Market
APAC Scale Inhibitors Market REPORT HIGHLIGHTS
| Aspects | Details |
|---|---|
| Study Period | 2020-2034 |
| Base Year | 2025 |
| Estimated Year | 2026 |
| Forecast Period | 2026-2034 |
| Historical Period | 2020-2025 |
| Growth Rate | CAGR of 5.1% from 2020-2034 |
| Segmentation |
|
Table of Contents
- 1. Introduction
- 1.1. Research Scope
- 1.2. Market Segmentation
- 1.3. Research Objective
- 1.4. Definitions and Assumptions
- 2. Executive Summary
- 2.1. Market Snapshot
- 3. Market Dynamics
- 3.1. Market Drivers
- 3.2. Market Restrains
- 3.3. Market Trends
- 3.4. Market Opportunities
- 4. Market Factor Analysis
- 4.1. Porters Five Forces
- 4.1.1. Bargaining Power of Suppliers
- 4.1.2. Bargaining Power of Buyers
- 4.1.3. Threat of New Entrants
- 4.1.4. Threat of Substitutes
- 4.1.5. Competitive Rivalry
- 4.2. PESTEL analysis
- 4.3. BCG Analysis
- 4.3.1. Stars (High Growth, High Market Share)
- 4.3.2. Cash Cows (Low Growth, High Market Share)
- 4.3.3. Question Mark (High Growth, Low Market Share)
- 4.3.4. Dogs (Low Growth, Low Market Share)
- 4.4. Ansoff Matrix Analysis
- 4.5. Supply Chain Analysis
- 4.6. Regulatory Landscape
- 4.7. Current Market Potential and Opportunity Assessment (TAM–SAM–SOM Framework)
- 4.8. NRP Analyst Note
- 4.1. Porters Five Forces
- 5. Market Analysis, Insights and Forecast 2021-2033
- 5.1. Market Analysis, Insights and Forecast - by Type
- 5.1.1. Scale & Corrosion Inhibitors
- 5.1.2. Coagulants & Flocculants
- 5.1.3. pH Boosters
- 5.1.4. Oxygen Scavengers
- 5.1.5. Others
- 5.2. Market Analysis, Insights and Forecast - by Chemistry
- 5.2.1. Basic Chemicals
- 5.2.2. Blended/Specialty Chemicals
- 5.3. Market Analysis, Insights and Forecast - by End-user Industry
- 5.3.1. Power Generation
- 5.3.2. Steel & Metal Industry
- 5.3.3. Oil Refinery
- 5.3.4. Chemical & Petrochemical
- 5.3.5. Textile & Dye Industry
- 5.3.6. Sugar Mill
- 5.3.7. Paper Mill
- 5.3.8. Food & Beverage
- 5.3.9. Institutional
- 5.3.10. Pharmaceutical
- 5.3.11. Others
- 5.4. Market Analysis, Insights and Forecast - by Geography
- 5.4.1. China
- 5.4.2. India
- 5.4.3. Japan
- 5.4.4. South Korea
- 5.4.5. ASEAN Countries
- 5.4.6. Rest of Asia-Pacific
- 5.5. Market Analysis, Insights and Forecast - by Region
- 5.5.1. China
- 5.5.2. India
- 5.5.3. Japan
- 5.5.4. South Korea
- 5.5.5. ASEAN Countries
- 5.5.6. Rest of Asia Pacific
- 5.1. Market Analysis, Insights and Forecast - by Type
- 6. Global APAC Scale Inhibitors Market Analysis, Insights and Forecast, 2021-2033
- 6.1. Market Analysis, Insights and Forecast - by Type
- 6.1.1. Scale & Corrosion Inhibitors
- 6.1.2. Coagulants & Flocculants
- 6.1.3. pH Boosters
- 6.1.4. Oxygen Scavengers
- 6.1.5. Others
- 6.2. Market Analysis, Insights and Forecast - by Chemistry
- 6.2.1. Basic Chemicals
- 6.2.2. Blended/Specialty Chemicals
- 6.3. Market Analysis, Insights and Forecast - by End-user Industry
- 6.3.1. Power Generation
- 6.3.2. Steel & Metal Industry
- 6.3.3. Oil Refinery
- 6.3.4. Chemical & Petrochemical
- 6.3.5. Textile & Dye Industry
- 6.3.6. Sugar Mill
- 6.3.7. Paper Mill
- 6.3.8. Food & Beverage
- 6.3.9. Institutional
- 6.3.10. Pharmaceutical
- 6.3.11. Others
- 6.4. Market Analysis, Insights and Forecast - by Geography
- 6.4.1. China
- 6.4.2. India
- 6.4.3. Japan
- 6.4.4. South Korea
- 6.4.5. ASEAN Countries
- 6.4.6. Rest of Asia-Pacific
- 6.1. Market Analysis, Insights and Forecast - by Type
- 7. China APAC Scale Inhibitors Market Analysis, Insights and Forecast, 2020-2032
- 7.1. Market Analysis, Insights and Forecast - by Type
- 7.1.1. Scale & Corrosion Inhibitors
- 7.1.2. Coagulants & Flocculants
- 7.1.3. pH Boosters
- 7.1.4. Oxygen Scavengers
- 7.1.5. Others
- 7.2. Market Analysis, Insights and Forecast - by Chemistry
- 7.2.1. Basic Chemicals
- 7.2.2. Blended/Specialty Chemicals
- 7.3. Market Analysis, Insights and Forecast - by End-user Industry
- 7.3.1. Power Generation
- 7.3.2. Steel & Metal Industry
- 7.3.3. Oil Refinery
- 7.3.4. Chemical & Petrochemical
- 7.3.5. Textile & Dye Industry
- 7.3.6. Sugar Mill
- 7.3.7. Paper Mill
- 7.3.8. Food & Beverage
- 7.3.9. Institutional
- 7.3.10. Pharmaceutical
- 7.3.11. Others
- 7.4. Market Analysis, Insights and Forecast - by Geography
- 7.4.1. China
- 7.4.2. India
- 7.4.3. Japan
- 7.4.4. South Korea
- 7.4.5. ASEAN Countries
- 7.4.6. Rest of Asia-Pacific
- 7.1. Market Analysis, Insights and Forecast - by Type
- 8. India APAC Scale Inhibitors Market Analysis, Insights and Forecast, 2020-2032
- 8.1. Market Analysis, Insights and Forecast - by Type
- 8.1.1. Scale & Corrosion Inhibitors
- 8.1.2. Coagulants & Flocculants
- 8.1.3. pH Boosters
- 8.1.4. Oxygen Scavengers
- 8.1.5. Others
- 8.2. Market Analysis, Insights and Forecast - by Chemistry
- 8.2.1. Basic Chemicals
- 8.2.2. Blended/Specialty Chemicals
- 8.3. Market Analysis, Insights and Forecast - by End-user Industry
- 8.3.1. Power Generation
- 8.3.2. Steel & Metal Industry
- 8.3.3. Oil Refinery
- 8.3.4. Chemical & Petrochemical
- 8.3.5. Textile & Dye Industry
- 8.3.6. Sugar Mill
- 8.3.7. Paper Mill
- 8.3.8. Food & Beverage
- 8.3.9. Institutional
- 8.3.10. Pharmaceutical
- 8.3.11. Others
- 8.4. Market Analysis, Insights and Forecast - by Geography
- 8.4.1. China
- 8.4.2. India
- 8.4.3. Japan
- 8.4.4. South Korea
- 8.4.5. ASEAN Countries
- 8.4.6. Rest of Asia-Pacific
- 8.1. Market Analysis, Insights and Forecast - by Type
- 9. Japan APAC Scale Inhibitors Market Analysis, Insights and Forecast, 2020-2032
- 9.1. Market Analysis, Insights and Forecast - by Type
- 9.1.1. Scale & Corrosion Inhibitors
- 9.1.2. Coagulants & Flocculants
- 9.1.3. pH Boosters
- 9.1.4. Oxygen Scavengers
- 9.1.5. Others
- 9.2. Market Analysis, Insights and Forecast - by Chemistry
- 9.2.1. Basic Chemicals
- 9.2.2. Blended/Specialty Chemicals
- 9.3. Market Analysis, Insights and Forecast - by End-user Industry
- 9.3.1. Power Generation
- 9.3.2. Steel & Metal Industry
- 9.3.3. Oil Refinery
- 9.3.4. Chemical & Petrochemical
- 9.3.5. Textile & Dye Industry
- 9.3.6. Sugar Mill
- 9.3.7. Paper Mill
- 9.3.8. Food & Beverage
- 9.3.9. Institutional
- 9.3.10. Pharmaceutical
- 9.3.11. Others
- 9.4. Market Analysis, Insights and Forecast - by Geography
- 9.4.1. China
- 9.4.2. India
- 9.4.3. Japan
- 9.4.4. South Korea
- 9.4.5. ASEAN Countries
- 9.4.6. Rest of Asia-Pacific
- 9.1. Market Analysis, Insights and Forecast - by Type
- 10. South Korea APAC Scale Inhibitors Market Analysis, Insights and Forecast, 2020-2032
- 10.1. Market Analysis, Insights and Forecast - by Type
- 10.1.1. Scale & Corrosion Inhibitors
- 10.1.2. Coagulants & Flocculants
- 10.1.3. pH Boosters
- 10.1.4. Oxygen Scavengers
- 10.1.5. Others
- 10.2. Market Analysis, Insights and Forecast - by Chemistry
- 10.2.1. Basic Chemicals
- 10.2.2. Blended/Specialty Chemicals
- 10.3. Market Analysis, Insights and Forecast - by End-user Industry
- 10.3.1. Power Generation
- 10.3.2. Steel & Metal Industry
- 10.3.3. Oil Refinery
- 10.3.4. Chemical & Petrochemical
- 10.3.5. Textile & Dye Industry
- 10.3.6. Sugar Mill
- 10.3.7. Paper Mill
- 10.3.8. Food & Beverage
- 10.3.9. Institutional
- 10.3.10. Pharmaceutical
- 10.3.11. Others
- 10.4. Market Analysis, Insights and Forecast - by Geography
- 10.4.1. China
- 10.4.2. India
- 10.4.3. Japan
- 10.4.4. South Korea
- 10.4.5. ASEAN Countries
- 10.4.6. Rest of Asia-Pacific
- 10.1. Market Analysis, Insights and Forecast - by Type
- 11. ASEAN Countries APAC Scale Inhibitors Market Analysis, Insights and Forecast, 2020-2032
- 11.1. Market Analysis, Insights and Forecast - by Type
- 11.1.1. Scale & Corrosion Inhibitors
- 11.1.2. Coagulants & Flocculants
- 11.1.3. pH Boosters
- 11.1.4. Oxygen Scavengers
- 11.1.5. Others
- 11.2. Market Analysis, Insights and Forecast - by Chemistry
- 11.2.1. Basic Chemicals
- 11.2.2. Blended/Specialty Chemicals
- 11.3. Market Analysis, Insights and Forecast - by End-user Industry
- 11.3.1. Power Generation
- 11.3.2. Steel & Metal Industry
- 11.3.3. Oil Refinery
- 11.3.4. Chemical & Petrochemical
- 11.3.5. Textile & Dye Industry
- 11.3.6. Sugar Mill
- 11.3.7. Paper Mill
- 11.3.8. Food & Beverage
- 11.3.9. Institutional
- 11.3.10. Pharmaceutical
- 11.3.11. Others
- 11.4. Market Analysis, Insights and Forecast - by Geography
- 11.4.1. China
- 11.4.2. India
- 11.4.3. Japan
- 11.4.4. South Korea
- 11.4.5. ASEAN Countries
- 11.4.6. Rest of Asia-Pacific
- 11.1. Market Analysis, Insights and Forecast - by Type
- 12. Rest of Asia Pacific APAC Scale Inhibitors Market Analysis, Insights and Forecast, 2020-2032
- 12.1. Market Analysis, Insights and Forecast - by Type
- 12.1.1. Scale & Corrosion Inhibitors
- 12.1.2. Coagulants & Flocculants
- 12.1.3. pH Boosters
- 12.1.4. Oxygen Scavengers
- 12.1.5. Others
- 12.2. Market Analysis, Insights and Forecast - by Chemistry
- 12.2.1. Basic Chemicals
- 12.2.2. Blended/Specialty Chemicals
- 12.3. Market Analysis, Insights and Forecast - by End-user Industry
- 12.3.1. Power Generation
- 12.3.2. Steel & Metal Industry
- 12.3.3. Oil Refinery
- 12.3.4. Chemical & Petrochemical
- 12.3.5. Textile & Dye Industry
- 12.3.6. Sugar Mill
- 12.3.7. Paper Mill
- 12.3.8. Food & Beverage
- 12.3.9. Institutional
- 12.3.10. Pharmaceutical
- 12.3.11. Others
- 12.4. Market Analysis, Insights and Forecast - by Geography
- 12.4.1. China
- 12.4.2. India
- 12.4.3. Japan
- 12.4.4. South Korea
- 12.4.5. ASEAN Countries
- 12.4.6. Rest of Asia-Pacific
- 12.1. Market Analysis, Insights and Forecast - by Type
- 13. Competitive Analysis
- 13.1. Company Profiles
- 13.1.1 BWA Water Additives
- 13.1.1.1. Company Overview
- 13.1.1.2. Products
- 13.1.1.3. Company Financials
- 13.1.1.4. SWOT Analysis
- 13.1.2 Chemtex Speciality Limited
- 13.1.2.1. Company Overview
- 13.1.2.2. Products
- 13.1.2.3. Company Financials
- 13.1.2.4. SWOT Analysis
- 13.1.3 Dow
- 13.1.3.1. Company Overview
- 13.1.3.2. Products
- 13.1.3.3. Company Financials
- 13.1.3.4. SWOT Analysis
- 13.1.4 Ecolab
- 13.1.4.1. Company Overview
- 13.1.4.2. Products
- 13.1.4.3. Company Financials
- 13.1.4.4. SWOT Analysis
- 13.1.5 Genesys International Ltd
- 13.1.5.1. Company Overview
- 13.1.5.2. Products
- 13.1.5.3. Company Financials
- 13.1.5.4. SWOT Analysis
- 13.1.6 Ion Exchange India Limited
- 13.1.6.1. Company Overview
- 13.1.6.2. Products
- 13.1.6.3. Company Financials
- 13.1.6.4. SWOT Analysis
- 13.1.7 Italmatch Chemicals S P A
- 13.1.7.1. Company Overview
- 13.1.7.2. Products
- 13.1.7.3. Company Financials
- 13.1.7.4. SWOT Analysis
- 13.1.8 Kemira
- 13.1.8.1. Company Overview
- 13.1.8.2. Products
- 13.1.8.3. Company Financials
- 13.1.8.4. SWOT Analysis
- 13.1.9 King Lee Technologies
- 13.1.9.1. Company Overview
- 13.1.9.2. Products
- 13.1.9.3. Company Financials
- 13.1.9.4. SWOT Analysis
- 13.1.10 Kurita Water Industries Ltd
- 13.1.10.1. Company Overview
- 13.1.10.2. Products
- 13.1.10.3. Company Financials
- 13.1.10.4. SWOT Analysis
- 13.1.11 Solenis
- 13.1.11.1. Company Overview
- 13.1.11.2. Products
- 13.1.11.3. Company Financials
- 13.1.11.4. SWOT Analysis
- 13.1.12 Suez
- 13.1.12.1. Company Overview
- 13.1.12.2. Products
- 13.1.12.3. Company Financials
- 13.1.12.4. SWOT Analysis
- 13.1.13 Thermax Ltd*List Not Exhaustive
- 13.1.13.1. Company Overview
- 13.1.13.2. Products
- 13.1.13.3. Company Financials
- 13.1.13.4. SWOT Analysis
- 13.1.1 BWA Water Additives
- 13.2. Market Entropy
- 13.2.1 Company's Key Areas Served
- 13.2.2 Recent Developments
- 13.3. Company Market Share Analysis 2025
- 13.3.1 Top 5 Companies Market Share Analysis
- 13.3.2 Top 3 Companies Market Share Analysis
- 13.4. List of Potential Customers
- 14. Research Methodology
List of Figures
- Figure 1: Global APAC Scale Inhibitors Market Revenue Breakdown (billion, %) by Region 2025 & 2033
- Figure 2: China APAC Scale Inhibitors Market Revenue (billion), by Type 2025 & 2033
- Figure 3: China APAC Scale Inhibitors Market Revenue Share (%), by Type 2025 & 2033
- Figure 4: China APAC Scale Inhibitors Market Revenue (billion), by Chemistry 2025 & 2033
- Figure 5: China APAC Scale Inhibitors Market Revenue Share (%), by Chemistry 2025 & 2033
- Figure 6: China APAC Scale Inhibitors Market Revenue (billion), by End-user Industry 2025 & 2033
- Figure 7: China APAC Scale Inhibitors Market Revenue Share (%), by End-user Industry 2025 & 2033
- Figure 8: China APAC Scale Inhibitors Market Revenue (billion), by Geography 2025 & 2033
- Figure 9: China APAC Scale Inhibitors Market Revenue Share (%), by Geography 2025 & 2033
- Figure 10: China APAC Scale Inhibitors Market Revenue (billion), by Country 2025 & 2033
- Figure 11: China APAC Scale Inhibitors Market Revenue Share (%), by Country 2025 & 2033
- Figure 12: India APAC Scale Inhibitors Market Revenue (billion), by Type 2025 & 2033
- Figure 13: India APAC Scale Inhibitors Market Revenue Share (%), by Type 2025 & 2033
- Figure 14: India APAC Scale Inhibitors Market Revenue (billion), by Chemistry 2025 & 2033
- Figure 15: India APAC Scale Inhibitors Market Revenue Share (%), by Chemistry 2025 & 2033
- Figure 16: India APAC Scale Inhibitors Market Revenue (billion), by End-user Industry 2025 & 2033
- Figure 17: India APAC Scale Inhibitors Market Revenue Share (%), by End-user Industry 2025 & 2033
- Figure 18: India APAC Scale Inhibitors Market Revenue (billion), by Geography 2025 & 2033
- Figure 19: India APAC Scale Inhibitors Market Revenue Share (%), by Geography 2025 & 2033
- Figure 20: India APAC Scale Inhibitors Market Revenue (billion), by Country 2025 & 2033
- Figure 21: India APAC Scale Inhibitors Market Revenue Share (%), by Country 2025 & 2033
- Figure 22: Japan APAC Scale Inhibitors Market Revenue (billion), by Type 2025 & 2033
- Figure 23: Japan APAC Scale Inhibitors Market Revenue Share (%), by Type 2025 & 2033
- Figure 24: Japan APAC Scale Inhibitors Market Revenue (billion), by Chemistry 2025 & 2033
- Figure 25: Japan APAC Scale Inhibitors Market Revenue Share (%), by Chemistry 2025 & 2033
- Figure 26: Japan APAC Scale Inhibitors Market Revenue (billion), by End-user Industry 2025 & 2033
- Figure 27: Japan APAC Scale Inhibitors Market Revenue Share (%), by End-user Industry 2025 & 2033
- Figure 28: Japan APAC Scale Inhibitors Market Revenue (billion), by Geography 2025 & 2033
- Figure 29: Japan APAC Scale Inhibitors Market Revenue Share (%), by Geography 2025 & 2033
- Figure 30: Japan APAC Scale Inhibitors Market Revenue (billion), by Country 2025 & 2033
- Figure 31: Japan APAC Scale Inhibitors Market Revenue Share (%), by Country 2025 & 2033
- Figure 32: South Korea APAC Scale Inhibitors Market Revenue (billion), by Type 2025 & 2033
- Figure 33: South Korea APAC Scale Inhibitors Market Revenue Share (%), by Type 2025 & 2033
- Figure 34: South Korea APAC Scale Inhibitors Market Revenue (billion), by Chemistry 2025 & 2033
- Figure 35: South Korea APAC Scale Inhibitors Market Revenue Share (%), by Chemistry 2025 & 2033
- Figure 36: South Korea APAC Scale Inhibitors Market Revenue (billion), by End-user Industry 2025 & 2033
- Figure 37: South Korea APAC Scale Inhibitors Market Revenue Share (%), by End-user Industry 2025 & 2033
- Figure 38: South Korea APAC Scale Inhibitors Market Revenue (billion), by Geography 2025 & 2033
- Figure 39: South Korea APAC Scale Inhibitors Market Revenue Share (%), by Geography 2025 & 2033
- Figure 40: South Korea APAC Scale Inhibitors Market Revenue (billion), by Country 2025 & 2033
- Figure 41: South Korea APAC Scale Inhibitors Market Revenue Share (%), by Country 2025 & 2033
- Figure 42: ASEAN Countries APAC Scale Inhibitors Market Revenue (billion), by Type 2025 & 2033
- Figure 43: ASEAN Countries APAC Scale Inhibitors Market Revenue Share (%), by Type 2025 & 2033
- Figure 44: ASEAN Countries APAC Scale Inhibitors Market Revenue (billion), by Chemistry 2025 & 2033
- Figure 45: ASEAN Countries APAC Scale Inhibitors Market Revenue Share (%), by Chemistry 2025 & 2033
- Figure 46: ASEAN Countries APAC Scale Inhibitors Market Revenue (billion), by End-user Industry 2025 & 2033
- Figure 47: ASEAN Countries APAC Scale Inhibitors Market Revenue Share (%), by End-user Industry 2025 & 2033
- Figure 48: ASEAN Countries APAC Scale Inhibitors Market Revenue (billion), by Geography 2025 & 2033
- Figure 49: ASEAN Countries APAC Scale Inhibitors Market Revenue Share (%), by Geography 2025 & 2033
- Figure 50: ASEAN Countries APAC Scale Inhibitors Market Revenue (billion), by Country 2025 & 2033
- Figure 51: ASEAN Countries APAC Scale Inhibitors Market Revenue Share (%), by Country 2025 & 2033
- Figure 52: Rest of Asia Pacific APAC Scale Inhibitors Market Revenue (billion), by Type 2025 & 2033
- Figure 53: Rest of Asia Pacific APAC Scale Inhibitors Market Revenue Share (%), by Type 2025 & 2033
- Figure 54: Rest of Asia Pacific APAC Scale Inhibitors Market Revenue (billion), by Chemistry 2025 & 2033
- Figure 55: Rest of Asia Pacific APAC Scale Inhibitors Market Revenue Share (%), by Chemistry 2025 & 2033
- Figure 56: Rest of Asia Pacific APAC Scale Inhibitors Market Revenue (billion), by End-user Industry 2025 & 2033
- Figure 57: Rest of Asia Pacific APAC Scale Inhibitors Market Revenue Share (%), by End-user Industry 2025 & 2033
- Figure 58: Rest of Asia Pacific APAC Scale Inhibitors Market Revenue (billion), by Geography 2025 & 2033
- Figure 59: Rest of Asia Pacific APAC Scale Inhibitors Market Revenue Share (%), by Geography 2025 & 2033
- Figure 60: Rest of Asia Pacific APAC Scale Inhibitors Market Revenue (billion), by Country 2025 & 2033
- Figure 61: Rest of Asia Pacific APAC Scale Inhibitors Market Revenue Share (%), by Country 2025 & 2033
List of Tables
- Table 1: Global APAC Scale Inhibitors Market Revenue billion Forecast, by Type 2020 & 2033
- Table 2: Global APAC Scale Inhibitors Market Revenue billion Forecast, by Chemistry 2020 & 2033
- Table 3: Global APAC Scale Inhibitors Market Revenue billion Forecast, by End-user Industry 2020 & 2033
- Table 4: Global APAC Scale Inhibitors Market Revenue billion Forecast, by Geography 2020 & 2033
- Table 5: Global APAC Scale Inhibitors Market Revenue billion Forecast, by Region 2020 & 2033
- Table 6: Global APAC Scale Inhibitors Market Revenue billion Forecast, by Type 2020 & 2033
- Table 7: Global APAC Scale Inhibitors Market Revenue billion Forecast, by Chemistry 2020 & 2033
- Table 8: Global APAC Scale Inhibitors Market Revenue billion Forecast, by End-user Industry 2020 & 2033
- Table 9: Global APAC Scale Inhibitors Market Revenue billion Forecast, by Geography 2020 & 2033
- Table 10: Global APAC Scale Inhibitors Market Revenue billion Forecast, by Country 2020 & 2033
- Table 11: Global APAC Scale Inhibitors Market Revenue billion Forecast, by Type 2020 & 2033
- Table 12: Global APAC Scale Inhibitors Market Revenue billion Forecast, by Chemistry 2020 & 2033
- Table 13: Global APAC Scale Inhibitors Market Revenue billion Forecast, by End-user Industry 2020 & 2033
- Table 14: Global APAC Scale Inhibitors Market Revenue billion Forecast, by Geography 2020 & 2033
- Table 15: Global APAC Scale Inhibitors Market Revenue billion Forecast, by Country 2020 & 2033
- Table 16: Global APAC Scale Inhibitors Market Revenue billion Forecast, by Type 2020 & 2033
- Table 17: Global APAC Scale Inhibitors Market Revenue billion Forecast, by Chemistry 2020 & 2033
- Table 18: Global APAC Scale Inhibitors Market Revenue billion Forecast, by End-user Industry 2020 & 2033
- Table 19: Global APAC Scale Inhibitors Market Revenue billion Forecast, by Geography 2020 & 2033
- Table 20: Global APAC Scale Inhibitors Market Revenue billion Forecast, by Country 2020 & 2033
- Table 21: Global APAC Scale Inhibitors Market Revenue billion Forecast, by Type 2020 & 2033
- Table 22: Global APAC Scale Inhibitors Market Revenue billion Forecast, by Chemistry 2020 & 2033
- Table 23: Global APAC Scale Inhibitors Market Revenue billion Forecast, by End-user Industry 2020 & 2033
- Table 24: Global APAC Scale Inhibitors Market Revenue billion Forecast, by Geography 2020 & 2033
- Table 25: Global APAC Scale Inhibitors Market Revenue billion Forecast, by Country 2020 & 2033
- Table 26: Global APAC Scale Inhibitors Market Revenue billion Forecast, by Type 2020 & 2033
- Table 27: Global APAC Scale Inhibitors Market Revenue billion Forecast, by Chemistry 2020 & 2033
- Table 28: Global APAC Scale Inhibitors Market Revenue billion Forecast, by End-user Industry 2020 & 2033
- Table 29: Global APAC Scale Inhibitors Market Revenue billion Forecast, by Geography 2020 & 2033
- Table 30: Global APAC Scale Inhibitors Market Revenue billion Forecast, by Country 2020 & 2033
- Table 31: Global APAC Scale Inhibitors Market Revenue billion Forecast, by Type 2020 & 2033
- Table 32: Global APAC Scale Inhibitors Market Revenue billion Forecast, by Chemistry 2020 & 2033
- Table 33: Global APAC Scale Inhibitors Market Revenue billion Forecast, by End-user Industry 2020 & 2033
- Table 34: Global APAC Scale Inhibitors Market Revenue billion Forecast, by Geography 2020 & 2033
- Table 35: Global APAC Scale Inhibitors Market Revenue billion Forecast, by Country 2020 & 2033
Frequently Asked Questions
1. What is the projected Compound Annual Growth Rate (CAGR) of the APAC Scale Inhibitors Market?
The projected CAGR is approximately 5.1%.
2. Which companies are prominent players in the APAC Scale Inhibitors Market?
Key companies in the market include BWA Water Additives, Chemtex Speciality Limited, Dow, Ecolab, Genesys International Ltd, Ion Exchange India Limited, Italmatch Chemicals S P A, Kemira, King Lee Technologies, Kurita Water Industries Ltd, Solenis, Suez, Thermax Ltd*List Not Exhaustive.
3. What are the main segments of the APAC Scale Inhibitors Market?
The market segments include Type, Chemistry, End-user Industry, Geography.
4. Can you provide details about the market size?
The market size is estimated to be USD 3.98 billion as of 2022.
5. What are some drivers contributing to market growth?
; Accelerating usage in Power Industry; Growing Popularity of Zero Liquid Blowdown.
6. What are the notable trends driving market growth?
Scale & Corrosion Inhibitors to Dominate the Market.
7. Are there any restraints impacting market growth?
; Accelerating usage in Power Industry; Growing Popularity of Zero Liquid Blowdown.
8. Can you provide examples of recent developments in the market?
N/A
9. What pricing options are available for accessing the report?
Pricing options include single-user, multi-user, and enterprise licenses priced at USD 4750, USD 5250, and USD 8750 respectively.
10. Is the market size provided in terms of value or volume?
The market size is provided in terms of value, measured in billion.
11. Are there any specific market keywords associated with the report?
Yes, the market keyword associated with the report is "APAC Scale Inhibitors Market," which aids in identifying and referencing the specific market segment covered.
12. How do I determine which pricing option suits my needs best?
The pricing options vary based on user requirements and access needs. Individual users may opt for single-user licenses, while businesses requiring broader access may choose multi-user or enterprise licenses for cost-effective access to the report.
13. Are there any additional resources or data provided in the APAC Scale Inhibitors Market report?
While the report offers comprehensive insights, it's advisable to review the specific contents or supplementary materials provided to ascertain if additional resources or data are available.
14. How can I stay updated on further developments or reports in the APAC Scale Inhibitors Market?
To stay informed about further developments, trends, and reports in the APAC Scale Inhibitors Market, consider subscribing to industry newsletters, following relevant companies and organizations, or regularly checking reputable industry news sources and publications.
Methodology
Step 1 - Identification of Relevant Samples Size from Population Database


Step 2 - Approaches for Defining Global Market Size (Value, Volume* & Price*)

Note*: In applicable scenarios
Step 3 - Data Sources
Primary Research
- Web Analytics
- Survey Reports
- Research Institute
- Latest Research Reports
- Opinion Leaders
Secondary Research
- Annual Reports
- White Paper
- Latest Press Release
- Industry Association
- Paid Database
- Investor Presentations

Step 4 - Data Triangulation
Involves using different sources of information in order to increase the validity of a study
These sources are likely to be stakeholders in a program - participants, other researchers, program staff, other community members, and so on.
Then we put all data in single framework & apply various statistical tools to find out the dynamic on the market.
During the analysis stage, feedback from the stakeholder groups would be compared to determine areas of agreement as well as areas of divergence