

Key Insights
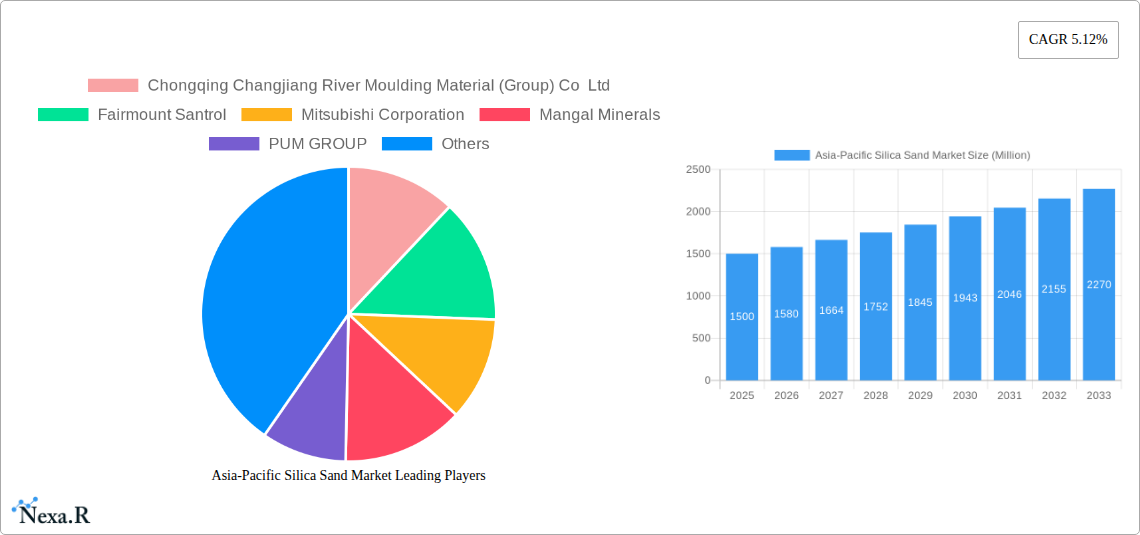
The Asia-Pacific silica sand market, valued at approximately $8.21 billion in 2025, is projected for robust expansion. The market is anticipated to grow at a compound annual growth rate (CAGR) of 6.8% from 2025 to 2033. Key growth drivers include the burgeoning construction sector, fueled by rapid urbanization and infrastructure development, leading to increased demand for silica sand in building materials. The expanding glass manufacturing industry, particularly in China and India, also significantly contributes to market growth. Technological advancements in silica sand processing and the rising adoption of high-purity silica sand in specialized applications like electronics and semiconductors are further propelling the market forward. However, stringent environmental regulations on sand mining may present a restraint. The market is segmented by application, including construction, glass, and foundry, and by geography, with China, India, and Japan being major segments. Leading players like Chongqing Changjiang River Moulding Material (Group) Co Ltd, Fairmount Santrol, and Mitsubishi Corporation are actively shaping the market through strategic initiatives. The forecast indicates sustained growth driven by ongoing infrastructure investment and industrial expansion across the Asia-Pacific region, with future growth influenced by sustainable mining practices and innovative applications.
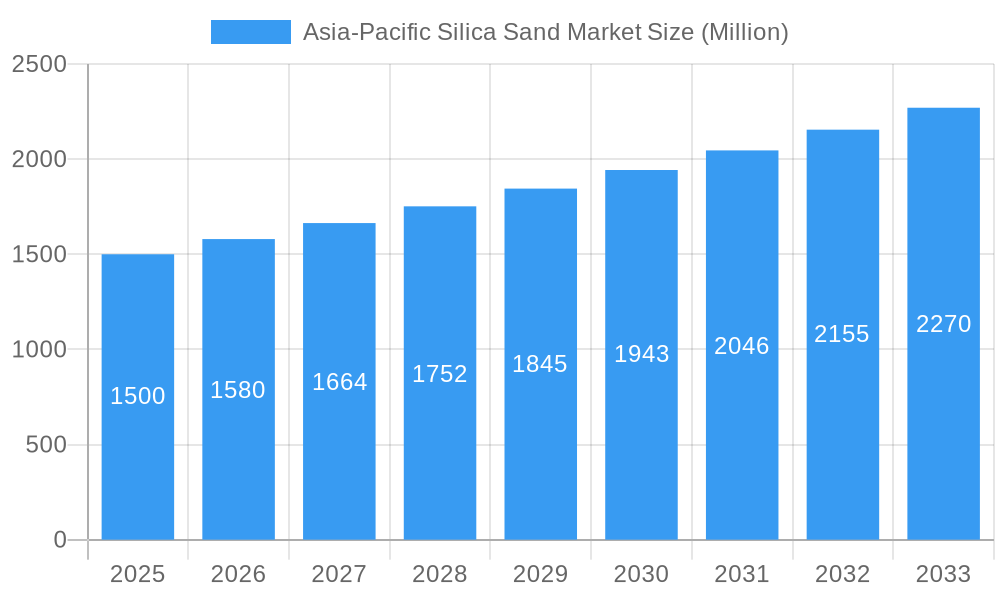
Asia-Pacific Silica Sand Market Market Size (In Billion)
The Asia-Pacific silica sand market's growth is also shaped by raw material availability, transportation economics, and global commodity price volatility. Its diverse applications make it a vital industrial component, rendering the market sensitive to macroeconomic trends. Competitive dynamics, featuring both multinational corporations and regional entities, foster a dynamic landscape. Companies are pursuing vertical integration, strategic acquisitions, and production efficiency enhancements for competitive advantage. The long-term outlook for the Asia-Pacific silica sand market remains positive, driven by persistent industrialization and infrastructure development, though sustainability challenges in sand mining require careful consideration. Future market evolution will balance escalating demand with environmentally responsible practices.
Asia-Pacific Silica Sand Market Company Market Share
Asia-Pacific Silica Sand Market: A Comprehensive Market Report (2019-2033)
This comprehensive report provides an in-depth analysis of the Asia-Pacific silica sand market, offering invaluable insights for industry professionals, investors, and strategic decision-makers. With a focus on market dynamics, growth trends, and key players, this report covers the period from 2019 to 2033, with 2025 serving as the base and estimated year. The forecast period spans from 2025 to 2033, encompassing the historical period from 2019 to 2024. The report segments the market to provide a granular understanding, revealing lucrative opportunities and potential challenges. The market is valued in Million units.
Asia-Pacific Silica Sand Market Dynamics & Structure
The Asia-Pacific silica sand market is characterized by moderate concentration, with a few large players and numerous smaller regional operators. Technological innovation, particularly in purification and processing techniques, is a key driver, alongside the growing demand from various end-use industries. Stringent environmental regulations and evolving safety standards influence market operations. Competitive pressure from alternative materials (e.g., synthetic silica) necessitates continuous innovation. The market witnesses consistent M&A activity, aiming to consolidate market share and access new technologies.
- Market Concentration: Moderately concentrated, with the top 5 players holding approximately xx% market share in 2025.
- Technological Innovation: Focus on enhancing purity, particle size control, and cost-effective processing.
- Regulatory Framework: Stringent environmental regulations impacting mining and processing operations.
- Competitive Substitutes: Synthetic silica and other alternative materials pose a competitive threat.
- End-User Demographics: Predominantly driven by construction, glass manufacturing, and the foundry industry.
- M&A Trends: Moderate level of mergers and acquisitions, with xx deals recorded between 2019 and 2024.
Asia-Pacific Silica Sand Market Growth Trends & Insights
The Asia-Pacific silica sand market has witnessed robust growth over the historical period (2019-2024), driven by increasing infrastructure development and industrialization across the region. The market size reached xx Million units in 2024 and is projected to exhibit a CAGR of xx% during the forecast period (2025-2033), reaching xx Million units by 2033. This growth is fueled by rising construction activities, particularly in rapidly developing economies, and growing demand for high-quality silica sand in specialized applications like electronics and solar energy. Technological advancements in silica sand processing and purification are improving product quality and expanding application possibilities. Shifting consumer preferences towards sustainable building materials are also boosting demand for ethically sourced and processed silica sand. Market penetration in emerging economies remains significant, contributing to the overall market expansion.
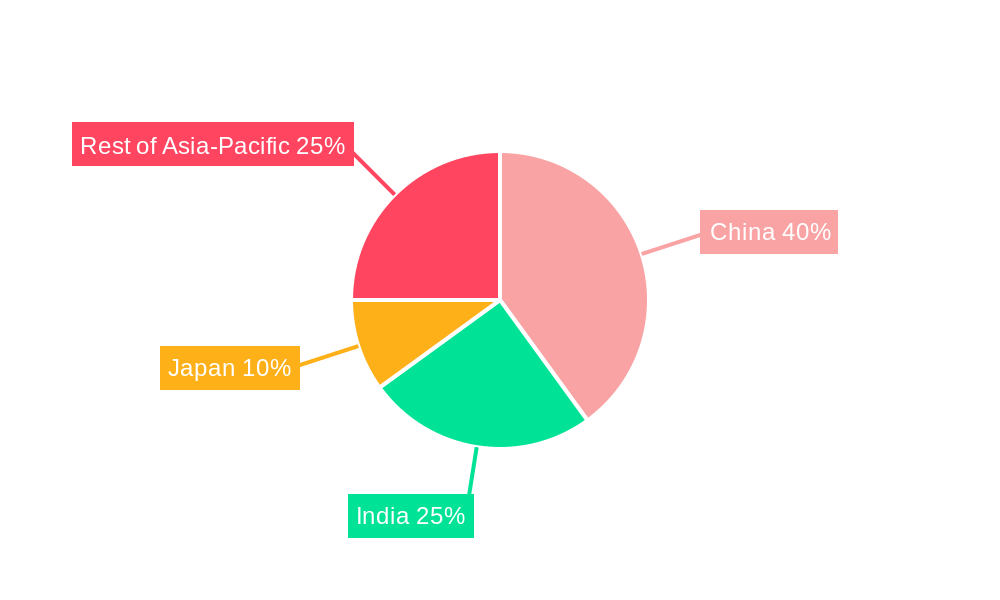
Dominant Regions, Countries, or Segments in Asia-Pacific Silica Sand Market
China remains the dominant market within the Asia-Pacific region, holding approximately xx% of the market share in 2025, driven by its robust construction sector and burgeoning manufacturing industries. India and other Southeast Asian nations are also experiencing significant growth, fueled by increasing infrastructure investments and industrial expansion. The construction segment represents the largest end-use application, contributing xx% of the total market value in 2025.
- Key Drivers in China: Massive infrastructure projects, rapid urbanization, and a large manufacturing base.
- Key Drivers in India: Government initiatives promoting infrastructure development and industrial growth.
- Key Drivers in Southeast Asia: Rapid economic growth and increasing investments in construction and manufacturing.
- Segment Dominance: Construction sector constitutes the largest application segment.
Asia-Pacific Silica Sand Market Product Landscape
The Asia-Pacific silica sand market offers a range of products catering to diverse applications. Products are differentiated based on purity levels, particle size distribution, and specific surface area. Technological advancements have led to the development of high-purity silica sand with enhanced performance characteristics, particularly for specialized applications in electronics and solar energy. This trend is accompanied by innovative processing techniques that minimize environmental impact and improve efficiency. Unique selling propositions often include superior purity, consistent quality, and tailored particle size distribution to meet specific end-user requirements.
Key Drivers, Barriers & Challenges in Asia-Pacific Silica Sand Market
Key Drivers:
- Growing infrastructure development across the region.
- Expanding industrialization and manufacturing activities.
- Rising demand for high-quality silica sand in specialized applications.
- Government initiatives promoting industrial growth.
Key Challenges & Restraints:
- Environmental regulations and concerns about sustainable mining practices.
- Fluctuations in raw material prices and supply chain disruptions.
- Competition from substitute materials.
- High transportation costs in certain regions. These factors can cumulatively impact market growth by xx% in the next five years.
Emerging Opportunities in Asia-Pacific Silica Sand Market
The Asia-Pacific silica sand market presents several emerging opportunities. Untapped markets in less-developed regions offer significant growth potential. Innovative applications in advanced materials, electronics, and renewable energy sectors are driving demand for high-purity silica sand. Evolving consumer preferences towards eco-friendly and sustainably sourced materials are creating new market segments.
Growth Accelerators in the Asia-Pacific Silica Sand Market Industry
Technological advancements in silica sand processing and purification are significantly accelerating market growth. Strategic partnerships between mining companies and end-users are enabling the development of customized solutions. Expansion strategies targeting emerging markets in Southeast Asia and other developing economies are boosting market penetration.
Key Players Shaping the Asia-Pacific Silica Sand Market Market
- Fairmount Santrol
- Mitsubishi Corporation
- JFE MINERAL Co LTD
- Sibelco
- TOCHU CORPORATION
- Chongqing Changjiang River Moulding Material (Group) Co Ltd
- Mangal Minerals
- PUM GROUP
- Raghav Productivity Enhancers Limited
- Shivam Chemicals
- Xinyi Golden Ruite Quartz Materials Co Ltd
- List Not Exhaustive
Notable Milestones in Asia-Pacific Silica Sand Market Sector
- 2022 Q3: Fairmount Santrol announces a new high-purity silica sand processing plant in Vietnam.
- 2021 Q4: Mitsubishi Corporation invests in a joint venture for silica sand mining in Indonesia.
- 2020 Q1: Sibelco launches a new sustainable silica sand mining initiative in Australia.
- Further details are included in the complete study.
In-Depth Asia-Pacific Silica Sand Market Market Outlook
The Asia-Pacific silica sand market is poised for sustained growth over the forecast period, driven by ongoing infrastructure development, industrial expansion, and the increasing demand for specialized applications. Strategic investments in advanced processing technologies and sustainable mining practices will be crucial for maintaining long-term market competitiveness. Companies focusing on innovation, product differentiation, and ethical sourcing are expected to capture significant market share. The market offers significant opportunities for both established players and new entrants, particularly those focusing on sustainable solutions and emerging applications.
Asia-Pacific Silica Sand Market Segmentation
-
1. End User Industry
- 1.1. Glass Manufacturing
- 1.2. Foundry
- 1.3. Chemical Production
- 1.4. Construction
- 1.5. Paints and Coatings
- 1.6. Ceramics and Refractories
- 1.7. Filtration
- 1.8. Oil and Gas Recovery
- 1.9. Other End User Industries
-
2. Geography
- 2.1. China
- 2.2. India
- 2.3. Japan
- 2.4. South Korea
- 2.5. Indonesia
- 2.6. Thailand
- 2.7. Malaysia
- 2.8. Singapore
- 2.9. Philippines
- 2.10. Vietnam
Asia-Pacific Silica Sand Market Segmentation By Geography
- 1. China
- 2. India
- 3. Japan
- 4. South Korea
- 5. Indonesia
- 6. Thailand
- 7. Malaysia
- 8. Singapore
- 9. Philippines
- 10. Vietnam
Asia-Pacific Silica Sand Market Regional Market Share
Geographic Coverage of Asia-Pacific Silica Sand Market
Asia-Pacific Silica Sand Market REPORT HIGHLIGHTS
| Aspects | Details |
|---|---|
| Study Period | 2020-2034 |
| Base Year | 2025 |
| Estimated Year | 2026 |
| Forecast Period | 2026-2034 |
| Historical Period | 2020-2025 |
| Growth Rate | CAGR of 6.8% from 2020-2034 |
| Segmentation |
|
Table of Contents
- 1. Introduction
- 1.1. Research Scope
- 1.2. Market Segmentation
- 1.3. Research Objective
- 1.4. Definitions and Assumptions
- 2. Executive Summary
- 2.1. Market Snapshot
- 3. Market Dynamics
- 3.1. Market Drivers
- 3.2. Market Restrains
- 3.3. Market Trends
- 3.4. Market Opportunities
- 4. Market Factor Analysis
- 4.1. Porters Five Forces
- 4.1.1. Bargaining Power of Suppliers
- 4.1.2. Bargaining Power of Buyers
- 4.1.3. Threat of New Entrants
- 4.1.4. Threat of Substitutes
- 4.1.5. Competitive Rivalry
- 4.2. PESTEL analysis
- 4.3. BCG Analysis
- 4.3.1. Stars (High Growth, High Market Share)
- 4.3.2. Cash Cows (Low Growth, High Market Share)
- 4.3.3. Question Mark (High Growth, Low Market Share)
- 4.3.4. Dogs (Low Growth, Low Market Share)
- 4.4. Ansoff Matrix Analysis
- 4.5. Supply Chain Analysis
- 4.6. Regulatory Landscape
- 4.7. Current Market Potential and Opportunity Assessment (TAM–SAM–SOM Framework)
- 4.8. NRP Analyst Note
- 4.1. Porters Five Forces
- 5. Market Analysis, Insights and Forecast 2021-2033
- 5.1. Market Analysis, Insights and Forecast - by End User Industry
- 5.1.1. Glass Manufacturing
- 5.1.2. Foundry
- 5.1.3. Chemical Production
- 5.1.4. Construction
- 5.1.5. Paints and Coatings
- 5.1.6. Ceramics and Refractories
- 5.1.7. Filtration
- 5.1.8. Oil and Gas Recovery
- 5.1.9. Other End User Industries
- 5.2. Market Analysis, Insights and Forecast - by Geography
- 5.2.1. China
- 5.2.2. India
- 5.2.3. Japan
- 5.2.4. South Korea
- 5.2.5. Indonesia
- 5.2.6. Thailand
- 5.2.7. Malaysia
- 5.2.8. Singapore
- 5.2.9. Philippines
- 5.2.10. Vietnam
- 5.3. Market Analysis, Insights and Forecast - by Region
- 5.3.1. China
- 5.3.2. India
- 5.3.3. Japan
- 5.3.4. South Korea
- 5.3.5. Indonesia
- 5.3.6. Thailand
- 5.3.7. Malaysia
- 5.3.8. Singapore
- 5.3.9. Philippines
- 5.3.10. Vietnam
- 5.1. Market Analysis, Insights and Forecast - by End User Industry
- 6. Global Asia-Pacific Silica Sand Market Analysis, Insights and Forecast, 2021-2033
- 6.1. Market Analysis, Insights and Forecast - by End User Industry
- 6.1.1. Glass Manufacturing
- 6.1.2. Foundry
- 6.1.3. Chemical Production
- 6.1.4. Construction
- 6.1.5. Paints and Coatings
- 6.1.6. Ceramics and Refractories
- 6.1.7. Filtration
- 6.1.8. Oil and Gas Recovery
- 6.1.9. Other End User Industries
- 6.2. Market Analysis, Insights and Forecast - by Geography
- 6.2.1. China
- 6.2.2. India
- 6.2.3. Japan
- 6.2.4. South Korea
- 6.2.5. Indonesia
- 6.2.6. Thailand
- 6.2.7. Malaysia
- 6.2.8. Singapore
- 6.2.9. Philippines
- 6.2.10. Vietnam
- 6.1. Market Analysis, Insights and Forecast - by End User Industry
- 7. China Asia-Pacific Silica Sand Market Analysis, Insights and Forecast, 2020-2032
- 7.1. Market Analysis, Insights and Forecast - by End User Industry
- 7.1.1. Glass Manufacturing
- 7.1.2. Foundry
- 7.1.3. Chemical Production
- 7.1.4. Construction
- 7.1.5. Paints and Coatings
- 7.1.6. Ceramics and Refractories
- 7.1.7. Filtration
- 7.1.8. Oil and Gas Recovery
- 7.1.9. Other End User Industries
- 7.2. Market Analysis, Insights and Forecast - by Geography
- 7.2.1. China
- 7.2.2. India
- 7.2.3. Japan
- 7.2.4. South Korea
- 7.2.5. Indonesia
- 7.2.6. Thailand
- 7.2.7. Malaysia
- 7.2.8. Singapore
- 7.2.9. Philippines
- 7.2.10. Vietnam
- 7.1. Market Analysis, Insights and Forecast - by End User Industry
- 8. India Asia-Pacific Silica Sand Market Analysis, Insights and Forecast, 2020-2032
- 8.1. Market Analysis, Insights and Forecast - by End User Industry
- 8.1.1. Glass Manufacturing
- 8.1.2. Foundry
- 8.1.3. Chemical Production
- 8.1.4. Construction
- 8.1.5. Paints and Coatings
- 8.1.6. Ceramics and Refractories
- 8.1.7. Filtration
- 8.1.8. Oil and Gas Recovery
- 8.1.9. Other End User Industries
- 8.2. Market Analysis, Insights and Forecast - by Geography
- 8.2.1. China
- 8.2.2. India
- 8.2.3. Japan
- 8.2.4. South Korea
- 8.2.5. Indonesia
- 8.2.6. Thailand
- 8.2.7. Malaysia
- 8.2.8. Singapore
- 8.2.9. Philippines
- 8.2.10. Vietnam
- 8.1. Market Analysis, Insights and Forecast - by End User Industry
- 9. Japan Asia-Pacific Silica Sand Market Analysis, Insights and Forecast, 2020-2032
- 9.1. Market Analysis, Insights and Forecast - by End User Industry
- 9.1.1. Glass Manufacturing
- 9.1.2. Foundry
- 9.1.3. Chemical Production
- 9.1.4. Construction
- 9.1.5. Paints and Coatings
- 9.1.6. Ceramics and Refractories
- 9.1.7. Filtration
- 9.1.8. Oil and Gas Recovery
- 9.1.9. Other End User Industries
- 9.2. Market Analysis, Insights and Forecast - by Geography
- 9.2.1. China
- 9.2.2. India
- 9.2.3. Japan
- 9.2.4. South Korea
- 9.2.5. Indonesia
- 9.2.6. Thailand
- 9.2.7. Malaysia
- 9.2.8. Singapore
- 9.2.9. Philippines
- 9.2.10. Vietnam
- 9.1. Market Analysis, Insights and Forecast - by End User Industry
- 10. South Korea Asia-Pacific Silica Sand Market Analysis, Insights and Forecast, 2020-2032
- 10.1. Market Analysis, Insights and Forecast - by End User Industry
- 10.1.1. Glass Manufacturing
- 10.1.2. Foundry
- 10.1.3. Chemical Production
- 10.1.4. Construction
- 10.1.5. Paints and Coatings
- 10.1.6. Ceramics and Refractories
- 10.1.7. Filtration
- 10.1.8. Oil and Gas Recovery
- 10.1.9. Other End User Industries
- 10.2. Market Analysis, Insights and Forecast - by Geography
- 10.2.1. China
- 10.2.2. India
- 10.2.3. Japan
- 10.2.4. South Korea
- 10.2.5. Indonesia
- 10.2.6. Thailand
- 10.2.7. Malaysia
- 10.2.8. Singapore
- 10.2.9. Philippines
- 10.2.10. Vietnam
- 10.1. Market Analysis, Insights and Forecast - by End User Industry
- 11. Indonesia Asia-Pacific Silica Sand Market Analysis, Insights and Forecast, 2020-2032
- 11.1. Market Analysis, Insights and Forecast - by End User Industry
- 11.1.1. Glass Manufacturing
- 11.1.2. Foundry
- 11.1.3. Chemical Production
- 11.1.4. Construction
- 11.1.5. Paints and Coatings
- 11.1.6. Ceramics and Refractories
- 11.1.7. Filtration
- 11.1.8. Oil and Gas Recovery
- 11.1.9. Other End User Industries
- 11.2. Market Analysis, Insights and Forecast - by Geography
- 11.2.1. China
- 11.2.2. India
- 11.2.3. Japan
- 11.2.4. South Korea
- 11.2.5. Indonesia
- 11.2.6. Thailand
- 11.2.7. Malaysia
- 11.2.8. Singapore
- 11.2.9. Philippines
- 11.2.10. Vietnam
- 11.1. Market Analysis, Insights and Forecast - by End User Industry
- 12. Thailand Asia-Pacific Silica Sand Market Analysis, Insights and Forecast, 2020-2032
- 12.1. Market Analysis, Insights and Forecast - by End User Industry
- 12.1.1. Glass Manufacturing
- 12.1.2. Foundry
- 12.1.3. Chemical Production
- 12.1.4. Construction
- 12.1.5. Paints and Coatings
- 12.1.6. Ceramics and Refractories
- 12.1.7. Filtration
- 12.1.8. Oil and Gas Recovery
- 12.1.9. Other End User Industries
- 12.2. Market Analysis, Insights and Forecast - by Geography
- 12.2.1. China
- 12.2.2. India
- 12.2.3. Japan
- 12.2.4. South Korea
- 12.2.5. Indonesia
- 12.2.6. Thailand
- 12.2.7. Malaysia
- 12.2.8. Singapore
- 12.2.9. Philippines
- 12.2.10. Vietnam
- 12.1. Market Analysis, Insights and Forecast - by End User Industry
- 13. Malaysia Asia-Pacific Silica Sand Market Analysis, Insights and Forecast, 2020-2032
- 13.1. Market Analysis, Insights and Forecast - by End User Industry
- 13.1.1. Glass Manufacturing
- 13.1.2. Foundry
- 13.1.3. Chemical Production
- 13.1.4. Construction
- 13.1.5. Paints and Coatings
- 13.1.6. Ceramics and Refractories
- 13.1.7. Filtration
- 13.1.8. Oil and Gas Recovery
- 13.1.9. Other End User Industries
- 13.2. Market Analysis, Insights and Forecast - by Geography
- 13.2.1. China
- 13.2.2. India
- 13.2.3. Japan
- 13.2.4. South Korea
- 13.2.5. Indonesia
- 13.2.6. Thailand
- 13.2.7. Malaysia
- 13.2.8. Singapore
- 13.2.9. Philippines
- 13.2.10. Vietnam
- 13.1. Market Analysis, Insights and Forecast - by End User Industry
- 14. Singapore Asia-Pacific Silica Sand Market Analysis, Insights and Forecast, 2020-2032
- 14.1. Market Analysis, Insights and Forecast - by End User Industry
- 14.1.1. Glass Manufacturing
- 14.1.2. Foundry
- 14.1.3. Chemical Production
- 14.1.4. Construction
- 14.1.5. Paints and Coatings
- 14.1.6. Ceramics and Refractories
- 14.1.7. Filtration
- 14.1.8. Oil and Gas Recovery
- 14.1.9. Other End User Industries
- 14.2. Market Analysis, Insights and Forecast - by Geography
- 14.2.1. China
- 14.2.2. India
- 14.2.3. Japan
- 14.2.4. South Korea
- 14.2.5. Indonesia
- 14.2.6. Thailand
- 14.2.7. Malaysia
- 14.2.8. Singapore
- 14.2.9. Philippines
- 14.2.10. Vietnam
- 14.1. Market Analysis, Insights and Forecast - by End User Industry
- 15. Philippines Asia-Pacific Silica Sand Market Analysis, Insights and Forecast, 2020-2032
- 15.1. Market Analysis, Insights and Forecast - by End User Industry
- 15.1.1. Glass Manufacturing
- 15.1.2. Foundry
- 15.1.3. Chemical Production
- 15.1.4. Construction
- 15.1.5. Paints and Coatings
- 15.1.6. Ceramics and Refractories
- 15.1.7. Filtration
- 15.1.8. Oil and Gas Recovery
- 15.1.9. Other End User Industries
- 15.2. Market Analysis, Insights and Forecast - by Geography
- 15.2.1. China
- 15.2.2. India
- 15.2.3. Japan
- 15.2.4. South Korea
- 15.2.5. Indonesia
- 15.2.6. Thailand
- 15.2.7. Malaysia
- 15.2.8. Singapore
- 15.2.9. Philippines
- 15.2.10. Vietnam
- 15.1. Market Analysis, Insights and Forecast - by End User Industry
- 16. Vietnam Asia-Pacific Silica Sand Market Analysis, Insights and Forecast, 2020-2032
- 16.1. Market Analysis, Insights and Forecast - by End User Industry
- 16.1.1. Glass Manufacturing
- 16.1.2. Foundry
- 16.1.3. Chemical Production
- 16.1.4. Construction
- 16.1.5. Paints and Coatings
- 16.1.6. Ceramics and Refractories
- 16.1.7. Filtration
- 16.1.8. Oil and Gas Recovery
- 16.1.9. Other End User Industries
- 16.2. Market Analysis, Insights and Forecast - by Geography
- 16.2.1. China
- 16.2.2. India
- 16.2.3. Japan
- 16.2.4. South Korea
- 16.2.5. Indonesia
- 16.2.6. Thailand
- 16.2.7. Malaysia
- 16.2.8. Singapore
- 16.2.9. Philippines
- 16.2.10. Vietnam
- 16.1. Market Analysis, Insights and Forecast - by End User Industry
- 17. Competitive Analysis
- 17.1. Company Profiles
- 17.1.1 Chongqing Changjiang River Moulding Material (Group) Co Ltd
- 17.1.1.1. Company Overview
- 17.1.1.2. Products
- 17.1.1.3. Company Financials
- 17.1.1.4. SWOT Analysis
- 17.1.2 Fairmount Santrol
- 17.1.2.1. Company Overview
- 17.1.2.2. Products
- 17.1.2.3. Company Financials
- 17.1.2.4. SWOT Analysis
- 17.1.3 Mitsubishi Corporation
- 17.1.3.1. Company Overview
- 17.1.3.2. Products
- 17.1.3.3. Company Financials
- 17.1.3.4. SWOT Analysis
- 17.1.4 Mangal Minerals
- 17.1.4.1. Company Overview
- 17.1.4.2. Products
- 17.1.4.3. Company Financials
- 17.1.4.4. SWOT Analysis
- 17.1.5 PUM GROUP
- 17.1.5.1. Company Overview
- 17.1.5.2. Products
- 17.1.5.3. Company Financials
- 17.1.5.4. SWOT Analysis
- 17.1.6 JFE MINERAL Co LTD
- 17.1.6.1. Company Overview
- 17.1.6.2. Products
- 17.1.6.3. Company Financials
- 17.1.6.4. SWOT Analysis
- 17.1.7 Raghav Productivity Enhancers Limited
- 17.1.7.1. Company Overview
- 17.1.7.2. Products
- 17.1.7.3. Company Financials
- 17.1.7.4. SWOT Analysis
- 17.1.8 Sibelco
- 17.1.8.1. Company Overview
- 17.1.8.2. Products
- 17.1.8.3. Company Financials
- 17.1.8.4. SWOT Analysis
- 17.1.9 Shivam Chemicals
- 17.1.9.1. Company Overview
- 17.1.9.2. Products
- 17.1.9.3. Company Financials
- 17.1.9.4. SWOT Analysis
- 17.1.10 TOCHU CORPORATION
- 17.1.10.1. Company Overview
- 17.1.10.2. Products
- 17.1.10.3. Company Financials
- 17.1.10.4. SWOT Analysis
- 17.1.11 Xinyi Golden Ruite Quartz Materials Co Ltd *List Not Exhaustive
- 17.1.11.1. Company Overview
- 17.1.11.2. Products
- 17.1.11.3. Company Financials
- 17.1.11.4. SWOT Analysis
- 17.1.1 Chongqing Changjiang River Moulding Material (Group) Co Ltd
- 17.2. Market Entropy
- 17.2.1 Company's Key Areas Served
- 17.2.2 Recent Developments
- 17.3. Company Market Share Analysis 2025
- 17.3.1 Top 5 Companies Market Share Analysis
- 17.3.2 Top 3 Companies Market Share Analysis
- 17.4. List of Potential Customers
- 18. Research Methodology
List of Figures
- Figure 1: Global Asia-Pacific Silica Sand Market Revenue Breakdown (billion, %) by Region 2025 & 2033
- Figure 2: China Asia-Pacific Silica Sand Market Revenue (billion), by End User Industry 2025 & 2033
- Figure 3: China Asia-Pacific Silica Sand Market Revenue Share (%), by End User Industry 2025 & 2033
- Figure 4: China Asia-Pacific Silica Sand Market Revenue (billion), by Geography 2025 & 2033
- Figure 5: China Asia-Pacific Silica Sand Market Revenue Share (%), by Geography 2025 & 2033
- Figure 6: China Asia-Pacific Silica Sand Market Revenue (billion), by Country 2025 & 2033
- Figure 7: China Asia-Pacific Silica Sand Market Revenue Share (%), by Country 2025 & 2033
- Figure 8: India Asia-Pacific Silica Sand Market Revenue (billion), by End User Industry 2025 & 2033
- Figure 9: India Asia-Pacific Silica Sand Market Revenue Share (%), by End User Industry 2025 & 2033
- Figure 10: India Asia-Pacific Silica Sand Market Revenue (billion), by Geography 2025 & 2033
- Figure 11: India Asia-Pacific Silica Sand Market Revenue Share (%), by Geography 2025 & 2033
- Figure 12: India Asia-Pacific Silica Sand Market Revenue (billion), by Country 2025 & 2033
- Figure 13: India Asia-Pacific Silica Sand Market Revenue Share (%), by Country 2025 & 2033
- Figure 14: Japan Asia-Pacific Silica Sand Market Revenue (billion), by End User Industry 2025 & 2033
- Figure 15: Japan Asia-Pacific Silica Sand Market Revenue Share (%), by End User Industry 2025 & 2033
- Figure 16: Japan Asia-Pacific Silica Sand Market Revenue (billion), by Geography 2025 & 2033
- Figure 17: Japan Asia-Pacific Silica Sand Market Revenue Share (%), by Geography 2025 & 2033
- Figure 18: Japan Asia-Pacific Silica Sand Market Revenue (billion), by Country 2025 & 2033
- Figure 19: Japan Asia-Pacific Silica Sand Market Revenue Share (%), by Country 2025 & 2033
- Figure 20: South Korea Asia-Pacific Silica Sand Market Revenue (billion), by End User Industry 2025 & 2033
- Figure 21: South Korea Asia-Pacific Silica Sand Market Revenue Share (%), by End User Industry 2025 & 2033
- Figure 22: South Korea Asia-Pacific Silica Sand Market Revenue (billion), by Geography 2025 & 2033
- Figure 23: South Korea Asia-Pacific Silica Sand Market Revenue Share (%), by Geography 2025 & 2033
- Figure 24: South Korea Asia-Pacific Silica Sand Market Revenue (billion), by Country 2025 & 2033
- Figure 25: South Korea Asia-Pacific Silica Sand Market Revenue Share (%), by Country 2025 & 2033
- Figure 26: Indonesia Asia-Pacific Silica Sand Market Revenue (billion), by End User Industry 2025 & 2033
- Figure 27: Indonesia Asia-Pacific Silica Sand Market Revenue Share (%), by End User Industry 2025 & 2033
- Figure 28: Indonesia Asia-Pacific Silica Sand Market Revenue (billion), by Geography 2025 & 2033
- Figure 29: Indonesia Asia-Pacific Silica Sand Market Revenue Share (%), by Geography 2025 & 2033
- Figure 30: Indonesia Asia-Pacific Silica Sand Market Revenue (billion), by Country 2025 & 2033
- Figure 31: Indonesia Asia-Pacific Silica Sand Market Revenue Share (%), by Country 2025 & 2033
- Figure 32: Thailand Asia-Pacific Silica Sand Market Revenue (billion), by End User Industry 2025 & 2033
- Figure 33: Thailand Asia-Pacific Silica Sand Market Revenue Share (%), by End User Industry 2025 & 2033
- Figure 34: Thailand Asia-Pacific Silica Sand Market Revenue (billion), by Geography 2025 & 2033
- Figure 35: Thailand Asia-Pacific Silica Sand Market Revenue Share (%), by Geography 2025 & 2033
- Figure 36: Thailand Asia-Pacific Silica Sand Market Revenue (billion), by Country 2025 & 2033
- Figure 37: Thailand Asia-Pacific Silica Sand Market Revenue Share (%), by Country 2025 & 2033
- Figure 38: Malaysia Asia-Pacific Silica Sand Market Revenue (billion), by End User Industry 2025 & 2033
- Figure 39: Malaysia Asia-Pacific Silica Sand Market Revenue Share (%), by End User Industry 2025 & 2033
- Figure 40: Malaysia Asia-Pacific Silica Sand Market Revenue (billion), by Geography 2025 & 2033
- Figure 41: Malaysia Asia-Pacific Silica Sand Market Revenue Share (%), by Geography 2025 & 2033
- Figure 42: Malaysia Asia-Pacific Silica Sand Market Revenue (billion), by Country 2025 & 2033
- Figure 43: Malaysia Asia-Pacific Silica Sand Market Revenue Share (%), by Country 2025 & 2033
- Figure 44: Singapore Asia-Pacific Silica Sand Market Revenue (billion), by End User Industry 2025 & 2033
- Figure 45: Singapore Asia-Pacific Silica Sand Market Revenue Share (%), by End User Industry 2025 & 2033
- Figure 46: Singapore Asia-Pacific Silica Sand Market Revenue (billion), by Geography 2025 & 2033
- Figure 47: Singapore Asia-Pacific Silica Sand Market Revenue Share (%), by Geography 2025 & 2033
- Figure 48: Singapore Asia-Pacific Silica Sand Market Revenue (billion), by Country 2025 & 2033
- Figure 49: Singapore Asia-Pacific Silica Sand Market Revenue Share (%), by Country 2025 & 2033
- Figure 50: Philippines Asia-Pacific Silica Sand Market Revenue (billion), by End User Industry 2025 & 2033
- Figure 51: Philippines Asia-Pacific Silica Sand Market Revenue Share (%), by End User Industry 2025 & 2033
- Figure 52: Philippines Asia-Pacific Silica Sand Market Revenue (billion), by Geography 2025 & 2033
- Figure 53: Philippines Asia-Pacific Silica Sand Market Revenue Share (%), by Geography 2025 & 2033
- Figure 54: Philippines Asia-Pacific Silica Sand Market Revenue (billion), by Country 2025 & 2033
- Figure 55: Philippines Asia-Pacific Silica Sand Market Revenue Share (%), by Country 2025 & 2033
- Figure 56: Vietnam Asia-Pacific Silica Sand Market Revenue (billion), by End User Industry 2025 & 2033
- Figure 57: Vietnam Asia-Pacific Silica Sand Market Revenue Share (%), by End User Industry 2025 & 2033
- Figure 58: Vietnam Asia-Pacific Silica Sand Market Revenue (billion), by Geography 2025 & 2033
- Figure 59: Vietnam Asia-Pacific Silica Sand Market Revenue Share (%), by Geography 2025 & 2033
- Figure 60: Vietnam Asia-Pacific Silica Sand Market Revenue (billion), by Country 2025 & 2033
- Figure 61: Vietnam Asia-Pacific Silica Sand Market Revenue Share (%), by Country 2025 & 2033
List of Tables
- Table 1: Global Asia-Pacific Silica Sand Market Revenue billion Forecast, by End User Industry 2020 & 2033
- Table 2: Global Asia-Pacific Silica Sand Market Revenue billion Forecast, by Geography 2020 & 2033
- Table 3: Global Asia-Pacific Silica Sand Market Revenue billion Forecast, by Region 2020 & 2033
- Table 4: Global Asia-Pacific Silica Sand Market Revenue billion Forecast, by End User Industry 2020 & 2033
- Table 5: Global Asia-Pacific Silica Sand Market Revenue billion Forecast, by Geography 2020 & 2033
- Table 6: Global Asia-Pacific Silica Sand Market Revenue billion Forecast, by Country 2020 & 2033
- Table 7: Global Asia-Pacific Silica Sand Market Revenue billion Forecast, by End User Industry 2020 & 2033
- Table 8: Global Asia-Pacific Silica Sand Market Revenue billion Forecast, by Geography 2020 & 2033
- Table 9: Global Asia-Pacific Silica Sand Market Revenue billion Forecast, by Country 2020 & 2033
- Table 10: Global Asia-Pacific Silica Sand Market Revenue billion Forecast, by End User Industry 2020 & 2033
- Table 11: Global Asia-Pacific Silica Sand Market Revenue billion Forecast, by Geography 2020 & 2033
- Table 12: Global Asia-Pacific Silica Sand Market Revenue billion Forecast, by Country 2020 & 2033
- Table 13: Global Asia-Pacific Silica Sand Market Revenue billion Forecast, by End User Industry 2020 & 2033
- Table 14: Global Asia-Pacific Silica Sand Market Revenue billion Forecast, by Geography 2020 & 2033
- Table 15: Global Asia-Pacific Silica Sand Market Revenue billion Forecast, by Country 2020 & 2033
- Table 16: Global Asia-Pacific Silica Sand Market Revenue billion Forecast, by End User Industry 2020 & 2033
- Table 17: Global Asia-Pacific Silica Sand Market Revenue billion Forecast, by Geography 2020 & 2033
- Table 18: Global Asia-Pacific Silica Sand Market Revenue billion Forecast, by Country 2020 & 2033
- Table 19: Global Asia-Pacific Silica Sand Market Revenue billion Forecast, by End User Industry 2020 & 2033
- Table 20: Global Asia-Pacific Silica Sand Market Revenue billion Forecast, by Geography 2020 & 2033
- Table 21: Global Asia-Pacific Silica Sand Market Revenue billion Forecast, by Country 2020 & 2033
- Table 22: Global Asia-Pacific Silica Sand Market Revenue billion Forecast, by End User Industry 2020 & 2033
- Table 23: Global Asia-Pacific Silica Sand Market Revenue billion Forecast, by Geography 2020 & 2033
- Table 24: Global Asia-Pacific Silica Sand Market Revenue billion Forecast, by Country 2020 & 2033
- Table 25: Global Asia-Pacific Silica Sand Market Revenue billion Forecast, by End User Industry 2020 & 2033
- Table 26: Global Asia-Pacific Silica Sand Market Revenue billion Forecast, by Geography 2020 & 2033
- Table 27: Global Asia-Pacific Silica Sand Market Revenue billion Forecast, by Country 2020 & 2033
- Table 28: Global Asia-Pacific Silica Sand Market Revenue billion Forecast, by End User Industry 2020 & 2033
- Table 29: Global Asia-Pacific Silica Sand Market Revenue billion Forecast, by Geography 2020 & 2033
- Table 30: Global Asia-Pacific Silica Sand Market Revenue billion Forecast, by Country 2020 & 2033
- Table 31: Global Asia-Pacific Silica Sand Market Revenue billion Forecast, by End User Industry 2020 & 2033
- Table 32: Global Asia-Pacific Silica Sand Market Revenue billion Forecast, by Geography 2020 & 2033
- Table 33: Global Asia-Pacific Silica Sand Market Revenue billion Forecast, by Country 2020 & 2033
Frequently Asked Questions
1. What is the projected Compound Annual Growth Rate (CAGR) of the Asia-Pacific Silica Sand Market?
The projected CAGR is approximately 6.8%.
2. Which companies are prominent players in the Asia-Pacific Silica Sand Market?
Key companies in the market include Chongqing Changjiang River Moulding Material (Group) Co Ltd, Fairmount Santrol, Mitsubishi Corporation, Mangal Minerals, PUM GROUP, JFE MINERAL Co LTD, Raghav Productivity Enhancers Limited, Sibelco, Shivam Chemicals, TOCHU CORPORATION, Xinyi Golden Ruite Quartz Materials Co Ltd *List Not Exhaustive.
3. What are the main segments of the Asia-Pacific Silica Sand Market?
The market segments include End User Industry, Geography.
4. Can you provide details about the market size?
The market size is estimated to be USD 8.21 billion as of 2022.
5. What are some drivers contributing to market growth?
Consistent Economic Growth Leading to Increase in Construction; Increasing Use in the Foundry Industry; Others Drivers.
6. What are the notable trends driving market growth?
Increasing Demand from the Glass Industry.
7. Are there any restraints impacting market growth?
Consistent Economic Growth Leading to Increase in Construction; Increasing Use in the Foundry Industry; Others Drivers.
8. Can you provide examples of recent developments in the market?
The recent developments pertaining to the major players in the market are covered in the complete study.
9. What pricing options are available for accessing the report?
Pricing options include single-user, multi-user, and enterprise licenses priced at USD 4750, USD 5250, and USD 8750 respectively.
10. Is the market size provided in terms of value or volume?
The market size is provided in terms of value, measured in billion.
11. Are there any specific market keywords associated with the report?
Yes, the market keyword associated with the report is "Asia-Pacific Silica Sand Market," which aids in identifying and referencing the specific market segment covered.
12. How do I determine which pricing option suits my needs best?
The pricing options vary based on user requirements and access needs. Individual users may opt for single-user licenses, while businesses requiring broader access may choose multi-user or enterprise licenses for cost-effective access to the report.
13. Are there any additional resources or data provided in the Asia-Pacific Silica Sand Market report?
While the report offers comprehensive insights, it's advisable to review the specific contents or supplementary materials provided to ascertain if additional resources or data are available.
14. How can I stay updated on further developments or reports in the Asia-Pacific Silica Sand Market?
To stay informed about further developments, trends, and reports in the Asia-Pacific Silica Sand Market, consider subscribing to industry newsletters, following relevant companies and organizations, or regularly checking reputable industry news sources and publications.
Methodology
Step 1 - Identification of Relevant Samples Size from Population Database


Step 2 - Approaches for Defining Global Market Size (Value, Volume* & Price*)

Note*: In applicable scenarios
Step 3 - Data Sources
Primary Research
- Web Analytics
- Survey Reports
- Research Institute
- Latest Research Reports
- Opinion Leaders
Secondary Research
- Annual Reports
- White Paper
- Latest Press Release
- Industry Association
- Paid Database
- Investor Presentations

Step 4 - Data Triangulation
Involves using different sources of information in order to increase the validity of a study
These sources are likely to be stakeholders in a program - participants, other researchers, program staff, other community members, and so on.
Then we put all data in single framework & apply various statistical tools to find out the dynamic on the market.
During the analysis stage, feedback from the stakeholder groups would be compared to determine areas of agreement as well as areas of divergence