

Key Insights
The Australia & New Zealand water treatment chemicals market, valued at $1.1 billion in 2024, is projected for significant expansion, forecasting a compound annual growth rate (CAGR) of 5.6% from 2024 to 2033. This growth is primarily attributed to increasing urbanization and industrialization, which elevate water consumption and necessitate stringent wastewater discharge regulations. Growing concerns over water scarcity are also driving demand for water conservation and reuse solutions, directly impacting the need for effective water treatment chemicals. Key industries such as food & beverage, mining, and power generation represent substantial end-user segments, contributing significantly to market expansion. Demand is particularly robust for biocides, disinfectants, coagulants, flocculants, and corrosion inhibitors, crucial for maintaining water quality and protecting infrastructure.
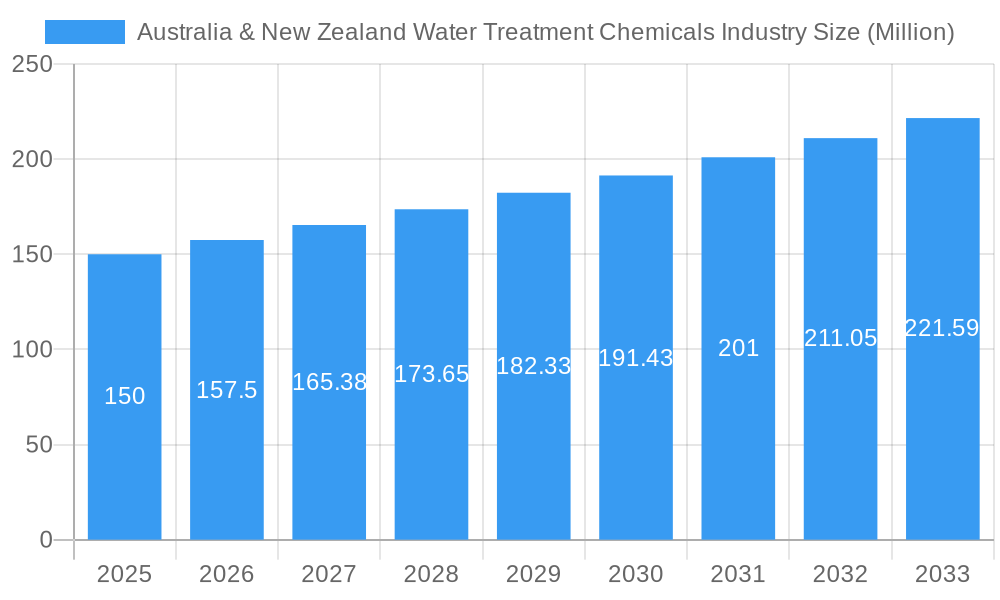
Australia & New Zealand Water Treatment Chemicals Industry Market Size (In Billion)
The forecast period (2024-2033) indicates sustained market growth fueled by ongoing infrastructure development, evolving environmental policies, and the adoption of sustainable water management practices. Government initiatives promoting water efficiency and the implementation of advanced treatment technologies are expected to provide further impetus. While the market remains competitive, opportunities exist for innovative companies offering specialized solutions that address environmental challenges and industry-specific needs. A shift towards sustainable and eco-friendly chemicals, supported by research and development, will shape future market dynamics. Regional variations in water quality and regulatory frameworks will influence localized growth patterns, with a persistent focus on water security and resource sustainability underpinning long-term market trends.
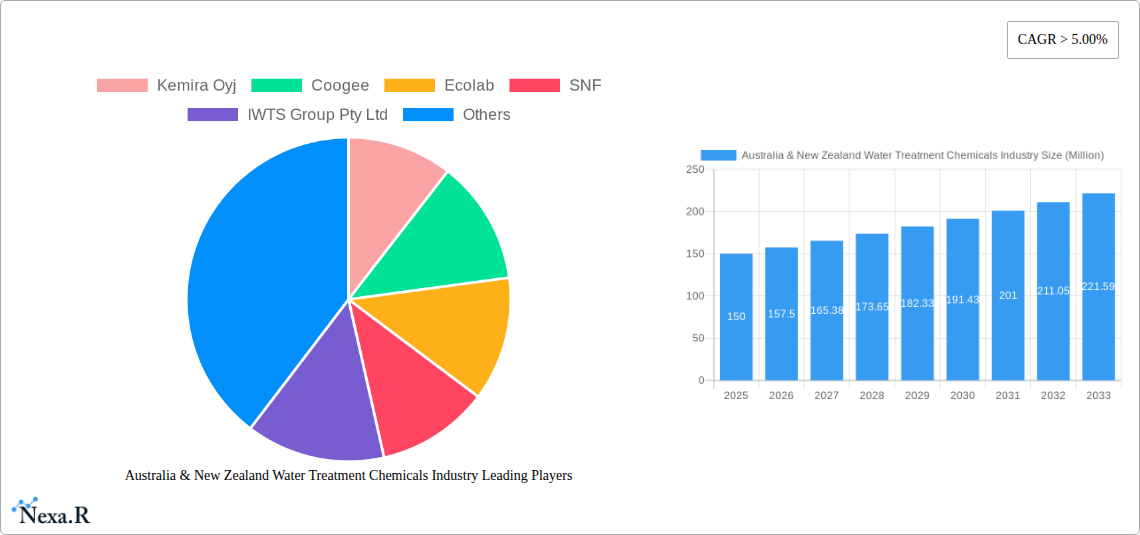
Australia & New Zealand Water Treatment Chemicals Industry Company Market Share
Australia & New Zealand Water Treatment Chemicals Industry: 2019-2033 Market Report
This comprehensive report provides an in-depth analysis of the Australia & New Zealand water treatment chemicals market, covering the period 2019-2033. It delves into market dynamics, growth trends, key players, and future opportunities, offering invaluable insights for industry professionals, investors, and strategic planners. The report utilizes data from 2019-2024 as the historical period, with 2025 as the base and estimated year, and forecasts extending to 2033. Market values are presented in millions of units (AUD).
Australia & New Zealand Water Treatment Chemicals Industry Market Dynamics & Structure
This section analyzes the competitive landscape, technological advancements, regulatory influences, and market trends within the Australian and New Zealand water treatment chemicals sector. The market is moderately concentrated, with several multinational and domestic players vying for market share. Technological innovation, driven by increasing demand for sustainable and efficient water treatment solutions, is a key growth driver. Stringent environmental regulations and water quality standards significantly impact market dynamics.
- Market Concentration: Moderately concentrated, with top 5 players holding approximately xx% market share in 2025.
- Technological Innovation: Focus on advanced oxidation processes, membrane filtration technologies, and automation driving efficiency and cost reduction.
- Regulatory Framework: Stringent environmental regulations and water quality standards influence product development and adoption.
- Competitive Substitutes: Limited direct substitutes, with competition primarily focused on product performance, pricing, and service.
- M&A Trends: Moderate M&A activity observed in the past 5 years, with xx deals recorded, primarily driven by expansion strategies and technological acquisition. xx% of these deals involved international players.
- End-User Demographics: Growth predominantly driven by the municipal, mining, and industrial sectors.
Australia & New Zealand Water Treatment Chemicals Industry Growth Trends & Insights
The Australian and New Zealand water treatment chemicals market experienced steady growth between 2019 and 2024, driven by factors such as increasing industrialization, urbanization, and stringent environmental regulations. The market is projected to continue its growth trajectory throughout the forecast period (2025-2033), albeit at a slightly moderated pace compared to the historical period. Technological advancements, such as the adoption of advanced oxidation processes (AOPs) and membrane bioreactors (MBRs), are contributing to efficiency improvements and market expansion. Shifting consumer preferences toward sustainable and environmentally friendly solutions are also shaping market demand. The market size is projected to reach xx million in 2033, exhibiting a CAGR of xx% during the forecast period.
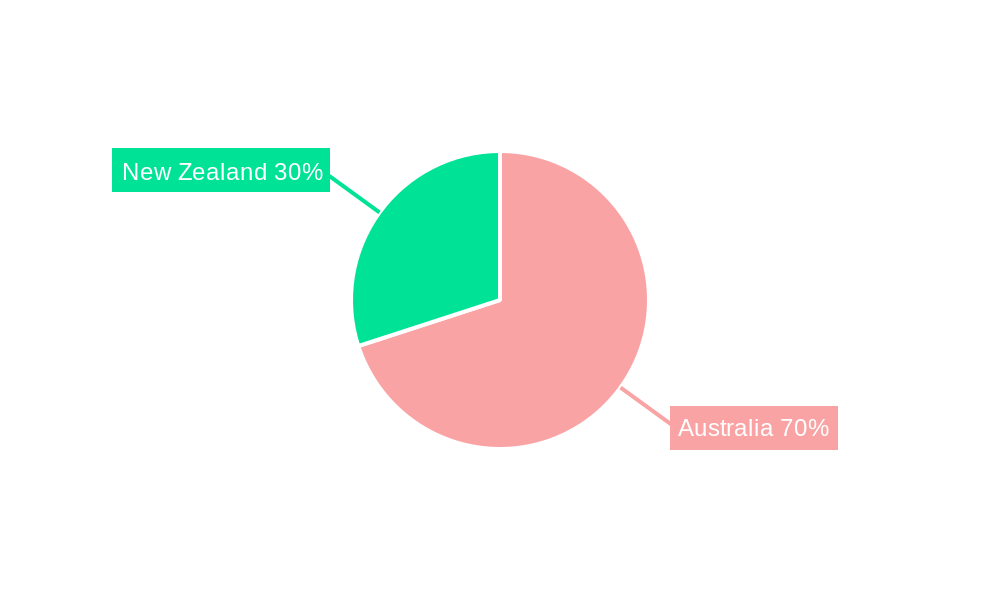
Dominant Regions, Countries, or Segments in Australia & New Zealand Water Treatment Chemicals Industry
The market is geographically diverse, with significant contributions from both Australia and New Zealand. However, Australia holds a larger market share due to its larger economy and higher industrial activity. Within product types, coagulants and flocculants dominate, followed by biocides and disinfectants. The municipal sector constitutes the largest end-user segment, driven by government investments in water infrastructure upgrades and expansion.
- Leading Regions: New South Wales (Australia) and Auckland (New Zealand) are key regional markets.
- Dominant Product Type: Coagulants and flocculants hold the largest market share (xx%), followed by biocides and disinfectants (xx%).
- Largest End-User Segment: Municipal water treatment accounts for the largest share (xx%), followed by Mining and Mineral Processing (xx%).
- Key Drivers: Stringent water quality regulations, increasing industrial activity, and investments in water infrastructure are key growth catalysts.
Australia & New Zealand Water Treatment Chemicals Industry Product Landscape
The market offers a wide range of water treatment chemicals tailored to specific applications and end-user needs. Product innovations focus on enhancing efficiency, reducing environmental impact, and improving performance. Key advancements include the development of bio-based coagulants, enhanced biocides with reduced toxicity, and intelligent dosing systems for optimized chemical usage. Unique selling propositions often center on superior performance, environmental sustainability, and cost-effectiveness.
Key Drivers, Barriers & Challenges in Australia & New Zealand Water Treatment Chemicals Industry
Key Drivers:
- Increasing industrialization and urbanization leading to higher water demand and stricter regulations.
- Government initiatives promoting sustainable water management and infrastructure development.
- Growing awareness of water scarcity and the need for efficient water treatment technologies.
Key Challenges & Restraints:
- Fluctuating raw material prices and supply chain disruptions impacting profitability.
- Stringent environmental regulations and compliance costs.
- Intense competition from both domestic and international players.
Emerging Opportunities in Australia & New Zealand Water Treatment Chemicals Industry
- Growing demand for advanced oxidation processes (AOPs) and membrane filtration technologies.
- Increasing adoption of smart water management systems and IoT-enabled solutions.
- Opportunities in niche markets such as desalination and wastewater reuse.
Growth Accelerators in the Australia & New Zealand Water Treatment Chemicals Industry
Technological advancements, strategic partnerships, and expansion into untapped markets are key growth catalysts for the water treatment chemicals industry in Australia and New Zealand. Government initiatives supporting water infrastructure development and sustainable water management practices further fuel market expansion.
Key Players Shaping the Australia & New Zealand Water Treatment Chemicals Industry Market
- Kemira Oyj
- Coogee
- Ecolab
- SNF
- IWTS Group Pty Ltd
- Solvay
- Buckman
- Aquasol
- Dow
- Solenis
- Ixom
- Albemarle Corporation
- Veolia (Veolia Water Technologies)
Notable Milestones in Australia & New Zealand Water Treatment Chemicals Industry Sector
- 2020: Introduction of new, eco-friendly coagulant by Kemira Oyj.
- 2021: Merger between two smaller Australian water treatment chemical companies.
- 2022: Launch of advanced oxidation process (AOP) technology by Ecolab.
- 2023: Government investment in water infrastructure upgrades announced in Australia.
In-Depth Australia & New Zealand Water Treatment Chemicals Industry Market Outlook
The Australia & New Zealand water treatment chemicals market is poised for continued growth driven by sustained industrialization, urbanization, and a growing focus on sustainable water management. Strategic partnerships, technological innovation, and expansion into niche applications will be crucial for success in this dynamic market. The long-term outlook is positive, with significant opportunities for both established players and new entrants.
Australia & New Zealand Water Treatment Chemicals Industry Segmentation
-
1. Product Type
- 1.1. Biocides and Disinfectants
- 1.2. Coagulants and Flocculants
- 1.3. Corrosion and Scale Inhibitors
- 1.4. Defoamers and Defoaming Agents
- 1.5. pH Conditioners/Adjusters
- 1.6. Other Product Types
-
2. End-user Industry
- 2.1. Power Generation
- 2.2. Oil and Gas
- 2.3. Chemical Manufacturing
- 2.4. Mining and Mineral Processing
- 2.5. Municipal
- 2.6. Food and Beverage
- 2.7. Pulp and Paper
- 2.8. Other End-user Industries
Australia & New Zealand Water Treatment Chemicals Industry Segmentation By Geography
- 1. Australia
Australia & New Zealand Water Treatment Chemicals Industry Regional Market Share
Geographic Coverage of Australia & New Zealand Water Treatment Chemicals Industry
Australia & New Zealand Water Treatment Chemicals Industry REPORT HIGHLIGHTS
| Aspects | Details |
|---|---|
| Study Period | 2020-2034 |
| Base Year | 2025 |
| Estimated Year | 2026 |
| Forecast Period | 2026-2034 |
| Historical Period | 2020-2025 |
| Growth Rate | CAGR of 5.6% from 2020-2034 |
| Segmentation |
|
Table of Contents
- 1. Introduction
- 1.1. Research Scope
- 1.2. Market Segmentation
- 1.3. Research Objective
- 1.4. Definitions and Assumptions
- 2. Executive Summary
- 2.1. Market Snapshot
- 3. Market Dynamics
- 3.1. Market Drivers
- 3.2. Market Restrains
- 3.3. Market Trends
- 3.4. Market Opportunities
- 4. Market Factor Analysis
- 4.1. Porters Five Forces
- 4.1.1. Bargaining Power of Suppliers
- 4.1.2. Bargaining Power of Buyers
- 4.1.3. Threat of New Entrants
- 4.1.4. Threat of Substitutes
- 4.1.5. Competitive Rivalry
- 4.2. PESTEL analysis
- 4.3. BCG Analysis
- 4.3.1. Stars (High Growth, High Market Share)
- 4.3.2. Cash Cows (Low Growth, High Market Share)
- 4.3.3. Question Mark (High Growth, Low Market Share)
- 4.3.4. Dogs (Low Growth, Low Market Share)
- 4.4. Ansoff Matrix Analysis
- 4.5. Supply Chain Analysis
- 4.6. Regulatory Landscape
- 4.7. Current Market Potential and Opportunity Assessment (TAM–SAM–SOM Framework)
- 4.8. NRP Analyst Note
- 4.1. Porters Five Forces
- 5. Market Analysis, Insights and Forecast 2021-2033
- 5.1. Market Analysis, Insights and Forecast - by Product Type
- 5.1.1. Biocides and Disinfectants
- 5.1.2. Coagulants and Flocculants
- 5.1.3. Corrosion and Scale Inhibitors
- 5.1.4. Defoamers and Defoaming Agents
- 5.1.5. pH Conditioners/Adjusters
- 5.1.6. Other Product Types
- 5.2. Market Analysis, Insights and Forecast - by End-user Industry
- 5.2.1. Power Generation
- 5.2.2. Oil and Gas
- 5.2.3. Chemical Manufacturing
- 5.2.4. Mining and Mineral Processing
- 5.2.5. Municipal
- 5.2.6. Food and Beverage
- 5.2.7. Pulp and Paper
- 5.2.8. Other End-user Industries
- 5.3. Market Analysis, Insights and Forecast - by Region
- 5.3.1. Australia
- 5.1. Market Analysis, Insights and Forecast - by Product Type
- 6. Australia & New Zealand Water Treatment Chemicals Industry Analysis, Insights and Forecast, 2021-2033
- 6.1. Market Analysis, Insights and Forecast - by Product Type
- 6.1.1. Biocides and Disinfectants
- 6.1.2. Coagulants and Flocculants
- 6.1.3. Corrosion and Scale Inhibitors
- 6.1.4. Defoamers and Defoaming Agents
- 6.1.5. pH Conditioners/Adjusters
- 6.1.6. Other Product Types
- 6.2. Market Analysis, Insights and Forecast - by End-user Industry
- 6.2.1. Power Generation
- 6.2.2. Oil and Gas
- 6.2.3. Chemical Manufacturing
- 6.2.4. Mining and Mineral Processing
- 6.2.5. Municipal
- 6.2.6. Food and Beverage
- 6.2.7. Pulp and Paper
- 6.2.8. Other End-user Industries
- 6.1. Market Analysis, Insights and Forecast - by Product Type
- 7. Competitive Analysis
- 7.1. Company Profiles
- 7.1.1 Kemira Oyj
- 7.1.1.1. Company Overview
- 7.1.1.2. Products
- 7.1.1.3. Company Financials
- 7.1.1.4. SWOT Analysis
- 7.1.2 Coogee
- 7.1.2.1. Company Overview
- 7.1.2.2. Products
- 7.1.2.3. Company Financials
- 7.1.2.4. SWOT Analysis
- 7.1.3 Ecolab
- 7.1.3.1. Company Overview
- 7.1.3.2. Products
- 7.1.3.3. Company Financials
- 7.1.3.4. SWOT Analysis
- 7.1.4 SNF
- 7.1.4.1. Company Overview
- 7.1.4.2. Products
- 7.1.4.3. Company Financials
- 7.1.4.4. SWOT Analysis
- 7.1.5 IWTS Group Pty Ltd
- 7.1.5.1. Company Overview
- 7.1.5.2. Products
- 7.1.5.3. Company Financials
- 7.1.5.4. SWOT Analysis
- 7.1.6 Solvay
- 7.1.6.1. Company Overview
- 7.1.6.2. Products
- 7.1.6.3. Company Financials
- 7.1.6.4. SWOT Analysis
- 7.1.7 Buckman
- 7.1.7.1. Company Overview
- 7.1.7.2. Products
- 7.1.7.3. Company Financials
- 7.1.7.4. SWOT Analysis
- 7.1.8 Aquasol
- 7.1.8.1. Company Overview
- 7.1.8.2. Products
- 7.1.8.3. Company Financials
- 7.1.8.4. SWOT Analysis
- 7.1.9 Dow
- 7.1.9.1. Company Overview
- 7.1.9.2. Products
- 7.1.9.3. Company Financials
- 7.1.9.4. SWOT Analysis
- 7.1.10 Solenis
- 7.1.10.1. Company Overview
- 7.1.10.2. Products
- 7.1.10.3. Company Financials
- 7.1.10.4. SWOT Analysis
- 7.1.11 Ixom
- 7.1.11.1. Company Overview
- 7.1.11.2. Products
- 7.1.11.3. Company Financials
- 7.1.11.4. SWOT Analysis
- 7.1.12 Albemarle Corporation
- 7.1.12.1. Company Overview
- 7.1.12.2. Products
- 7.1.12.3. Company Financials
- 7.1.12.4. SWOT Analysis
- 7.1.13 Veolia (Veolia Water Technologies)
- 7.1.13.1. Company Overview
- 7.1.13.2. Products
- 7.1.13.3. Company Financials
- 7.1.13.4. SWOT Analysis
- 7.1.1 Kemira Oyj
- 7.2. Market Entropy
- 7.2.1 Company's Key Areas Served
- 7.2.2 Recent Developments
- 7.3. Company Market Share Analysis 2025
- 7.3.1 Top 5 Companies Market Share Analysis
- 7.3.2 Top 3 Companies Market Share Analysis
- 7.4. List of Potential Customers
- 8. Research Methodology
List of Figures
- Figure 1: Australia & New Zealand Water Treatment Chemicals Industry Revenue Breakdown (billion, %) by Product 2025 & 2033
- Figure 2: Australia & New Zealand Water Treatment Chemicals Industry Share (%) by Company 2025
List of Tables
- Table 1: Australia & New Zealand Water Treatment Chemicals Industry Revenue billion Forecast, by Product Type 2020 & 2033
- Table 2: Australia & New Zealand Water Treatment Chemicals Industry Volume K Tons Forecast, by Product Type 2020 & 2033
- Table 3: Australia & New Zealand Water Treatment Chemicals Industry Revenue billion Forecast, by End-user Industry 2020 & 2033
- Table 4: Australia & New Zealand Water Treatment Chemicals Industry Volume K Tons Forecast, by End-user Industry 2020 & 2033
- Table 5: Australia & New Zealand Water Treatment Chemicals Industry Revenue billion Forecast, by Region 2020 & 2033
- Table 6: Australia & New Zealand Water Treatment Chemicals Industry Volume K Tons Forecast, by Region 2020 & 2033
- Table 7: Australia & New Zealand Water Treatment Chemicals Industry Revenue billion Forecast, by Product Type 2020 & 2033
- Table 8: Australia & New Zealand Water Treatment Chemicals Industry Volume K Tons Forecast, by Product Type 2020 & 2033
- Table 9: Australia & New Zealand Water Treatment Chemicals Industry Revenue billion Forecast, by End-user Industry 2020 & 2033
- Table 10: Australia & New Zealand Water Treatment Chemicals Industry Volume K Tons Forecast, by End-user Industry 2020 & 2033
- Table 11: Australia & New Zealand Water Treatment Chemicals Industry Revenue billion Forecast, by Country 2020 & 2033
- Table 12: Australia & New Zealand Water Treatment Chemicals Industry Volume K Tons Forecast, by Country 2020 & 2033
Frequently Asked Questions
1. What is the projected Compound Annual Growth Rate (CAGR) of the Australia & New Zealand Water Treatment Chemicals Industry?
The projected CAGR is approximately 5.6%.
2. Which companies are prominent players in the Australia & New Zealand Water Treatment Chemicals Industry?
Key companies in the market include Kemira Oyj, Coogee, Ecolab, SNF, IWTS Group Pty Ltd, Solvay, Buckman, Aquasol, Dow, Solenis, Ixom, Albemarle Corporation, Veolia (Veolia Water Technologies).
3. What are the main segments of the Australia & New Zealand Water Treatment Chemicals Industry?
The market segments include Product Type, End-user Industry.
4. Can you provide details about the market size?
The market size is estimated to be USD 1.1 billion as of 2022.
5. What are some drivers contributing to market growth?
Rising Groundwater and Surface Water Pollution; Growing Demand From Power and Industrial Applications; Increasing Government Intervention in Reliable Wastewater Management; Substitution of Other Polyethylene Products.
6. What are the notable trends driving market growth?
Municipal End-user Industry to Dominate the Market.
7. Are there any restraints impacting market growth?
Hazardous Nature of Hydrazine; Emerging Alternatives to Water Treatment Chemicals.
8. Can you provide examples of recent developments in the market?
N/A
9. What pricing options are available for accessing the report?
Pricing options include single-user, multi-user, and enterprise licenses priced at USD 3,950, USD 4,950, and USD 6,950 respectively.
10. Is the market size provided in terms of value or volume?
The market size is provided in terms of value, measured in billion and volume, measured in K Tons.
11. Are there any specific market keywords associated with the report?
Yes, the market keyword associated with the report is "Australia & New Zealand Water Treatment Chemicals Industry," which aids in identifying and referencing the specific market segment covered.
12. How do I determine which pricing option suits my needs best?
The pricing options vary based on user requirements and access needs. Individual users may opt for single-user licenses, while businesses requiring broader access may choose multi-user or enterprise licenses for cost-effective access to the report.
13. Are there any additional resources or data provided in the Australia & New Zealand Water Treatment Chemicals Industry report?
While the report offers comprehensive insights, it's advisable to review the specific contents or supplementary materials provided to ascertain if additional resources or data are available.
14. How can I stay updated on further developments or reports in the Australia & New Zealand Water Treatment Chemicals Industry?
To stay informed about further developments, trends, and reports in the Australia & New Zealand Water Treatment Chemicals Industry, consider subscribing to industry newsletters, following relevant companies and organizations, or regularly checking reputable industry news sources and publications.
Methodology
Step 1 - Identification of Relevant Samples Size from Population Database


Step 2 - Approaches for Defining Global Market Size (Value, Volume* & Price*)

Note*: In applicable scenarios
Step 3 - Data Sources
Primary Research
- Web Analytics
- Survey Reports
- Research Institute
- Latest Research Reports
- Opinion Leaders
Secondary Research
- Annual Reports
- White Paper
- Latest Press Release
- Industry Association
- Paid Database
- Investor Presentations

Step 4 - Data Triangulation
Involves using different sources of information in order to increase the validity of a study
These sources are likely to be stakeholders in a program - participants, other researchers, program staff, other community members, and so on.
Then we put all data in single framework & apply various statistical tools to find out the dynamic on the market.
During the analysis stage, feedback from the stakeholder groups would be compared to determine areas of agreement as well as areas of divergence