

Key Insights
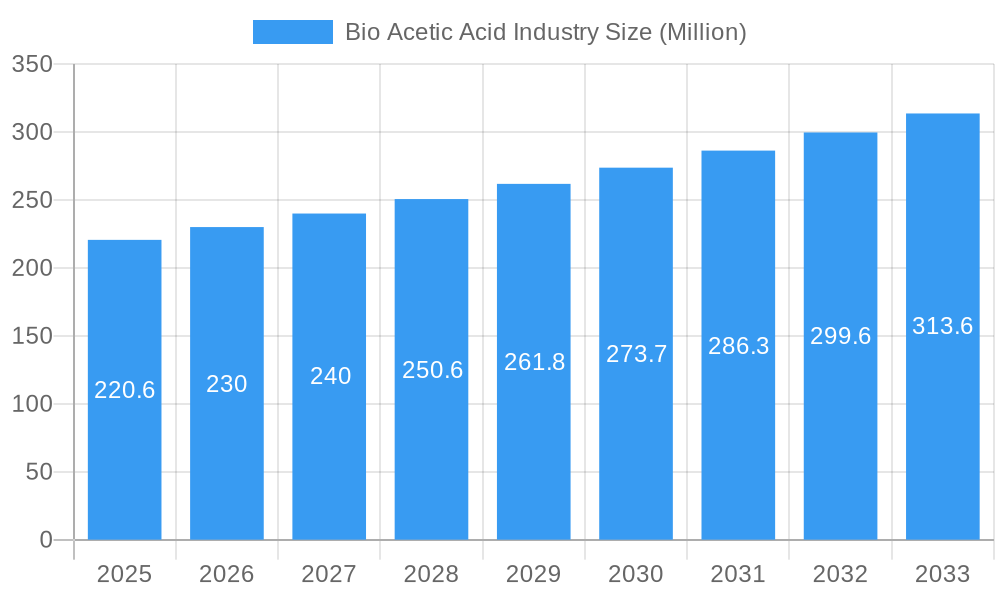
The global bio-acetic acid market, valued at $220.6 million in 2025, is projected to experience robust growth, driven by a Compound Annual Growth Rate (CAGR) exceeding 4.00% from 2025 to 2033. This expansion is fueled by several key factors. Firstly, the increasing demand for sustainable and environmentally friendly alternatives to petrochemical-based acetic acid is significantly boosting the adoption of bio-acetic acid across various applications. The growing awareness of the environmental impact of traditional production methods, coupled with stringent regulations concerning greenhouse gas emissions, further strengthens the market's growth trajectory. Secondly, advancements in biotechnology and fermentation technologies are leading to more efficient and cost-effective bio-acetic acid production processes, making it a more competitive option compared to its conventional counterpart. The diverse applications of bio-acetic acid, spanning from the production of vinyl acetate monomer (VAM) and acetate esters to purified terephthalic acid (PTA) and acetic anhydride, further contribute to market expansion. Key players like AFYREN SA, Sucroal SA, and Cargill Incorporated are actively investing in research and development, along with strategic partnerships, to enhance production capacities and explore new market opportunities. Regional growth is expected to vary, with Asia-Pacific, particularly China and India, anticipated to lead the charge due to rapid industrialization and increasing demand.
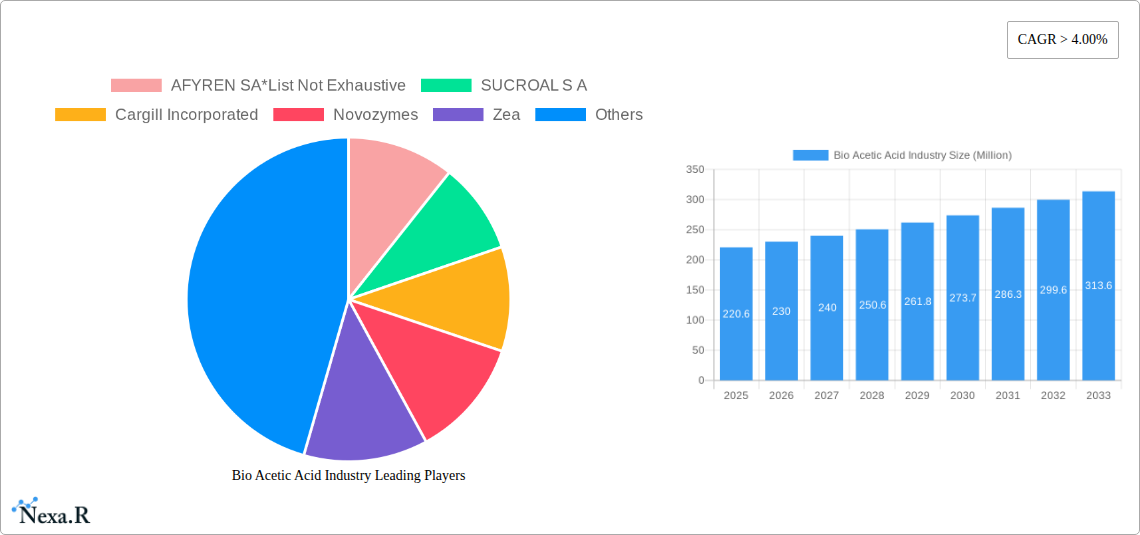
Bio Acetic Acid Industry Market Size (In Million)
The market segmentation reveals a significant share attributed to the use of biomass as a raw material, reflecting the commitment to sustainable practices. However, the corn and maize segments are also witnessing substantial growth owing to their abundance and suitability for bio-acetic acid production. While the market faces challenges such as potential fluctuations in raw material prices and competition from established petrochemical-based acetic acid producers, the long-term outlook remains positive. The continued focus on sustainability, technological advancements, and increasing government support for bio-based products are expected to mitigate these challenges and fuel consistent market growth throughout the forecast period. The strategic expansions and acquisitions by key players will play a vital role in shaping the competitive landscape and driving innovation within the bio-acetic acid market.
Bio Acetic Acid Industry Company Market Share
Bio Acetic Acid Industry Market Report: 2019-2033
This comprehensive report provides an in-depth analysis of the global bio acetic acid industry, offering invaluable insights for industry professionals, investors, and strategic decision-makers. The study covers the period 2019-2033, with a focus on the forecast period 2025-2033 and a base year of 2025. This report meticulously analyzes market dynamics, growth trends, key players, and emerging opportunities within the parent market of bio-based chemicals and the child market of bio-derived acids. Expect detailed breakdowns by raw material (Biomass, Corn, Maize, Sugar, Other Raw Materials) and application (Vinyl Acetate Monomer (VAM), Acetate Esters, Purified Terephthalic Acid (PTA), Acetic Anhydride, Other Applications). Market values are presented in million units.
Bio Acetic Acid Industry Market Dynamics & Structure
The bio acetic acid market is characterized by a moderately consolidated structure, with leading companies actively pursuing growth through continuous innovation, strategic alliances, and capacity expansions. A primary driver for market expansion is the rapid advancement in biotechnology, particularly in optimizing fermentation processes and enhancing the efficiency of biomass conversion. Increasingly stringent global environmental regulations are significantly propelling the adoption of bio-based acetic acid as a sustainable alternative to traditional petrochemical-derived products. The availability and cost-effectiveness of renewable feedstocks, such as corn, sugarcane, and lignocellulosic biomass, play a crucial role in influencing production economics and market competitiveness. Intense competition from established petrochemical acetic acid producers and the emergence of substitute materials necessitate ongoing research and development efforts to maintain and improve market position. While merger and acquisition (M&A) activity has been moderate in recent years (estimated to be around xx deals between 2019-2024), the trend is anticipated to gain momentum as companies seek to achieve economies of scale, acquire cutting-edge technologies, and broaden their product portfolios to capture a larger market share.
- Market Concentration: Moderately Consolidated, with the top 5 players collectively holding approximately xx% of the global market share in 2024.
- Technological Innovation: Ongoing focus on enhancing fermentation efficiency, developing novel biocatalysts, reducing overall production costs, and exploring new application areas for bio acetic acid.
- Regulatory Landscape: A robust framework of environmental regulations worldwide is a significant catalyst, driving demand for sustainable and environmentally friendly bio-based chemicals.
- Competitive Landscape: Petrochemical-derived acetic acid remains the primary competitor, necessitating continuous differentiation through sustainability and performance advantages.
- End-User Segmentation: The market primarily serves industrial consumers across diverse sectors, including the chemical, textile, food and beverage, pharmaceutical, and agricultural industries.
- M&A Trends: Future consolidation is projected to accelerate, with strategic acquisitions targeting companies with advanced technological capabilities, established supply chains, and significant market reach.
Bio Acetic Acid Industry Growth Trends & Insights
The global bio acetic acid market is experiencing robust growth, fueled by increasing environmental concerns and government support for bio-based products. The market size is projected to reach xx million units by 2025 and xx million units by 2033, exhibiting a CAGR of xx% during the forecast period. This growth is driven by factors such as the rising demand for sustainable chemicals, advancements in biotechnology, and increasing applications in various industries. Consumer preference for environmentally friendly products and government initiatives promoting bio-based industries further contribute to market expansion. Technological disruptions, such as the development of more efficient and cost-effective production processes, are accelerating market penetration.
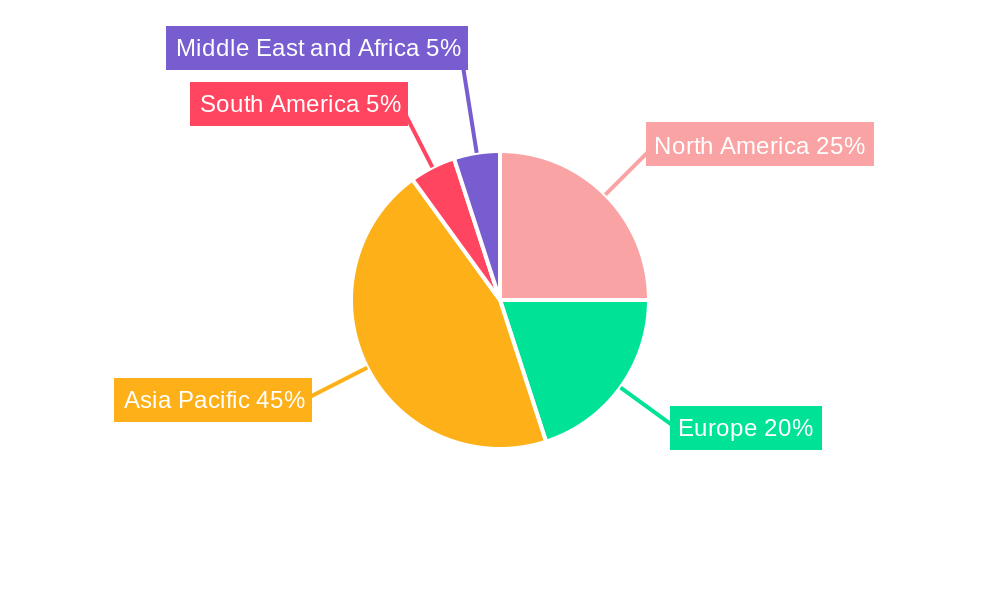
Dominant Regions, Countries, or Segments in Bio Acetic Acid Industry
North America and Europe currently lead the global bio acetic acid market in terms of production volume and consumption, largely attributed to their well-established bio-refinery infrastructure, supportive governmental policies, and strong emphasis on sustainability. However, the Asia-Pacific region is poised for substantial growth in the coming years, fueled by escalating demand, particularly in emerging economies like China and India, driven by industrial expansion and increasing environmental consciousness. Within specific application segments, the production of Vinyl Acetate Monomer (VAM) remains the dominant end-use, accounting for an estimated xx% of the total bio acetic acid market in 2024. The utilization of various forms of biomass as a raw material is increasingly gaining traction due to its inherent sustainability advantages and potential for carbon neutrality. While advanced lignocellulosic feedstocks are being explored, corn and sugarcane continue to be the most prevalent and economically viable sources for bio acetic acid production.
-
Key Growth Enablers:
- Significant government incentives, subsidies, and grants supporting the development of bio-based industries and sustainable manufacturing practices.
- Growing consumer and corporate demand for eco-friendly and biodegradable products, driving market penetration of bio-based chemicals.
- Continuous advancements in fermentation technologies, biocatalysis, and downstream processing techniques leading to higher yields and improved product quality.
- Robust and expanding demand for bio-based chemicals across a wide spectrum of industrial applications, including plastics, coatings, adhesives, and pharmaceuticals.
-
Factors Driving Regional Dominance:
- Mature and extensive bio-refinery infrastructure and supply chains in North America and Europe.
- Proactive and supportive government policies, regulatory frameworks, and research funding initiatives encouraging bio-based manufacturing.
- High consumption levels from key downstream industries such as the chemical manufacturing, textile production, and packaging sectors.
Bio Acetic Acid Industry Product Landscape
Bio acetic acid products are distinguished by their high levels of purity and their significantly reduced environmental footprint compared to their petrochemical-derived counterparts. The industry's innovation efforts are primarily directed towards enhancing fermentation efficiency, optimizing production economics, and broadening the spectrum of applications. Key unique selling propositions (USPs) of bio acetic acid include its lower carbon footprint, inherent biodegradability, and its compliance with increasingly stringent international environmental standards and sustainability certifications. Recent technological breakthroughs have seen the development of highly specialized yeast strains engineered for superior acetic acid production efficiency and the integration of advanced bioprocessing technologies to achieve higher yields, enhanced purity, and more sustainable production cycles.
Key Drivers, Barriers & Challenges in Bio Acetic Acid Industry
Key Drivers:
- The escalating global demand for sustainable, biodegradable, and environmentally friendly chemical products across various industries.
- Supportive government policies, regulations, and incentives that actively promote the adoption and production of bio-based alternatives.
- Continuous technological advancements and breakthroughs leading to more cost-effective and efficient production methods for bio acetic acid.
- Increasing investments in the development and expansion of bio-refineries and the associated infrastructure required for large-scale bio-based chemical production.
Key Challenges:
- Persistent and strong competition from the established and cost-competitive petrochemical-based acetic acid market.
- The substantial initial capital investment required for setting up bio-based production facilities, which can be a significant barrier to entry.
- Volatility in the prices of key raw materials, such as corn, sugar, and other biomass feedstocks, which can impact production costs and profitability.
- The significant challenge of effectively scaling up production processes to meet the rapidly growing global demand, with an estimated xx% of producers facing scaling-related hurdles in 2024.
Emerging Opportunities in Bio Acetic Acid Industry
- Expansion into new applications, such as bioplastics and biofuels.
- Development of innovative production processes using diverse feedstocks.
- Penetration into emerging markets with growing demand for sustainable chemicals.
- Strategic partnerships and collaborations to enhance market reach and technological capabilities.
Growth Accelerators in the Bio Acetic Acid Industry
Technological breakthroughs in fermentation and downstream processing, coupled with strategic partnerships and mergers & acquisitions, are key growth accelerators. Market expansion into untapped regions and the development of innovative applications are also pivotal. Government support and incentives for bio-based industries further fuel long-term growth.
Notable Milestones in Bio Acetic Acid Industry Sector
- July 2022: Novozymes, a global leader in industrial enzymes and microorganisms, launched Innova Apex and Innova Turbo, advanced yeast solutions designed to significantly enhance ethanol production efficiency, a key precursor for some bio acetic acid production pathways.
- February 2022: The Government of India proposed a reduction in customs duties on Methanol, Acetic Acid, and critical heavy feedstocks. This strategic move aims to foster domestic value addition, bolster the competitiveness of Indian manufacturers, and potentially stimulate the growth of the bio acetic acid sector within the country.
In-Depth Bio Acetic Acid Industry Market Outlook
The bio acetic acid market holds significant future potential, driven by the increasing global demand for sustainable alternatives. Strategic investments in research and development, coupled with strategic partnerships and expansion into new markets, will be crucial for success. The focus on improving production efficiency and reducing costs will remain central to sustaining long-term growth and market competitiveness.
Bio Acetic Acid Industry Segmentation
-
1. Raw Material
- 1.1. Biomass
- 1.2. Corn
- 1.3. Maize
- 1.4. Sugar
- 1.5. Other Raw Materials
-
2. Application
- 2.1. Vinyl Acetate Monomer (VAM)
- 2.2. Acetate Esters
- 2.3. Purified Terephthalic Acid (PTA)
- 2.4. Acetic Anhydride
- 2.5. Other Applications
Bio Acetic Acid Industry Segmentation By Geography
-
1. Asia Pacific
- 1.1. China
- 1.2. India
- 1.3. Japan
- 1.4. South Korea
- 1.5. Malaysia
- 1.6. Thailand
- 1.7. Indonesia
- 1.8. Vietnam
- 1.9. Rest of Asia Pacific
-
2. North America
- 2.1. United States
- 2.2. Canada
- 2.3. Mexico
-
3. Europe
- 3.1. Germany
- 3.2. United Kingdom
- 3.3. Italy
- 3.4. France
- 3.5. Spain
- 3.6. NORDIC Countries
- 3.7. Turkey
- 3.8. Russia
- 3.9. Rest of Europe
-
4. South America
- 4.1. Brazil
- 4.2. Argentina
- 4.3. Colombia
- 4.4. Rest of South America
-
5. Middle East and Africa
- 5.1. Qatar
- 5.2. United Arab Emirates
- 5.3. Nigeria
- 5.4. Egypt
- 5.5. South Africa
- 5.6. Rest of Middle East and Africa
-
6. Middle East and Africa
- 6.1. Saudi Arabia
- 6.2. South Africa
- 6.3. Rest of Middle East and Africa
Bio Acetic Acid Industry Regional Market Share
Geographic Coverage of Bio Acetic Acid Industry
Bio Acetic Acid Industry REPORT HIGHLIGHTS
| Aspects | Details |
|---|---|
| Study Period | 2020-2034 |
| Base Year | 2025 |
| Estimated Year | 2026 |
| Forecast Period | 2026-2034 |
| Historical Period | 2020-2025 |
| Growth Rate | CAGR of > 4.00% from 2020-2034 |
| Segmentation |
|
Table of Contents
- 1. Introduction
- 1.1. Research Scope
- 1.2. Market Segmentation
- 1.3. Research Objective
- 1.4. Definitions and Assumptions
- 2. Executive Summary
- 2.1. Market Snapshot
- 3. Market Dynamics
- 3.1. Market Drivers
- 3.2. Market Restrains
- 3.3. Market Trends
- 3.4. Market Opportunities
- 4. Market Factor Analysis
- 4.1. Porters Five Forces
- 4.1.1. Bargaining Power of Suppliers
- 4.1.2. Bargaining Power of Buyers
- 4.1.3. Threat of New Entrants
- 4.1.4. Threat of Substitutes
- 4.1.5. Competitive Rivalry
- 4.2. PESTEL analysis
- 4.3. BCG Analysis
- 4.3.1. Stars (High Growth, High Market Share)
- 4.3.2. Cash Cows (Low Growth, High Market Share)
- 4.3.3. Question Mark (High Growth, Low Market Share)
- 4.3.4. Dogs (Low Growth, Low Market Share)
- 4.4. Ansoff Matrix Analysis
- 4.5. Supply Chain Analysis
- 4.6. Regulatory Landscape
- 4.7. Current Market Potential and Opportunity Assessment (TAM–SAM–SOM Framework)
- 4.8. NRP Analyst Note
- 4.1. Porters Five Forces
- 5. Market Analysis, Insights and Forecast 2021-2033
- 5.1. Market Analysis, Insights and Forecast - by Raw Material
- 5.1.1. Biomass
- 5.1.2. Corn
- 5.1.3. Maize
- 5.1.4. Sugar
- 5.1.5. Other Raw Materials
- 5.2. Market Analysis, Insights and Forecast - by Application
- 5.2.1. Vinyl Acetate Monomer (VAM)
- 5.2.2. Acetate Esters
- 5.2.3. Purified Terephthalic Acid (PTA)
- 5.2.4. Acetic Anhydride
- 5.2.5. Other Applications
- 5.3. Market Analysis, Insights and Forecast - by Region
- 5.3.1. Asia Pacific
- 5.3.2. North America
- 5.3.3. Europe
- 5.3.4. South America
- 5.3.5. Middle East and Africa
- 5.3.6. Middle East and Africa
- 5.1. Market Analysis, Insights and Forecast - by Raw Material
- 6. Global Bio Acetic Acid Industry Analysis, Insights and Forecast, 2021-2033
- 6.1. Market Analysis, Insights and Forecast - by Raw Material
- 6.1.1. Biomass
- 6.1.2. Corn
- 6.1.3. Maize
- 6.1.4. Sugar
- 6.1.5. Other Raw Materials
- 6.2. Market Analysis, Insights and Forecast - by Application
- 6.2.1. Vinyl Acetate Monomer (VAM)
- 6.2.2. Acetate Esters
- 6.2.3. Purified Terephthalic Acid (PTA)
- 6.2.4. Acetic Anhydride
- 6.2.5. Other Applications
- 6.1. Market Analysis, Insights and Forecast - by Raw Material
- 7. Asia Pacific Bio Acetic Acid Industry Analysis, Insights and Forecast, 2020-2032
- 7.1. Market Analysis, Insights and Forecast - by Raw Material
- 7.1.1. Biomass
- 7.1.2. Corn
- 7.1.3. Maize
- 7.1.4. Sugar
- 7.1.5. Other Raw Materials
- 7.2. Market Analysis, Insights and Forecast - by Application
- 7.2.1. Vinyl Acetate Monomer (VAM)
- 7.2.2. Acetate Esters
- 7.2.3. Purified Terephthalic Acid (PTA)
- 7.2.4. Acetic Anhydride
- 7.2.5. Other Applications
- 7.1. Market Analysis, Insights and Forecast - by Raw Material
- 8. North America Bio Acetic Acid Industry Analysis, Insights and Forecast, 2020-2032
- 8.1. Market Analysis, Insights and Forecast - by Raw Material
- 8.1.1. Biomass
- 8.1.2. Corn
- 8.1.3. Maize
- 8.1.4. Sugar
- 8.1.5. Other Raw Materials
- 8.2. Market Analysis, Insights and Forecast - by Application
- 8.2.1. Vinyl Acetate Monomer (VAM)
- 8.2.2. Acetate Esters
- 8.2.3. Purified Terephthalic Acid (PTA)
- 8.2.4. Acetic Anhydride
- 8.2.5. Other Applications
- 8.1. Market Analysis, Insights and Forecast - by Raw Material
- 9. Europe Bio Acetic Acid Industry Analysis, Insights and Forecast, 2020-2032
- 9.1. Market Analysis, Insights and Forecast - by Raw Material
- 9.1.1. Biomass
- 9.1.2. Corn
- 9.1.3. Maize
- 9.1.4. Sugar
- 9.1.5. Other Raw Materials
- 9.2. Market Analysis, Insights and Forecast - by Application
- 9.2.1. Vinyl Acetate Monomer (VAM)
- 9.2.2. Acetate Esters
- 9.2.3. Purified Terephthalic Acid (PTA)
- 9.2.4. Acetic Anhydride
- 9.2.5. Other Applications
- 9.1. Market Analysis, Insights and Forecast - by Raw Material
- 10. South America Bio Acetic Acid Industry Analysis, Insights and Forecast, 2020-2032
- 10.1. Market Analysis, Insights and Forecast - by Raw Material
- 10.1.1. Biomass
- 10.1.2. Corn
- 10.1.3. Maize
- 10.1.4. Sugar
- 10.1.5. Other Raw Materials
- 10.2. Market Analysis, Insights and Forecast - by Application
- 10.2.1. Vinyl Acetate Monomer (VAM)
- 10.2.2. Acetate Esters
- 10.2.3. Purified Terephthalic Acid (PTA)
- 10.2.4. Acetic Anhydride
- 10.2.5. Other Applications
- 10.1. Market Analysis, Insights and Forecast - by Raw Material
- 11. Middle East and Africa Bio Acetic Acid Industry Analysis, Insights and Forecast, 2020-2032
- 11.1. Market Analysis, Insights and Forecast - by Raw Material
- 11.1.1. Biomass
- 11.1.2. Corn
- 11.1.3. Maize
- 11.1.4. Sugar
- 11.1.5. Other Raw Materials
- 11.2. Market Analysis, Insights and Forecast - by Application
- 11.2.1. Vinyl Acetate Monomer (VAM)
- 11.2.2. Acetate Esters
- 11.2.3. Purified Terephthalic Acid (PTA)
- 11.2.4. Acetic Anhydride
- 11.2.5. Other Applications
- 11.1. Market Analysis, Insights and Forecast - by Raw Material
- 12. Middle East and Africa Bio Acetic Acid Industry Analysis, Insights and Forecast, 2020-2032
- 12.1. Market Analysis, Insights and Forecast - by Raw Material
- 12.1.1. Biomass
- 12.1.2. Corn
- 12.1.3. Maize
- 12.1.4. Sugar
- 12.1.5. Other Raw Materials
- 12.2. Market Analysis, Insights and Forecast - by Application
- 12.2.1. Vinyl Acetate Monomer (VAM)
- 12.2.2. Acetate Esters
- 12.2.3. Purified Terephthalic Acid (PTA)
- 12.2.4. Acetic Anhydride
- 12.2.5. Other Applications
- 12.1. Market Analysis, Insights and Forecast - by Raw Material
- 13. Competitive Analysis
- 13.1. Company Profiles
- 13.1.1 AFYREN SA*List Not Exhaustive
- 13.1.1.1. Company Overview
- 13.1.1.2. Products
- 13.1.1.3. Company Financials
- 13.1.1.4. SWOT Analysis
- 13.1.2 SUCROAL S A
- 13.1.2.1. Company Overview
- 13.1.2.2. Products
- 13.1.2.3. Company Financials
- 13.1.2.4. SWOT Analysis
- 13.1.3 Cargill Incorporated
- 13.1.3.1. Company Overview
- 13.1.3.2. Products
- 13.1.3.3. Company Financials
- 13.1.3.4. SWOT Analysis
- 13.1.4 Novozymes
- 13.1.4.1. Company Overview
- 13.1.4.2. Products
- 13.1.4.3. Company Financials
- 13.1.4.4. SWOT Analysis
- 13.1.5 Zea
- 13.1.5.1. Company Overview
- 13.1.5.2. Products
- 13.1.5.3. Company Financials
- 13.1.5.4. SWOT Analysis
- 13.1.6 LanzaTech
- 13.1.6.1. Company Overview
- 13.1.6.2. Products
- 13.1.6.3. Company Financials
- 13.1.6.4. SWOT Analysis
- 13.1.7 GODAVARI BIOREFINERIES LTD
- 13.1.7.1. Company Overview
- 13.1.7.2. Products
- 13.1.7.3. Company Financials
- 13.1.7.4. SWOT Analysis
- 13.1.8 btgbioliquids
- 13.1.8.1. Company Overview
- 13.1.8.2. Products
- 13.1.8.3. Company Financials
- 13.1.8.4. SWOT Analysis
- 13.1.9 Airedale Chemical Company Limited
- 13.1.9.1. Company Overview
- 13.1.9.2. Products
- 13.1.9.3. Company Financials
- 13.1.9.4. SWOT Analysis
- 13.1.10 BASF SE
- 13.1.10.1. Company Overview
- 13.1.10.2. Products
- 13.1.10.3. Company Financials
- 13.1.10.4. SWOT Analysis
- 13.1.1 AFYREN SA*List Not Exhaustive
- 13.2. Market Entropy
- 13.2.1 Company's Key Areas Served
- 13.2.2 Recent Developments
- 13.3. Company Market Share Analysis 2025
- 13.3.1 Top 5 Companies Market Share Analysis
- 13.3.2 Top 3 Companies Market Share Analysis
- 13.4. List of Potential Customers
- 14. Research Methodology
List of Figures
- Figure 1: Global Bio Acetic Acid Industry Revenue Breakdown (Million, %) by Region 2025 & 2033
- Figure 2: Global Bio Acetic Acid Industry Volume Breakdown (K Tons, %) by Region 2025 & 2033
- Figure 3: Asia Pacific Bio Acetic Acid Industry Revenue (Million), by Raw Material 2025 & 2033
- Figure 4: Asia Pacific Bio Acetic Acid Industry Volume (K Tons), by Raw Material 2025 & 2033
- Figure 5: Asia Pacific Bio Acetic Acid Industry Revenue Share (%), by Raw Material 2025 & 2033
- Figure 6: Asia Pacific Bio Acetic Acid Industry Volume Share (%), by Raw Material 2025 & 2033
- Figure 7: Asia Pacific Bio Acetic Acid Industry Revenue (Million), by Application 2025 & 2033
- Figure 8: Asia Pacific Bio Acetic Acid Industry Volume (K Tons), by Application 2025 & 2033
- Figure 9: Asia Pacific Bio Acetic Acid Industry Revenue Share (%), by Application 2025 & 2033
- Figure 10: Asia Pacific Bio Acetic Acid Industry Volume Share (%), by Application 2025 & 2033
- Figure 11: Asia Pacific Bio Acetic Acid Industry Revenue (Million), by Country 2025 & 2033
- Figure 12: Asia Pacific Bio Acetic Acid Industry Volume (K Tons), by Country 2025 & 2033
- Figure 13: Asia Pacific Bio Acetic Acid Industry Revenue Share (%), by Country 2025 & 2033
- Figure 14: Asia Pacific Bio Acetic Acid Industry Volume Share (%), by Country 2025 & 2033
- Figure 15: North America Bio Acetic Acid Industry Revenue (Million), by Raw Material 2025 & 2033
- Figure 16: North America Bio Acetic Acid Industry Volume (K Tons), by Raw Material 2025 & 2033
- Figure 17: North America Bio Acetic Acid Industry Revenue Share (%), by Raw Material 2025 & 2033
- Figure 18: North America Bio Acetic Acid Industry Volume Share (%), by Raw Material 2025 & 2033
- Figure 19: North America Bio Acetic Acid Industry Revenue (Million), by Application 2025 & 2033
- Figure 20: North America Bio Acetic Acid Industry Volume (K Tons), by Application 2025 & 2033
- Figure 21: North America Bio Acetic Acid Industry Revenue Share (%), by Application 2025 & 2033
- Figure 22: North America Bio Acetic Acid Industry Volume Share (%), by Application 2025 & 2033
- Figure 23: North America Bio Acetic Acid Industry Revenue (Million), by Country 2025 & 2033
- Figure 24: North America Bio Acetic Acid Industry Volume (K Tons), by Country 2025 & 2033
- Figure 25: North America Bio Acetic Acid Industry Revenue Share (%), by Country 2025 & 2033
- Figure 26: North America Bio Acetic Acid Industry Volume Share (%), by Country 2025 & 2033
- Figure 27: Europe Bio Acetic Acid Industry Revenue (Million), by Raw Material 2025 & 2033
- Figure 28: Europe Bio Acetic Acid Industry Volume (K Tons), by Raw Material 2025 & 2033
- Figure 29: Europe Bio Acetic Acid Industry Revenue Share (%), by Raw Material 2025 & 2033
- Figure 30: Europe Bio Acetic Acid Industry Volume Share (%), by Raw Material 2025 & 2033
- Figure 31: Europe Bio Acetic Acid Industry Revenue (Million), by Application 2025 & 2033
- Figure 32: Europe Bio Acetic Acid Industry Volume (K Tons), by Application 2025 & 2033
- Figure 33: Europe Bio Acetic Acid Industry Revenue Share (%), by Application 2025 & 2033
- Figure 34: Europe Bio Acetic Acid Industry Volume Share (%), by Application 2025 & 2033
- Figure 35: Europe Bio Acetic Acid Industry Revenue (Million), by Country 2025 & 2033
- Figure 36: Europe Bio Acetic Acid Industry Volume (K Tons), by Country 2025 & 2033
- Figure 37: Europe Bio Acetic Acid Industry Revenue Share (%), by Country 2025 & 2033
- Figure 38: Europe Bio Acetic Acid Industry Volume Share (%), by Country 2025 & 2033
- Figure 39: South America Bio Acetic Acid Industry Revenue (Million), by Raw Material 2025 & 2033
- Figure 40: South America Bio Acetic Acid Industry Volume (K Tons), by Raw Material 2025 & 2033
- Figure 41: South America Bio Acetic Acid Industry Revenue Share (%), by Raw Material 2025 & 2033
- Figure 42: South America Bio Acetic Acid Industry Volume Share (%), by Raw Material 2025 & 2033
- Figure 43: South America Bio Acetic Acid Industry Revenue (Million), by Application 2025 & 2033
- Figure 44: South America Bio Acetic Acid Industry Volume (K Tons), by Application 2025 & 2033
- Figure 45: South America Bio Acetic Acid Industry Revenue Share (%), by Application 2025 & 2033
- Figure 46: South America Bio Acetic Acid Industry Volume Share (%), by Application 2025 & 2033
- Figure 47: South America Bio Acetic Acid Industry Revenue (Million), by Country 2025 & 2033
- Figure 48: South America Bio Acetic Acid Industry Volume (K Tons), by Country 2025 & 2033
- Figure 49: South America Bio Acetic Acid Industry Revenue Share (%), by Country 2025 & 2033
- Figure 50: South America Bio Acetic Acid Industry Volume Share (%), by Country 2025 & 2033
- Figure 51: Middle East and Africa Bio Acetic Acid Industry Revenue (Million), by Raw Material 2025 & 2033
- Figure 52: Middle East and Africa Bio Acetic Acid Industry Volume (K Tons), by Raw Material 2025 & 2033
- Figure 53: Middle East and Africa Bio Acetic Acid Industry Revenue Share (%), by Raw Material 2025 & 2033
- Figure 54: Middle East and Africa Bio Acetic Acid Industry Volume Share (%), by Raw Material 2025 & 2033
- Figure 55: Middle East and Africa Bio Acetic Acid Industry Revenue (Million), by Application 2025 & 2033
- Figure 56: Middle East and Africa Bio Acetic Acid Industry Volume (K Tons), by Application 2025 & 2033
- Figure 57: Middle East and Africa Bio Acetic Acid Industry Revenue Share (%), by Application 2025 & 2033
- Figure 58: Middle East and Africa Bio Acetic Acid Industry Volume Share (%), by Application 2025 & 2033
- Figure 59: Middle East and Africa Bio Acetic Acid Industry Revenue (Million), by Country 2025 & 2033
- Figure 60: Middle East and Africa Bio Acetic Acid Industry Volume (K Tons), by Country 2025 & 2033
- Figure 61: Middle East and Africa Bio Acetic Acid Industry Revenue Share (%), by Country 2025 & 2033
- Figure 62: Middle East and Africa Bio Acetic Acid Industry Volume Share (%), by Country 2025 & 2033
- Figure 63: Middle East and Africa Bio Acetic Acid Industry Revenue (Million), by Raw Material 2025 & 2033
- Figure 64: Middle East and Africa Bio Acetic Acid Industry Volume (K Tons), by Raw Material 2025 & 2033
- Figure 65: Middle East and Africa Bio Acetic Acid Industry Revenue Share (%), by Raw Material 2025 & 2033
- Figure 66: Middle East and Africa Bio Acetic Acid Industry Volume Share (%), by Raw Material 2025 & 2033
- Figure 67: Middle East and Africa Bio Acetic Acid Industry Revenue (Million), by Application 2025 & 2033
- Figure 68: Middle East and Africa Bio Acetic Acid Industry Volume (K Tons), by Application 2025 & 2033
- Figure 69: Middle East and Africa Bio Acetic Acid Industry Revenue Share (%), by Application 2025 & 2033
- Figure 70: Middle East and Africa Bio Acetic Acid Industry Volume Share (%), by Application 2025 & 2033
- Figure 71: Middle East and Africa Bio Acetic Acid Industry Revenue (Million), by Country 2025 & 2033
- Figure 72: Middle East and Africa Bio Acetic Acid Industry Volume (K Tons), by Country 2025 & 2033
- Figure 73: Middle East and Africa Bio Acetic Acid Industry Revenue Share (%), by Country 2025 & 2033
- Figure 74: Middle East and Africa Bio Acetic Acid Industry Volume Share (%), by Country 2025 & 2033
List of Tables
- Table 1: Global Bio Acetic Acid Industry Revenue Million Forecast, by Raw Material 2020 & 2033
- Table 2: Global Bio Acetic Acid Industry Volume K Tons Forecast, by Raw Material 2020 & 2033
- Table 3: Global Bio Acetic Acid Industry Revenue Million Forecast, by Application 2020 & 2033
- Table 4: Global Bio Acetic Acid Industry Volume K Tons Forecast, by Application 2020 & 2033
- Table 5: Global Bio Acetic Acid Industry Revenue Million Forecast, by Region 2020 & 2033
- Table 6: Global Bio Acetic Acid Industry Volume K Tons Forecast, by Region 2020 & 2033
- Table 7: Global Bio Acetic Acid Industry Revenue Million Forecast, by Raw Material 2020 & 2033
- Table 8: Global Bio Acetic Acid Industry Volume K Tons Forecast, by Raw Material 2020 & 2033
- Table 9: Global Bio Acetic Acid Industry Revenue Million Forecast, by Application 2020 & 2033
- Table 10: Global Bio Acetic Acid Industry Volume K Tons Forecast, by Application 2020 & 2033
- Table 11: Global Bio Acetic Acid Industry Revenue Million Forecast, by Country 2020 & 2033
- Table 12: Global Bio Acetic Acid Industry Volume K Tons Forecast, by Country 2020 & 2033
- Table 13: China Bio Acetic Acid Industry Revenue (Million) Forecast, by Application 2020 & 2033
- Table 14: China Bio Acetic Acid Industry Volume (K Tons) Forecast, by Application 2020 & 2033
- Table 15: India Bio Acetic Acid Industry Revenue (Million) Forecast, by Application 2020 & 2033
- Table 16: India Bio Acetic Acid Industry Volume (K Tons) Forecast, by Application 2020 & 2033
- Table 17: Japan Bio Acetic Acid Industry Revenue (Million) Forecast, by Application 2020 & 2033
- Table 18: Japan Bio Acetic Acid Industry Volume (K Tons) Forecast, by Application 2020 & 2033
- Table 19: South Korea Bio Acetic Acid Industry Revenue (Million) Forecast, by Application 2020 & 2033
- Table 20: South Korea Bio Acetic Acid Industry Volume (K Tons) Forecast, by Application 2020 & 2033
- Table 21: Malaysia Bio Acetic Acid Industry Revenue (Million) Forecast, by Application 2020 & 2033
- Table 22: Malaysia Bio Acetic Acid Industry Volume (K Tons) Forecast, by Application 2020 & 2033
- Table 23: Thailand Bio Acetic Acid Industry Revenue (Million) Forecast, by Application 2020 & 2033
- Table 24: Thailand Bio Acetic Acid Industry Volume (K Tons) Forecast, by Application 2020 & 2033
- Table 25: Indonesia Bio Acetic Acid Industry Revenue (Million) Forecast, by Application 2020 & 2033
- Table 26: Indonesia Bio Acetic Acid Industry Volume (K Tons) Forecast, by Application 2020 & 2033
- Table 27: Vietnam Bio Acetic Acid Industry Revenue (Million) Forecast, by Application 2020 & 2033
- Table 28: Vietnam Bio Acetic Acid Industry Volume (K Tons) Forecast, by Application 2020 & 2033
- Table 29: Rest of Asia Pacific Bio Acetic Acid Industry Revenue (Million) Forecast, by Application 2020 & 2033
- Table 30: Rest of Asia Pacific Bio Acetic Acid Industry Volume (K Tons) Forecast, by Application 2020 & 2033
- Table 31: Global Bio Acetic Acid Industry Revenue Million Forecast, by Raw Material 2020 & 2033
- Table 32: Global Bio Acetic Acid Industry Volume K Tons Forecast, by Raw Material 2020 & 2033
- Table 33: Global Bio Acetic Acid Industry Revenue Million Forecast, by Application 2020 & 2033
- Table 34: Global Bio Acetic Acid Industry Volume K Tons Forecast, by Application 2020 & 2033
- Table 35: Global Bio Acetic Acid Industry Revenue Million Forecast, by Country 2020 & 2033
- Table 36: Global Bio Acetic Acid Industry Volume K Tons Forecast, by Country 2020 & 2033
- Table 37: United States Bio Acetic Acid Industry Revenue (Million) Forecast, by Application 2020 & 2033
- Table 38: United States Bio Acetic Acid Industry Volume (K Tons) Forecast, by Application 2020 & 2033
- Table 39: Canada Bio Acetic Acid Industry Revenue (Million) Forecast, by Application 2020 & 2033
- Table 40: Canada Bio Acetic Acid Industry Volume (K Tons) Forecast, by Application 2020 & 2033
- Table 41: Mexico Bio Acetic Acid Industry Revenue (Million) Forecast, by Application 2020 & 2033
- Table 42: Mexico Bio Acetic Acid Industry Volume (K Tons) Forecast, by Application 2020 & 2033
- Table 43: Global Bio Acetic Acid Industry Revenue Million Forecast, by Raw Material 2020 & 2033
- Table 44: Global Bio Acetic Acid Industry Volume K Tons Forecast, by Raw Material 2020 & 2033
- Table 45: Global Bio Acetic Acid Industry Revenue Million Forecast, by Application 2020 & 2033
- Table 46: Global Bio Acetic Acid Industry Volume K Tons Forecast, by Application 2020 & 2033
- Table 47: Global Bio Acetic Acid Industry Revenue Million Forecast, by Country 2020 & 2033
- Table 48: Global Bio Acetic Acid Industry Volume K Tons Forecast, by Country 2020 & 2033
- Table 49: Germany Bio Acetic Acid Industry Revenue (Million) Forecast, by Application 2020 & 2033
- Table 50: Germany Bio Acetic Acid Industry Volume (K Tons) Forecast, by Application 2020 & 2033
- Table 51: United Kingdom Bio Acetic Acid Industry Revenue (Million) Forecast, by Application 2020 & 2033
- Table 52: United Kingdom Bio Acetic Acid Industry Volume (K Tons) Forecast, by Application 2020 & 2033
- Table 53: Italy Bio Acetic Acid Industry Revenue (Million) Forecast, by Application 2020 & 2033
- Table 54: Italy Bio Acetic Acid Industry Volume (K Tons) Forecast, by Application 2020 & 2033
- Table 55: France Bio Acetic Acid Industry Revenue (Million) Forecast, by Application 2020 & 2033
- Table 56: France Bio Acetic Acid Industry Volume (K Tons) Forecast, by Application 2020 & 2033
- Table 57: Spain Bio Acetic Acid Industry Revenue (Million) Forecast, by Application 2020 & 2033
- Table 58: Spain Bio Acetic Acid Industry Volume (K Tons) Forecast, by Application 2020 & 2033
- Table 59: NORDIC Countries Bio Acetic Acid Industry Revenue (Million) Forecast, by Application 2020 & 2033
- Table 60: NORDIC Countries Bio Acetic Acid Industry Volume (K Tons) Forecast, by Application 2020 & 2033
- Table 61: Turkey Bio Acetic Acid Industry Revenue (Million) Forecast, by Application 2020 & 2033
- Table 62: Turkey Bio Acetic Acid Industry Volume (K Tons) Forecast, by Application 2020 & 2033
- Table 63: Russia Bio Acetic Acid Industry Revenue (Million) Forecast, by Application 2020 & 2033
- Table 64: Russia Bio Acetic Acid Industry Volume (K Tons) Forecast, by Application 2020 & 2033
- Table 65: Rest of Europe Bio Acetic Acid Industry Revenue (Million) Forecast, by Application 2020 & 2033
- Table 66: Rest of Europe Bio Acetic Acid Industry Volume (K Tons) Forecast, by Application 2020 & 2033
- Table 67: Global Bio Acetic Acid Industry Revenue Million Forecast, by Raw Material 2020 & 2033
- Table 68: Global Bio Acetic Acid Industry Volume K Tons Forecast, by Raw Material 2020 & 2033
- Table 69: Global Bio Acetic Acid Industry Revenue Million Forecast, by Application 2020 & 2033
- Table 70: Global Bio Acetic Acid Industry Volume K Tons Forecast, by Application 2020 & 2033
- Table 71: Global Bio Acetic Acid Industry Revenue Million Forecast, by Country 2020 & 2033
- Table 72: Global Bio Acetic Acid Industry Volume K Tons Forecast, by Country 2020 & 2033
- Table 73: Brazil Bio Acetic Acid Industry Revenue (Million) Forecast, by Application 2020 & 2033
- Table 74: Brazil Bio Acetic Acid Industry Volume (K Tons) Forecast, by Application 2020 & 2033
- Table 75: Argentina Bio Acetic Acid Industry Revenue (Million) Forecast, by Application 2020 & 2033
- Table 76: Argentina Bio Acetic Acid Industry Volume (K Tons) Forecast, by Application 2020 & 2033
- Table 77: Colombia Bio Acetic Acid Industry Revenue (Million) Forecast, by Application 2020 & 2033
- Table 78: Colombia Bio Acetic Acid Industry Volume (K Tons) Forecast, by Application 2020 & 2033
- Table 79: Rest of South America Bio Acetic Acid Industry Revenue (Million) Forecast, by Application 2020 & 2033
- Table 80: Rest of South America Bio Acetic Acid Industry Volume (K Tons) Forecast, by Application 2020 & 2033
- Table 81: Global Bio Acetic Acid Industry Revenue Million Forecast, by Raw Material 2020 & 2033
- Table 82: Global Bio Acetic Acid Industry Volume K Tons Forecast, by Raw Material 2020 & 2033
- Table 83: Global Bio Acetic Acid Industry Revenue Million Forecast, by Application 2020 & 2033
- Table 84: Global Bio Acetic Acid Industry Volume K Tons Forecast, by Application 2020 & 2033
- Table 85: Global Bio Acetic Acid Industry Revenue Million Forecast, by Country 2020 & 2033
- Table 86: Global Bio Acetic Acid Industry Volume K Tons Forecast, by Country 2020 & 2033
- Table 87: Qatar Bio Acetic Acid Industry Revenue (Million) Forecast, by Application 2020 & 2033
- Table 88: Qatar Bio Acetic Acid Industry Volume (K Tons) Forecast, by Application 2020 & 2033
- Table 89: United Arab Emirates Bio Acetic Acid Industry Revenue (Million) Forecast, by Application 2020 & 2033
- Table 90: United Arab Emirates Bio Acetic Acid Industry Volume (K Tons) Forecast, by Application 2020 & 2033
- Table 91: Nigeria Bio Acetic Acid Industry Revenue (Million) Forecast, by Application 2020 & 2033
- Table 92: Nigeria Bio Acetic Acid Industry Volume (K Tons) Forecast, by Application 2020 & 2033
- Table 93: Egypt Bio Acetic Acid Industry Revenue (Million) Forecast, by Application 2020 & 2033
- Table 94: Egypt Bio Acetic Acid Industry Volume (K Tons) Forecast, by Application 2020 & 2033
- Table 95: South Africa Bio Acetic Acid Industry Revenue (Million) Forecast, by Application 2020 & 2033
- Table 96: South Africa Bio Acetic Acid Industry Volume (K Tons) Forecast, by Application 2020 & 2033
- Table 97: Rest of Middle East and Africa Bio Acetic Acid Industry Revenue (Million) Forecast, by Application 2020 & 2033
- Table 98: Rest of Middle East and Africa Bio Acetic Acid Industry Volume (K Tons) Forecast, by Application 2020 & 2033
- Table 99: Global Bio Acetic Acid Industry Revenue Million Forecast, by Raw Material 2020 & 2033
- Table 100: Global Bio Acetic Acid Industry Volume K Tons Forecast, by Raw Material 2020 & 2033
- Table 101: Global Bio Acetic Acid Industry Revenue Million Forecast, by Application 2020 & 2033
- Table 102: Global Bio Acetic Acid Industry Volume K Tons Forecast, by Application 2020 & 2033
- Table 103: Global Bio Acetic Acid Industry Revenue Million Forecast, by Country 2020 & 2033
- Table 104: Global Bio Acetic Acid Industry Volume K Tons Forecast, by Country 2020 & 2033
- Table 105: Saudi Arabia Bio Acetic Acid Industry Revenue (Million) Forecast, by Application 2020 & 2033
- Table 106: Saudi Arabia Bio Acetic Acid Industry Volume (K Tons) Forecast, by Application 2020 & 2033
- Table 107: South Africa Bio Acetic Acid Industry Revenue (Million) Forecast, by Application 2020 & 2033
- Table 108: South Africa Bio Acetic Acid Industry Volume (K Tons) Forecast, by Application 2020 & 2033
- Table 109: Rest of Middle East and Africa Bio Acetic Acid Industry Revenue (Million) Forecast, by Application 2020 & 2033
- Table 110: Rest of Middle East and Africa Bio Acetic Acid Industry Volume (K Tons) Forecast, by Application 2020 & 2033
Frequently Asked Questions
1. What is the projected Compound Annual Growth Rate (CAGR) of the Bio Acetic Acid Industry?
The projected CAGR is approximately > 4.00%.
2. Which companies are prominent players in the Bio Acetic Acid Industry?
Key companies in the market include AFYREN SA*List Not Exhaustive, SUCROAL S A, Cargill Incorporated, Novozymes, Zea, LanzaTech, GODAVARI BIOREFINERIES LTD, btgbioliquids, Airedale Chemical Company Limited, BASF SE.
3. What are the main segments of the Bio Acetic Acid Industry?
The market segments include Raw Material, Application.
4. Can you provide details about the market size?
The market size is estimated to be USD 220.6 Million as of 2022.
5. What are some drivers contributing to market growth?
Rising Crude Oil Prices; Increasing Demand for Vinyl Acetate Monomer (VAM).
6. What are the notable trends driving market growth?
Vinyl Acetate Monomer (VAM) Segment to Dominate the Market.
7. Are there any restraints impacting market growth?
Scarcity and Social Constraints for Raw Materials; Environmental Concerns Regarding the Harmful Effects.
8. Can you provide examples of recent developments in the market?
July 2022: Novozymes launched Innova Apex and Innova Turbo, advanced yeast solutions that can tolerate up to 0.6% lactic acid and 0.4% acetic acid and 0.8% lactic acid, and 0.4% acetic acid, respectively. The solutions are tailored to work in specific fermentation times, enabling ethanol producers to maximize their fermentation process to achieve their desired production targets.
9. What pricing options are available for accessing the report?
Pricing options include single-user, multi-user, and enterprise licenses priced at USD 4750, USD 5250, and USD 8750 respectively.
10. Is the market size provided in terms of value or volume?
The market size is provided in terms of value, measured in Million and volume, measured in K Tons.
11. Are there any specific market keywords associated with the report?
Yes, the market keyword associated with the report is "Bio Acetic Acid Industry," which aids in identifying and referencing the specific market segment covered.
12. How do I determine which pricing option suits my needs best?
The pricing options vary based on user requirements and access needs. Individual users may opt for single-user licenses, while businesses requiring broader access may choose multi-user or enterprise licenses for cost-effective access to the report.
13. Are there any additional resources or data provided in the Bio Acetic Acid Industry report?
While the report offers comprehensive insights, it's advisable to review the specific contents or supplementary materials provided to ascertain if additional resources or data are available.
14. How can I stay updated on further developments or reports in the Bio Acetic Acid Industry?
To stay informed about further developments, trends, and reports in the Bio Acetic Acid Industry, consider subscribing to industry newsletters, following relevant companies and organizations, or regularly checking reputable industry news sources and publications.
Methodology
Step 1 - Identification of Relevant Samples Size from Population Database


Step 2 - Approaches for Defining Global Market Size (Value, Volume* & Price*)

Note*: In applicable scenarios
Step 3 - Data Sources
Primary Research
- Web Analytics
- Survey Reports
- Research Institute
- Latest Research Reports
- Opinion Leaders
Secondary Research
- Annual Reports
- White Paper
- Latest Press Release
- Industry Association
- Paid Database
- Investor Presentations

Step 4 - Data Triangulation
Involves using different sources of information in order to increase the validity of a study
These sources are likely to be stakeholders in a program - participants, other researchers, program staff, other community members, and so on.
Then we put all data in single framework & apply various statistical tools to find out the dynamic on the market.
During the analysis stage, feedback from the stakeholder groups would be compared to determine areas of agreement as well as areas of divergence