

Key Insights
The global bio-based resins market is poised for significant expansion, driven by escalating consumer and industrial demand for sustainable and eco-friendly material solutions. With a projected market size of $1.4 billion by 2025 and a robust compound annual growth rate (CAGR) of 9%, this sector is set for sustained growth. This upward trajectory is attributed to several key drivers: increasing environmental consciousness and the subsequent shift away from petroleum-based plastics towards biodegradable alternatives; supportive government regulations that encourage the adoption of renewable resources; and the broadening applications of bio-based resins across various industries. While the packaging sector currently leads, substantial growth is anticipated in textiles, consumer goods, and automotive segments as manufacturers increasingly integrate sustainable materials into their operations. Leading market participants, including Novamont SpA, Futerro, and Arkema SA, are at the forefront of innovation, consistently enhancing material properties and expanding product offerings to meet diverse industry requirements. Intense competition is expected to persist, with emerging players contributing to ongoing innovation and cost optimization.
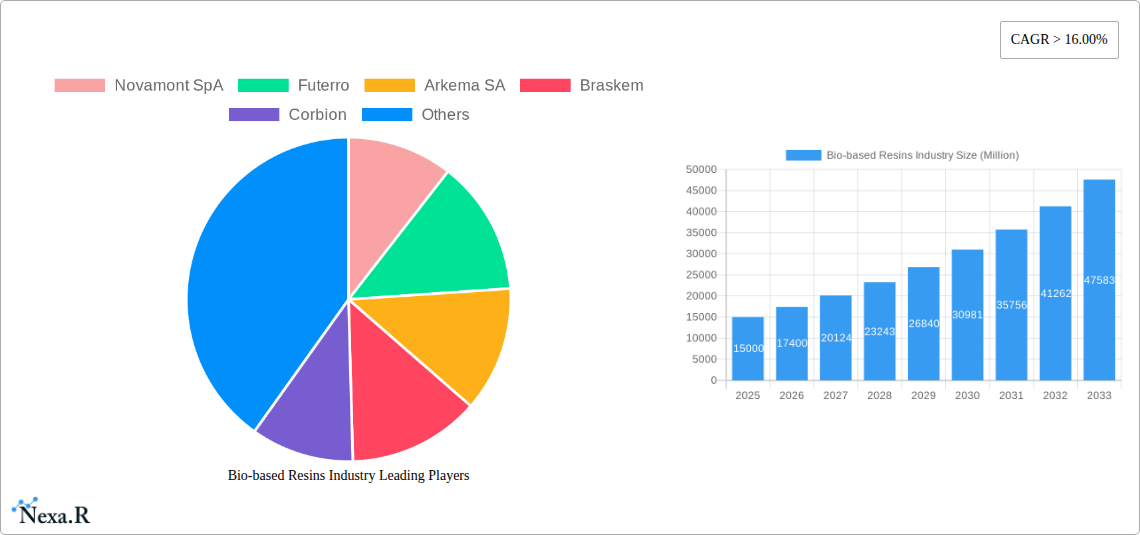
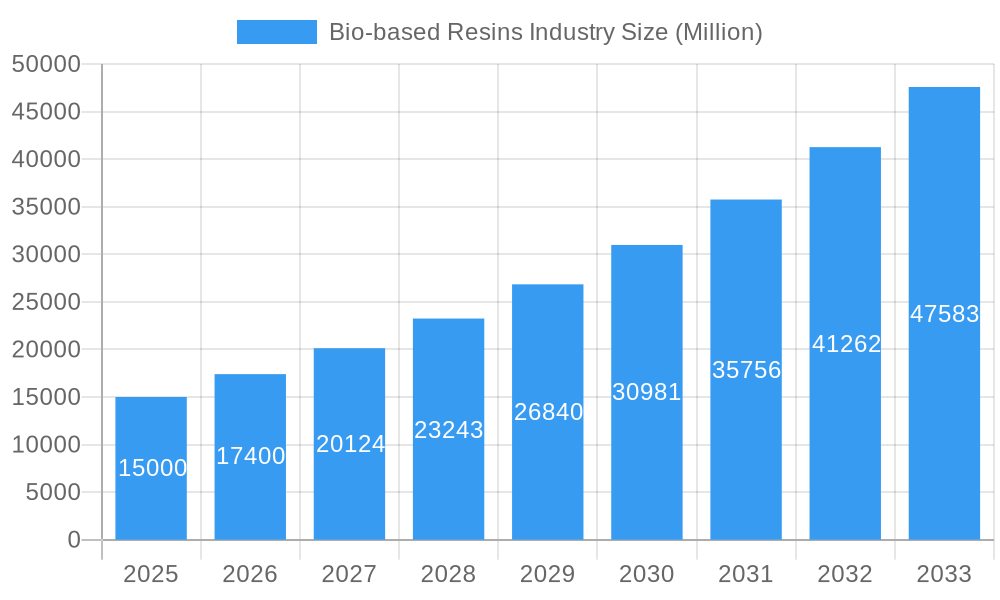
Bio-based Resins Industry Market Size (In Billion)
Geographically, North America and Europe are established leaders, while the Asia-Pacific region presents considerable growth opportunities due to its expanding manufacturing base and rising consumer expenditure. However, challenges such as higher production costs compared to conventional plastics and the need for further technological advancements to improve performance and durability require ongoing attention.
Bio-based Resins Industry Company Market Share
Market segmentation reveals a diverse range of bio-based resins, with biodegradable starch blends, polylactic acid (PLA), and bio-polyethylene terephthalate (Bio-PET) holding dominant positions. Emerging bio-based resins like polyhydroxyalkanoate (PHA) also show significant promise for specialized applications. The competitive landscape is characterized by the presence of established chemical corporations and innovative biotech firms. Strategic partnerships, mergers, acquisitions, and technological collaborations will be instrumental in market consolidation and the introduction of advanced bio-based resins. Future market expansion hinges on successful cost reduction strategies, the development of novel applications, and ensuring scalability and supply chain reliability. Continued investment in research and development is therefore vital to unlock the full potential of this dynamic sector.
Bio-based Resins Industry: A Comprehensive Market Report (2019-2033)
This comprehensive report provides an in-depth analysis of the bio-based resins industry, encompassing market dynamics, growth trends, regional dominance, product landscapes, and future opportunities. The study period spans from 2019 to 2033, with 2025 serving as the base and estimated year. The forecast period covers 2025-2033, and the historical period encompasses 2019-2024. Key players analyzed include Novamont SpA, Futerro, Arkema SA, Braskem, Corbion, BASF SE, Trinseo, Biotec, Yield10 Bioscience Inc, DuPont, Minima, Natureworks LLC, and Danimer Scientific. The report segments the market by type (Biodegradable Starch Blends, Polylactic Acid (PLA), Bio-polyethylene Terephthalate (Bio-PET), Polyhydroxyalkanoate (PHA), Bio-polyethylene (Bio-PE), Biodegradable Polyesters, Other Types) and application (Packaging, Textiles, Consumer Goods, Automotive and Transportation, Agriculture and Horticulture, Building and Construction, Electrical and Electronics, Other Applications). Market values are presented in million units.
Bio-based Resins Industry Market Dynamics & Structure
The bio-based resins market is characterized by moderate concentration, with several major players and a growing number of smaller specialized firms. Technological innovation, driven by the need for sustainable alternatives to petroleum-based plastics, is a key driver. Stringent environmental regulations globally are further pushing adoption. Competition from conventional plastics remains a significant challenge, although bio-based resins are increasingly competitive in terms of price and performance in specific applications. Mergers and acquisitions (M&A) activity is expected to increase as larger players seek to expand their market share and product portfolios. The market experienced xx M&A deals in 2024.
- Market Concentration: Moderately concentrated, with top 5 players holding approximately xx% market share in 2024.
- Technological Innovation: Focus on improving biodegradability, biocompatibility, and cost-effectiveness.
- Regulatory Frameworks: Increasingly stringent regulations favoring bio-based materials in various regions.
- Competitive Substitutes: Traditional petroleum-based plastics pose a major competitive threat.
- End-User Demographics: Growing demand from environmentally conscious consumers and businesses.
- M&A Trends: Increasing consolidation through strategic acquisitions and partnerships.
Bio-based Resins Industry Growth Trends & Insights
The global bio-based resins market is experiencing robust and accelerating growth, a direct consequence of escalating environmental consciousness and a surging demand for sustainable alternatives across packaging, consumer goods, and a widening array of industrial applications. The market size, which stood at approximately [Insert Actual Value Here] million units in 2024, is projected to reach an impressive [Insert Actual Value Here] million units by 2033, demonstrating a Compound Annual Growth Rate (CAGR) of [Insert Actual Value Here]% during the forecast period. This upward trajectory is significantly propelled by continuous technological advancements that are enhancing the performance, durability, and cost-competitiveness of bio-based resins, making them increasingly viable replacements for conventional petroleum-based plastics. Consumer preference for eco-friendly products, coupled with stringent government regulations and policy frameworks that actively promote sustainable materials, are further catalyzing market expansion. A notable shift in consumer behavior towards ethically sourced and environmentally responsible products is a powerful underlying force. Specific application segments, particularly packaging and consumer goods, are witnessing exceptionally high adoption rates. While nascent, the utilization of bio-based resins in sectors like automotive and construction is also steadily increasing, indicating a broad spectrum of future growth potential. The market penetration of bio-based resins within the critical packaging segment reached [Insert Actual Value Here]% in 2024, highlighting its established presence and room for further penetration.
Dominant Regions, Countries, or Segments in Bio-based Resins Industry
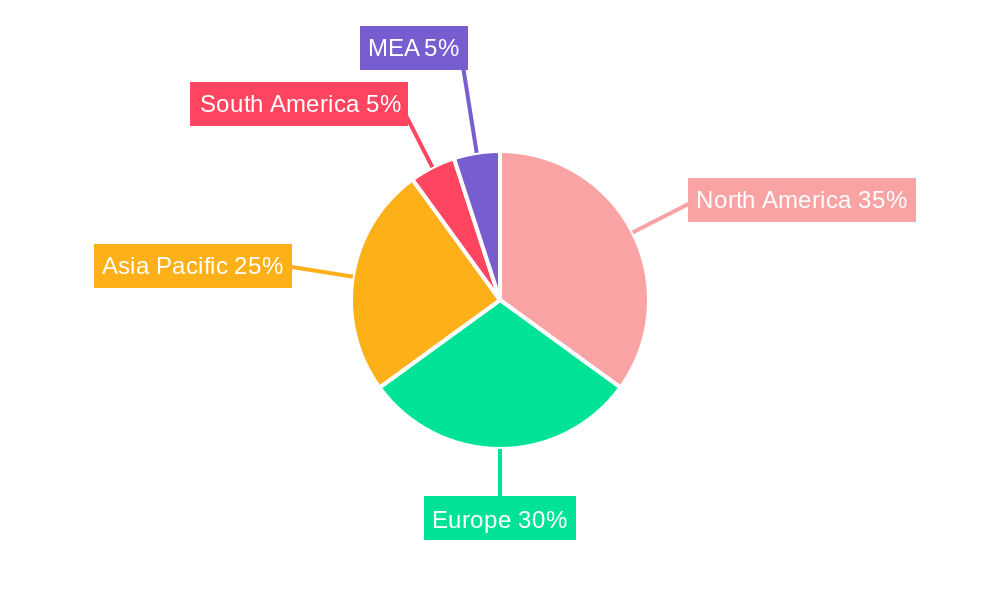
North America and Europe currently dominate the bio-based resins market, driven by strong environmental regulations, a high level of consumer awareness, and significant investments in research and development. Within these regions, countries such as the USA and Germany are leading the market. However, Asia-Pacific is witnessing the fastest growth rate, fueled by increasing industrialization, rising disposable incomes, and supportive government policies.
- Leading Segments: Packaging is the largest application segment, followed by consumer goods and textiles. PLA and Bio-PE are the dominant types.
- Key Drivers (North America & Europe): Stringent environmental regulations, high consumer awareness, and robust R&D investment.
- Key Drivers (Asia-Pacific): Rapid industrialization, rising disposable incomes, and supportive government initiatives.
- Market Share: North America holds approximately xx% market share, while Europe holds approximately xx%, and Asia-Pacific holds xx% in 2024. Growth potential is highest in Asia-Pacific.
Bio-based Resins Industry Product Landscape
The bio-based resins product landscape is dynamic, with continuous innovation focused on enhancing material properties like strength, flexibility, and biodegradability. New product formulations are emerging that address specific application requirements, offering improved performance characteristics compared to traditional bio-based resins. Companies are leveraging advancements in material science to develop resins with tailored properties and extended functionalities. A key trend is the development of compostable and biodegradable resins suitable for various applications, driving broader market adoption.
Key Drivers, Barriers & Challenges in Bio-based Resins Industry
Key Drivers:
- Escalating global consumer demand for sustainable, environmentally friendly products.
- Increasingly stringent environmental regulations and policies worldwide, mandating reduced reliance on fossil-fuel-based materials.
- Significant technological advancements leading to more efficient and cost-effective production processes for bio-based resins.
- Proactive government incentives, subsidies, and supportive policies that encourage the adoption and development of bio-based materials.
- Growing corporate sustainability initiatives and commitments to reduce carbon footprints.
Key Challenges:
- Persistent higher production costs compared to established traditional petroleum-based plastics, impacting price competitiveness.
- Varied and sometimes limited availability of suitable bio-based feedstock in certain geographical regions, posing supply chain concerns.
- In some niche applications, performance limitations or trade-offs in durability and specific properties when directly compared to certain conventional plastics.
- Navigating complex regulatory landscapes and the absence of universal standardization in various markets, which can impede widespread adoption. The current cost differential between bio-based and conventional plastics was estimated to have resulted in approximately [Insert Actual Value Here] million units less consumption of bio-based resins in 2024, underscoring the pricing barrier.
- Public perception and education regarding the benefits and proper disposal of bio-based materials.
Emerging Opportunities in Bio-based Resins Industry
The bio-based resins industry is poised for significant expansion, with emerging opportunities concentrated in the development and penetration of advanced bioplastics for highly specialized applications, including the medical and electronics sectors, where biodegradability and biocompatibility are paramount. Furthermore, there is a substantial opportunity in developing high-performance bio-based resins tailored for demanding industries like automotive and construction, addressing needs for lightweighting, durability, and reduced environmental impact. The relentless and growing demand for sustainable packaging solutions, especially within the fast-moving food and beverage sector, presents a vast and immediate growth avenue. Innovations in bio-based resin formulations that demonstrably enhance biodegradability, compostability, and end-of-life options will be critical in unlocking entirely new market segments and driving circular economy principles. The development of resins with improved barrier properties and shelf-life extension capabilities for food packaging also represents a lucrative area.
Growth Accelerators in the Bio-based Resins Industry
Long-term growth will be accelerated by technological breakthroughs in bio-based resin production, reducing costs and improving performance. Strategic partnerships between resin producers and end-users will drive wider adoption and accelerate market penetration. Expansion into new geographical markets, particularly in developing economies, will further stimulate market expansion. Government initiatives supporting the development and adoption of bio-based materials will play a crucial role.
Key Players Shaping the Bio-based Resins Industry Market
- Novamont SpA
- Futerro
- Arkema SA
- Braskem
- Corbion
- BASF SE
- Trinseo
- Biotec
- Yield10 Bioscience Inc
- DuPont
- Minima
- Natureworks LLC
- Danimer Scientific
- Covestro AG
- Teijin Limited
Notable Milestones in Bio-based Resins Industry Sector
- 2022-Q3: BASF unveiled a cutting-edge new range of high-performance bio-based polyamides, expanding its sustainable material offerings.
- 2023-Q1: Novamont strategically acquired a smaller bioplastics producer, significantly enhancing its product portfolio and market reach in the biodegradable materials sector.
- 2024-Q2: Arkema announced a substantial investment in establishing a new, state-of-the-art bio-based resin production facility, signaling strong confidence in future market growth.
- 2024-Q3: NatureWorks commercialized a new generation of polylactic acid (PLA) resins with improved heat resistance, broadening its application scope.
- 2025-Q1 (Projected): Braskem is anticipated to expand its bio-polyethylene production capacity, meeting increasing demand for renewable plastics.
In-Depth Bio-based Resins Industry Market Outlook
The future of the bio-based resins market is bright, with significant growth potential driven by increasing environmental awareness, supportive government policies, and continuous technological advancements. Strategic opportunities exist for companies to develop innovative products, expand into new applications, and establish strong partnerships across the value chain. The market's long-term trajectory is strongly positive, with substantial expansion projected across all key segments and regions.
Bio-based Resins Industry Segmentation
-
1. Type
- 1.1. Biodegradable Starch Blends
- 1.2. Polylactic Acid (PLA)
- 1.3. Bio-polyethylene Terephthalate (Bio-PET)
- 1.4. Polyhydroxyalkanoate (PHA)
- 1.5. Bio-polyethylene (Bio-PE)
- 1.6. Biodegradable Polyesters
- 1.7. Other Types
-
2. Application
-
2.1. Packaging
- 2.1.1. Rigid
- 2.1.2. Flexible
- 2.2. Textiles
- 2.3. Consumer Goods
- 2.4. Automotive and Transportation
- 2.5. Agriculture and Horticulture
- 2.6. Building and Construction
- 2.7. Electrical and Electronics
- 2.8. Other Applications
-
2.1. Packaging
Bio-based Resins Industry Segmentation By Geography
-
1. Asia Pacific
- 1.1. China
- 1.2. India
- 1.3. Japan
- 1.4. South Korea
- 1.5. Rest of Asia Pacific
-
2. North America
- 2.1. United States
- 2.2. Canada
- 2.3. Mexico
-
3. Europe
- 3.1. Germany
- 3.2. United Kingdom
- 3.3. France
- 3.4. Italy
- 3.5. Rest of Europe
-
4. South America
- 4.1. Brazil
- 4.2. Argentina
- 4.3. Rest of South America
- 5. Middle East
-
6. Saudi Arabia
- 6.1. South Africa
- 6.2. Rest of Middle East
Bio-based Resins Industry Regional Market Share
Geographic Coverage of Bio-based Resins Industry
Bio-based Resins Industry REPORT HIGHLIGHTS
| Aspects | Details |
|---|---|
| Study Period | 2020-2034 |
| Base Year | 2025 |
| Estimated Year | 2026 |
| Forecast Period | 2026-2034 |
| Historical Period | 2020-2025 |
| Growth Rate | CAGR of 9% from 2020-2034 |
| Segmentation |
|
Table of Contents
- 1. Introduction
- 1.1. Research Scope
- 1.2. Market Segmentation
- 1.3. Research Objective
- 1.4. Definitions and Assumptions
- 2. Executive Summary
- 2.1. Market Snapshot
- 3. Market Dynamics
- 3.1. Market Drivers
- 3.2. Market Restrains
- 3.3. Market Trends
- 3.4. Market Opportunities
- 4. Market Factor Analysis
- 4.1. Porters Five Forces
- 4.1.1. Bargaining Power of Suppliers
- 4.1.2. Bargaining Power of Buyers
- 4.1.3. Threat of New Entrants
- 4.1.4. Threat of Substitutes
- 4.1.5. Competitive Rivalry
- 4.2. PESTEL analysis
- 4.3. BCG Analysis
- 4.3.1. Stars (High Growth, High Market Share)
- 4.3.2. Cash Cows (Low Growth, High Market Share)
- 4.3.3. Question Mark (High Growth, Low Market Share)
- 4.3.4. Dogs (Low Growth, Low Market Share)
- 4.4. Ansoff Matrix Analysis
- 4.5. Supply Chain Analysis
- 4.6. Regulatory Landscape
- 4.7. Current Market Potential and Opportunity Assessment (TAM–SAM–SOM Framework)
- 4.8. NRP Analyst Note
- 4.1. Porters Five Forces
- 5. Market Analysis, Insights and Forecast 2021-2033
- 5.1. Market Analysis, Insights and Forecast - by Type
- 5.1.1. Biodegradable Starch Blends
- 5.1.2. Polylactic Acid (PLA)
- 5.1.3. Bio-polyethylene Terephthalate (Bio-PET)
- 5.1.4. Polyhydroxyalkanoate (PHA)
- 5.1.5. Bio-polyethylene (Bio-PE)
- 5.1.6. Biodegradable Polyesters
- 5.1.7. Other Types
- 5.2. Market Analysis, Insights and Forecast - by Application
- 5.2.1. Packaging
- 5.2.1.1. Rigid
- 5.2.1.2. Flexible
- 5.2.2. Textiles
- 5.2.3. Consumer Goods
- 5.2.4. Automotive and Transportation
- 5.2.5. Agriculture and Horticulture
- 5.2.6. Building and Construction
- 5.2.7. Electrical and Electronics
- 5.2.8. Other Applications
- 5.2.1. Packaging
- 5.3. Market Analysis, Insights and Forecast - by Region
- 5.3.1. Asia Pacific
- 5.3.2. North America
- 5.3.3. Europe
- 5.3.4. South America
- 5.3.5. Middle East
- 5.3.6. Saudi Arabia
- 5.1. Market Analysis, Insights and Forecast - by Type
- 6. Global Bio-based Resins Industry Analysis, Insights and Forecast, 2021-2033
- 6.1. Market Analysis, Insights and Forecast - by Type
- 6.1.1. Biodegradable Starch Blends
- 6.1.2. Polylactic Acid (PLA)
- 6.1.3. Bio-polyethylene Terephthalate (Bio-PET)
- 6.1.4. Polyhydroxyalkanoate (PHA)
- 6.1.5. Bio-polyethylene (Bio-PE)
- 6.1.6. Biodegradable Polyesters
- 6.1.7. Other Types
- 6.2. Market Analysis, Insights and Forecast - by Application
- 6.2.1. Packaging
- 6.2.1.1. Rigid
- 6.2.1.2. Flexible
- 6.2.2. Textiles
- 6.2.3. Consumer Goods
- 6.2.4. Automotive and Transportation
- 6.2.5. Agriculture and Horticulture
- 6.2.6. Building and Construction
- 6.2.7. Electrical and Electronics
- 6.2.8. Other Applications
- 6.2.1. Packaging
- 6.1. Market Analysis, Insights and Forecast - by Type
- 7. Asia Pacific Bio-based Resins Industry Analysis, Insights and Forecast, 2020-2032
- 7.1. Market Analysis, Insights and Forecast - by Type
- 7.1.1. Biodegradable Starch Blends
- 7.1.2. Polylactic Acid (PLA)
- 7.1.3. Bio-polyethylene Terephthalate (Bio-PET)
- 7.1.4. Polyhydroxyalkanoate (PHA)
- 7.1.5. Bio-polyethylene (Bio-PE)
- 7.1.6. Biodegradable Polyesters
- 7.1.7. Other Types
- 7.2. Market Analysis, Insights and Forecast - by Application
- 7.2.1. Packaging
- 7.2.1.1. Rigid
- 7.2.1.2. Flexible
- 7.2.2. Textiles
- 7.2.3. Consumer Goods
- 7.2.4. Automotive and Transportation
- 7.2.5. Agriculture and Horticulture
- 7.2.6. Building and Construction
- 7.2.7. Electrical and Electronics
- 7.2.8. Other Applications
- 7.2.1. Packaging
- 7.1. Market Analysis, Insights and Forecast - by Type
- 8. North America Bio-based Resins Industry Analysis, Insights and Forecast, 2020-2032
- 8.1. Market Analysis, Insights and Forecast - by Type
- 8.1.1. Biodegradable Starch Blends
- 8.1.2. Polylactic Acid (PLA)
- 8.1.3. Bio-polyethylene Terephthalate (Bio-PET)
- 8.1.4. Polyhydroxyalkanoate (PHA)
- 8.1.5. Bio-polyethylene (Bio-PE)
- 8.1.6. Biodegradable Polyesters
- 8.1.7. Other Types
- 8.2. Market Analysis, Insights and Forecast - by Application
- 8.2.1. Packaging
- 8.2.1.1. Rigid
- 8.2.1.2. Flexible
- 8.2.2. Textiles
- 8.2.3. Consumer Goods
- 8.2.4. Automotive and Transportation
- 8.2.5. Agriculture and Horticulture
- 8.2.6. Building and Construction
- 8.2.7. Electrical and Electronics
- 8.2.8. Other Applications
- 8.2.1. Packaging
- 8.1. Market Analysis, Insights and Forecast - by Type
- 9. Europe Bio-based Resins Industry Analysis, Insights and Forecast, 2020-2032
- 9.1. Market Analysis, Insights and Forecast - by Type
- 9.1.1. Biodegradable Starch Blends
- 9.1.2. Polylactic Acid (PLA)
- 9.1.3. Bio-polyethylene Terephthalate (Bio-PET)
- 9.1.4. Polyhydroxyalkanoate (PHA)
- 9.1.5. Bio-polyethylene (Bio-PE)
- 9.1.6. Biodegradable Polyesters
- 9.1.7. Other Types
- 9.2. Market Analysis, Insights and Forecast - by Application
- 9.2.1. Packaging
- 9.2.1.1. Rigid
- 9.2.1.2. Flexible
- 9.2.2. Textiles
- 9.2.3. Consumer Goods
- 9.2.4. Automotive and Transportation
- 9.2.5. Agriculture and Horticulture
- 9.2.6. Building and Construction
- 9.2.7. Electrical and Electronics
- 9.2.8. Other Applications
- 9.2.1. Packaging
- 9.1. Market Analysis, Insights and Forecast - by Type
- 10. South America Bio-based Resins Industry Analysis, Insights and Forecast, 2020-2032
- 10.1. Market Analysis, Insights and Forecast - by Type
- 10.1.1. Biodegradable Starch Blends
- 10.1.2. Polylactic Acid (PLA)
- 10.1.3. Bio-polyethylene Terephthalate (Bio-PET)
- 10.1.4. Polyhydroxyalkanoate (PHA)
- 10.1.5. Bio-polyethylene (Bio-PE)
- 10.1.6. Biodegradable Polyesters
- 10.1.7. Other Types
- 10.2. Market Analysis, Insights and Forecast - by Application
- 10.2.1. Packaging
- 10.2.1.1. Rigid
- 10.2.1.2. Flexible
- 10.2.2. Textiles
- 10.2.3. Consumer Goods
- 10.2.4. Automotive and Transportation
- 10.2.5. Agriculture and Horticulture
- 10.2.6. Building and Construction
- 10.2.7. Electrical and Electronics
- 10.2.8. Other Applications
- 10.2.1. Packaging
- 10.1. Market Analysis, Insights and Forecast - by Type
- 11. Middle East Bio-based Resins Industry Analysis, Insights and Forecast, 2020-2032
- 11.1. Market Analysis, Insights and Forecast - by Type
- 11.1.1. Biodegradable Starch Blends
- 11.1.2. Polylactic Acid (PLA)
- 11.1.3. Bio-polyethylene Terephthalate (Bio-PET)
- 11.1.4. Polyhydroxyalkanoate (PHA)
- 11.1.5. Bio-polyethylene (Bio-PE)
- 11.1.6. Biodegradable Polyesters
- 11.1.7. Other Types
- 11.2. Market Analysis, Insights and Forecast - by Application
- 11.2.1. Packaging
- 11.2.1.1. Rigid
- 11.2.1.2. Flexible
- 11.2.2. Textiles
- 11.2.3. Consumer Goods
- 11.2.4. Automotive and Transportation
- 11.2.5. Agriculture and Horticulture
- 11.2.6. Building and Construction
- 11.2.7. Electrical and Electronics
- 11.2.8. Other Applications
- 11.2.1. Packaging
- 11.1. Market Analysis, Insights and Forecast - by Type
- 12. Saudi Arabia Bio-based Resins Industry Analysis, Insights and Forecast, 2020-2032
- 12.1. Market Analysis, Insights and Forecast - by Type
- 12.1.1. Biodegradable Starch Blends
- 12.1.2. Polylactic Acid (PLA)
- 12.1.3. Bio-polyethylene Terephthalate (Bio-PET)
- 12.1.4. Polyhydroxyalkanoate (PHA)
- 12.1.5. Bio-polyethylene (Bio-PE)
- 12.1.6. Biodegradable Polyesters
- 12.1.7. Other Types
- 12.2. Market Analysis, Insights and Forecast - by Application
- 12.2.1. Packaging
- 12.2.1.1. Rigid
- 12.2.1.2. Flexible
- 12.2.2. Textiles
- 12.2.3. Consumer Goods
- 12.2.4. Automotive and Transportation
- 12.2.5. Agriculture and Horticulture
- 12.2.6. Building and Construction
- 12.2.7. Electrical and Electronics
- 12.2.8. Other Applications
- 12.2.1. Packaging
- 12.1. Market Analysis, Insights and Forecast - by Type
- 13. Competitive Analysis
- 13.1. Company Profiles
- 13.1.1 Novamont SpA
- 13.1.1.1. Company Overview
- 13.1.1.2. Products
- 13.1.1.3. Company Financials
- 13.1.1.4. SWOT Analysis
- 13.1.2 Futerro
- 13.1.2.1. Company Overview
- 13.1.2.2. Products
- 13.1.2.3. Company Financials
- 13.1.2.4. SWOT Analysis
- 13.1.3 Arkema SA
- 13.1.3.1. Company Overview
- 13.1.3.2. Products
- 13.1.3.3. Company Financials
- 13.1.3.4. SWOT Analysis
- 13.1.4 Braskem
- 13.1.4.1. Company Overview
- 13.1.4.2. Products
- 13.1.4.3. Company Financials
- 13.1.4.4. SWOT Analysis
- 13.1.5 Corbion
- 13.1.5.1. Company Overview
- 13.1.5.2. Products
- 13.1.5.3. Company Financials
- 13.1.5.4. SWOT Analysis
- 13.1.6 BASF SE
- 13.1.6.1. Company Overview
- 13.1.6.2. Products
- 13.1.6.3. Company Financials
- 13.1.6.4. SWOT Analysis
- 13.1.7 Trinseo
- 13.1.7.1. Company Overview
- 13.1.7.2. Products
- 13.1.7.3. Company Financials
- 13.1.7.4. SWOT Analysis
- 13.1.8 Biotec
- 13.1.8.1. Company Overview
- 13.1.8.2. Products
- 13.1.8.3. Company Financials
- 13.1.8.4. SWOT Analysis
- 13.1.9 Yield10 Bioscience Inc
- 13.1.9.1. Company Overview
- 13.1.9.2. Products
- 13.1.9.3. Company Financials
- 13.1.9.4. SWOT Analysis
- 13.1.10 DuPont
- 13.1.10.1. Company Overview
- 13.1.10.2. Products
- 13.1.10.3. Company Financials
- 13.1.10.4. SWOT Analysis
- 13.1.11 Minima
- 13.1.11.1. Company Overview
- 13.1.11.2. Products
- 13.1.11.3. Company Financials
- 13.1.11.4. SWOT Analysis
- 13.1.12 Natureworks LLC
- 13.1.12.1. Company Overview
- 13.1.12.2. Products
- 13.1.12.3. Company Financials
- 13.1.12.4. SWOT Analysis
- 13.1.13 Danimer Scientific
- 13.1.13.1. Company Overview
- 13.1.13.2. Products
- 13.1.13.3. Company Financials
- 13.1.13.4. SWOT Analysis
- 13.1.1 Novamont SpA
- 13.2. Market Entropy
- 13.2.1 Company's Key Areas Served
- 13.2.2 Recent Developments
- 13.3. Company Market Share Analysis 2025
- 13.3.1 Top 5 Companies Market Share Analysis
- 13.3.2 Top 3 Companies Market Share Analysis
- 13.4. List of Potential Customers
- 14. Research Methodology
List of Figures
- Figure 1: Global Bio-based Resins Industry Revenue Breakdown (billion, %) by Region 2025 & 2033
- Figure 2: Global Bio-based Resins Industry Volume Breakdown (K Tons, %) by Region 2025 & 2033
- Figure 3: Asia Pacific Bio-based Resins Industry Revenue (billion), by Type 2025 & 2033
- Figure 4: Asia Pacific Bio-based Resins Industry Volume (K Tons), by Type 2025 & 2033
- Figure 5: Asia Pacific Bio-based Resins Industry Revenue Share (%), by Type 2025 & 2033
- Figure 6: Asia Pacific Bio-based Resins Industry Volume Share (%), by Type 2025 & 2033
- Figure 7: Asia Pacific Bio-based Resins Industry Revenue (billion), by Application 2025 & 2033
- Figure 8: Asia Pacific Bio-based Resins Industry Volume (K Tons), by Application 2025 & 2033
- Figure 9: Asia Pacific Bio-based Resins Industry Revenue Share (%), by Application 2025 & 2033
- Figure 10: Asia Pacific Bio-based Resins Industry Volume Share (%), by Application 2025 & 2033
- Figure 11: Asia Pacific Bio-based Resins Industry Revenue (billion), by Country 2025 & 2033
- Figure 12: Asia Pacific Bio-based Resins Industry Volume (K Tons), by Country 2025 & 2033
- Figure 13: Asia Pacific Bio-based Resins Industry Revenue Share (%), by Country 2025 & 2033
- Figure 14: Asia Pacific Bio-based Resins Industry Volume Share (%), by Country 2025 & 2033
- Figure 15: North America Bio-based Resins Industry Revenue (billion), by Type 2025 & 2033
- Figure 16: North America Bio-based Resins Industry Volume (K Tons), by Type 2025 & 2033
- Figure 17: North America Bio-based Resins Industry Revenue Share (%), by Type 2025 & 2033
- Figure 18: North America Bio-based Resins Industry Volume Share (%), by Type 2025 & 2033
- Figure 19: North America Bio-based Resins Industry Revenue (billion), by Application 2025 & 2033
- Figure 20: North America Bio-based Resins Industry Volume (K Tons), by Application 2025 & 2033
- Figure 21: North America Bio-based Resins Industry Revenue Share (%), by Application 2025 & 2033
- Figure 22: North America Bio-based Resins Industry Volume Share (%), by Application 2025 & 2033
- Figure 23: North America Bio-based Resins Industry Revenue (billion), by Country 2025 & 2033
- Figure 24: North America Bio-based Resins Industry Volume (K Tons), by Country 2025 & 2033
- Figure 25: North America Bio-based Resins Industry Revenue Share (%), by Country 2025 & 2033
- Figure 26: North America Bio-based Resins Industry Volume Share (%), by Country 2025 & 2033
- Figure 27: Europe Bio-based Resins Industry Revenue (billion), by Type 2025 & 2033
- Figure 28: Europe Bio-based Resins Industry Volume (K Tons), by Type 2025 & 2033
- Figure 29: Europe Bio-based Resins Industry Revenue Share (%), by Type 2025 & 2033
- Figure 30: Europe Bio-based Resins Industry Volume Share (%), by Type 2025 & 2033
- Figure 31: Europe Bio-based Resins Industry Revenue (billion), by Application 2025 & 2033
- Figure 32: Europe Bio-based Resins Industry Volume (K Tons), by Application 2025 & 2033
- Figure 33: Europe Bio-based Resins Industry Revenue Share (%), by Application 2025 & 2033
- Figure 34: Europe Bio-based Resins Industry Volume Share (%), by Application 2025 & 2033
- Figure 35: Europe Bio-based Resins Industry Revenue (billion), by Country 2025 & 2033
- Figure 36: Europe Bio-based Resins Industry Volume (K Tons), by Country 2025 & 2033
- Figure 37: Europe Bio-based Resins Industry Revenue Share (%), by Country 2025 & 2033
- Figure 38: Europe Bio-based Resins Industry Volume Share (%), by Country 2025 & 2033
- Figure 39: South America Bio-based Resins Industry Revenue (billion), by Type 2025 & 2033
- Figure 40: South America Bio-based Resins Industry Volume (K Tons), by Type 2025 & 2033
- Figure 41: South America Bio-based Resins Industry Revenue Share (%), by Type 2025 & 2033
- Figure 42: South America Bio-based Resins Industry Volume Share (%), by Type 2025 & 2033
- Figure 43: South America Bio-based Resins Industry Revenue (billion), by Application 2025 & 2033
- Figure 44: South America Bio-based Resins Industry Volume (K Tons), by Application 2025 & 2033
- Figure 45: South America Bio-based Resins Industry Revenue Share (%), by Application 2025 & 2033
- Figure 46: South America Bio-based Resins Industry Volume Share (%), by Application 2025 & 2033
- Figure 47: South America Bio-based Resins Industry Revenue (billion), by Country 2025 & 2033
- Figure 48: South America Bio-based Resins Industry Volume (K Tons), by Country 2025 & 2033
- Figure 49: South America Bio-based Resins Industry Revenue Share (%), by Country 2025 & 2033
- Figure 50: South America Bio-based Resins Industry Volume Share (%), by Country 2025 & 2033
- Figure 51: Middle East Bio-based Resins Industry Revenue (billion), by Type 2025 & 2033
- Figure 52: Middle East Bio-based Resins Industry Volume (K Tons), by Type 2025 & 2033
- Figure 53: Middle East Bio-based Resins Industry Revenue Share (%), by Type 2025 & 2033
- Figure 54: Middle East Bio-based Resins Industry Volume Share (%), by Type 2025 & 2033
- Figure 55: Middle East Bio-based Resins Industry Revenue (billion), by Application 2025 & 2033
- Figure 56: Middle East Bio-based Resins Industry Volume (K Tons), by Application 2025 & 2033
- Figure 57: Middle East Bio-based Resins Industry Revenue Share (%), by Application 2025 & 2033
- Figure 58: Middle East Bio-based Resins Industry Volume Share (%), by Application 2025 & 2033
- Figure 59: Middle East Bio-based Resins Industry Revenue (billion), by Country 2025 & 2033
- Figure 60: Middle East Bio-based Resins Industry Volume (K Tons), by Country 2025 & 2033
- Figure 61: Middle East Bio-based Resins Industry Revenue Share (%), by Country 2025 & 2033
- Figure 62: Middle East Bio-based Resins Industry Volume Share (%), by Country 2025 & 2033
- Figure 63: Saudi Arabia Bio-based Resins Industry Revenue (billion), by Type 2025 & 2033
- Figure 64: Saudi Arabia Bio-based Resins Industry Volume (K Tons), by Type 2025 & 2033
- Figure 65: Saudi Arabia Bio-based Resins Industry Revenue Share (%), by Type 2025 & 2033
- Figure 66: Saudi Arabia Bio-based Resins Industry Volume Share (%), by Type 2025 & 2033
- Figure 67: Saudi Arabia Bio-based Resins Industry Revenue (billion), by Application 2025 & 2033
- Figure 68: Saudi Arabia Bio-based Resins Industry Volume (K Tons), by Application 2025 & 2033
- Figure 69: Saudi Arabia Bio-based Resins Industry Revenue Share (%), by Application 2025 & 2033
- Figure 70: Saudi Arabia Bio-based Resins Industry Volume Share (%), by Application 2025 & 2033
- Figure 71: Saudi Arabia Bio-based Resins Industry Revenue (billion), by Country 2025 & 2033
- Figure 72: Saudi Arabia Bio-based Resins Industry Volume (K Tons), by Country 2025 & 2033
- Figure 73: Saudi Arabia Bio-based Resins Industry Revenue Share (%), by Country 2025 & 2033
- Figure 74: Saudi Arabia Bio-based Resins Industry Volume Share (%), by Country 2025 & 2033
List of Tables
- Table 1: Global Bio-based Resins Industry Revenue billion Forecast, by Type 2020 & 2033
- Table 2: Global Bio-based Resins Industry Volume K Tons Forecast, by Type 2020 & 2033
- Table 3: Global Bio-based Resins Industry Revenue billion Forecast, by Application 2020 & 2033
- Table 4: Global Bio-based Resins Industry Volume K Tons Forecast, by Application 2020 & 2033
- Table 5: Global Bio-based Resins Industry Revenue billion Forecast, by Region 2020 & 2033
- Table 6: Global Bio-based Resins Industry Volume K Tons Forecast, by Region 2020 & 2033
- Table 7: Global Bio-based Resins Industry Revenue billion Forecast, by Type 2020 & 2033
- Table 8: Global Bio-based Resins Industry Volume K Tons Forecast, by Type 2020 & 2033
- Table 9: Global Bio-based Resins Industry Revenue billion Forecast, by Application 2020 & 2033
- Table 10: Global Bio-based Resins Industry Volume K Tons Forecast, by Application 2020 & 2033
- Table 11: Global Bio-based Resins Industry Revenue billion Forecast, by Country 2020 & 2033
- Table 12: Global Bio-based Resins Industry Volume K Tons Forecast, by Country 2020 & 2033
- Table 13: China Bio-based Resins Industry Revenue (billion) Forecast, by Application 2020 & 2033
- Table 14: China Bio-based Resins Industry Volume (K Tons) Forecast, by Application 2020 & 2033
- Table 15: India Bio-based Resins Industry Revenue (billion) Forecast, by Application 2020 & 2033
- Table 16: India Bio-based Resins Industry Volume (K Tons) Forecast, by Application 2020 & 2033
- Table 17: Japan Bio-based Resins Industry Revenue (billion) Forecast, by Application 2020 & 2033
- Table 18: Japan Bio-based Resins Industry Volume (K Tons) Forecast, by Application 2020 & 2033
- Table 19: South Korea Bio-based Resins Industry Revenue (billion) Forecast, by Application 2020 & 2033
- Table 20: South Korea Bio-based Resins Industry Volume (K Tons) Forecast, by Application 2020 & 2033
- Table 21: Rest of Asia Pacific Bio-based Resins Industry Revenue (billion) Forecast, by Application 2020 & 2033
- Table 22: Rest of Asia Pacific Bio-based Resins Industry Volume (K Tons) Forecast, by Application 2020 & 2033
- Table 23: Global Bio-based Resins Industry Revenue billion Forecast, by Type 2020 & 2033
- Table 24: Global Bio-based Resins Industry Volume K Tons Forecast, by Type 2020 & 2033
- Table 25: Global Bio-based Resins Industry Revenue billion Forecast, by Application 2020 & 2033
- Table 26: Global Bio-based Resins Industry Volume K Tons Forecast, by Application 2020 & 2033
- Table 27: Global Bio-based Resins Industry Revenue billion Forecast, by Country 2020 & 2033
- Table 28: Global Bio-based Resins Industry Volume K Tons Forecast, by Country 2020 & 2033
- Table 29: United States Bio-based Resins Industry Revenue (billion) Forecast, by Application 2020 & 2033
- Table 30: United States Bio-based Resins Industry Volume (K Tons) Forecast, by Application 2020 & 2033
- Table 31: Canada Bio-based Resins Industry Revenue (billion) Forecast, by Application 2020 & 2033
- Table 32: Canada Bio-based Resins Industry Volume (K Tons) Forecast, by Application 2020 & 2033
- Table 33: Mexico Bio-based Resins Industry Revenue (billion) Forecast, by Application 2020 & 2033
- Table 34: Mexico Bio-based Resins Industry Volume (K Tons) Forecast, by Application 2020 & 2033
- Table 35: Global Bio-based Resins Industry Revenue billion Forecast, by Type 2020 & 2033
- Table 36: Global Bio-based Resins Industry Volume K Tons Forecast, by Type 2020 & 2033
- Table 37: Global Bio-based Resins Industry Revenue billion Forecast, by Application 2020 & 2033
- Table 38: Global Bio-based Resins Industry Volume K Tons Forecast, by Application 2020 & 2033
- Table 39: Global Bio-based Resins Industry Revenue billion Forecast, by Country 2020 & 2033
- Table 40: Global Bio-based Resins Industry Volume K Tons Forecast, by Country 2020 & 2033
- Table 41: Germany Bio-based Resins Industry Revenue (billion) Forecast, by Application 2020 & 2033
- Table 42: Germany Bio-based Resins Industry Volume (K Tons) Forecast, by Application 2020 & 2033
- Table 43: United Kingdom Bio-based Resins Industry Revenue (billion) Forecast, by Application 2020 & 2033
- Table 44: United Kingdom Bio-based Resins Industry Volume (K Tons) Forecast, by Application 2020 & 2033
- Table 45: France Bio-based Resins Industry Revenue (billion) Forecast, by Application 2020 & 2033
- Table 46: France Bio-based Resins Industry Volume (K Tons) Forecast, by Application 2020 & 2033
- Table 47: Italy Bio-based Resins Industry Revenue (billion) Forecast, by Application 2020 & 2033
- Table 48: Italy Bio-based Resins Industry Volume (K Tons) Forecast, by Application 2020 & 2033
- Table 49: Rest of Europe Bio-based Resins Industry Revenue (billion) Forecast, by Application 2020 & 2033
- Table 50: Rest of Europe Bio-based Resins Industry Volume (K Tons) Forecast, by Application 2020 & 2033
- Table 51: Global Bio-based Resins Industry Revenue billion Forecast, by Type 2020 & 2033
- Table 52: Global Bio-based Resins Industry Volume K Tons Forecast, by Type 2020 & 2033
- Table 53: Global Bio-based Resins Industry Revenue billion Forecast, by Application 2020 & 2033
- Table 54: Global Bio-based Resins Industry Volume K Tons Forecast, by Application 2020 & 2033
- Table 55: Global Bio-based Resins Industry Revenue billion Forecast, by Country 2020 & 2033
- Table 56: Global Bio-based Resins Industry Volume K Tons Forecast, by Country 2020 & 2033
- Table 57: Brazil Bio-based Resins Industry Revenue (billion) Forecast, by Application 2020 & 2033
- Table 58: Brazil Bio-based Resins Industry Volume (K Tons) Forecast, by Application 2020 & 2033
- Table 59: Argentina Bio-based Resins Industry Revenue (billion) Forecast, by Application 2020 & 2033
- Table 60: Argentina Bio-based Resins Industry Volume (K Tons) Forecast, by Application 2020 & 2033
- Table 61: Rest of South America Bio-based Resins Industry Revenue (billion) Forecast, by Application 2020 & 2033
- Table 62: Rest of South America Bio-based Resins Industry Volume (K Tons) Forecast, by Application 2020 & 2033
- Table 63: Global Bio-based Resins Industry Revenue billion Forecast, by Type 2020 & 2033
- Table 64: Global Bio-based Resins Industry Volume K Tons Forecast, by Type 2020 & 2033
- Table 65: Global Bio-based Resins Industry Revenue billion Forecast, by Application 2020 & 2033
- Table 66: Global Bio-based Resins Industry Volume K Tons Forecast, by Application 2020 & 2033
- Table 67: Global Bio-based Resins Industry Revenue billion Forecast, by Country 2020 & 2033
- Table 68: Global Bio-based Resins Industry Volume K Tons Forecast, by Country 2020 & 2033
- Table 69: Global Bio-based Resins Industry Revenue billion Forecast, by Type 2020 & 2033
- Table 70: Global Bio-based Resins Industry Volume K Tons Forecast, by Type 2020 & 2033
- Table 71: Global Bio-based Resins Industry Revenue billion Forecast, by Application 2020 & 2033
- Table 72: Global Bio-based Resins Industry Volume K Tons Forecast, by Application 2020 & 2033
- Table 73: Global Bio-based Resins Industry Revenue billion Forecast, by Country 2020 & 2033
- Table 74: Global Bio-based Resins Industry Volume K Tons Forecast, by Country 2020 & 2033
- Table 75: South Africa Bio-based Resins Industry Revenue (billion) Forecast, by Application 2020 & 2033
- Table 76: South Africa Bio-based Resins Industry Volume (K Tons) Forecast, by Application 2020 & 2033
- Table 77: Rest of Middle East Bio-based Resins Industry Revenue (billion) Forecast, by Application 2020 & 2033
- Table 78: Rest of Middle East Bio-based Resins Industry Volume (K Tons) Forecast, by Application 2020 & 2033
Frequently Asked Questions
1. What is the projected Compound Annual Growth Rate (CAGR) of the Bio-based Resins Industry?
The projected CAGR is approximately 9%.
2. Which companies are prominent players in the Bio-based Resins Industry?
Key companies in the market include Novamont SpA, Futerro, Arkema SA, Braskem, Corbion, BASF SE, Trinseo, Biotec, Yield10 Bioscience Inc, DuPont, Minima, Natureworks LLC, Danimer Scientific.
3. What are the main segments of the Bio-based Resins Industry?
The market segments include Type, Application.
4. Can you provide details about the market size?
The market size is estimated to be USD 1.4 billion as of 2022.
5. What are some drivers contributing to market growth?
; Environmental Factors Encouraging a Paradigm Shift; Surging Demand for Bioplastics in Flexible Packaging.
6. What are the notable trends driving market growth?
Flexible Packaging Segment to Dominate the Market Demand.
7. Are there any restraints impacting market growth?
; Lack of Awareness and High Cost Association; Availability of Cheaper Alternatives.
8. Can you provide examples of recent developments in the market?
N/A
9. What pricing options are available for accessing the report?
Pricing options include single-user, multi-user, and enterprise licenses priced at USD 4750, USD 5250, and USD 8750 respectively.
10. Is the market size provided in terms of value or volume?
The market size is provided in terms of value, measured in billion and volume, measured in K Tons.
11. Are there any specific market keywords associated with the report?
Yes, the market keyword associated with the report is "Bio-based Resins Industry," which aids in identifying and referencing the specific market segment covered.
12. How do I determine which pricing option suits my needs best?
The pricing options vary based on user requirements and access needs. Individual users may opt for single-user licenses, while businesses requiring broader access may choose multi-user or enterprise licenses for cost-effective access to the report.
13. Are there any additional resources or data provided in the Bio-based Resins Industry report?
While the report offers comprehensive insights, it's advisable to review the specific contents or supplementary materials provided to ascertain if additional resources or data are available.
14. How can I stay updated on further developments or reports in the Bio-based Resins Industry?
To stay informed about further developments, trends, and reports in the Bio-based Resins Industry, consider subscribing to industry newsletters, following relevant companies and organizations, or regularly checking reputable industry news sources and publications.
Methodology
Step 1 - Identification of Relevant Samples Size from Population Database


Step 2 - Approaches for Defining Global Market Size (Value, Volume* & Price*)

Note*: In applicable scenarios
Step 3 - Data Sources
Primary Research
- Web Analytics
- Survey Reports
- Research Institute
- Latest Research Reports
- Opinion Leaders
Secondary Research
- Annual Reports
- White Paper
- Latest Press Release
- Industry Association
- Paid Database
- Investor Presentations

Step 4 - Data Triangulation
Involves using different sources of information in order to increase the validity of a study
These sources are likely to be stakeholders in a program - participants, other researchers, program staff, other community members, and so on.
Then we put all data in single framework & apply various statistical tools to find out the dynamic on the market.
During the analysis stage, feedback from the stakeholder groups would be compared to determine areas of agreement as well as areas of divergence