

Key Insights
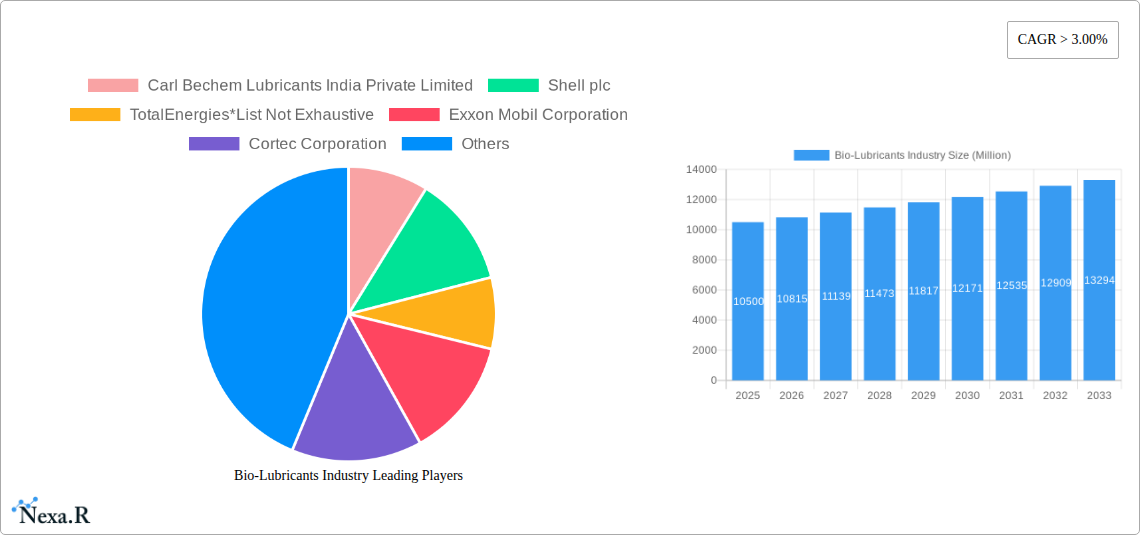
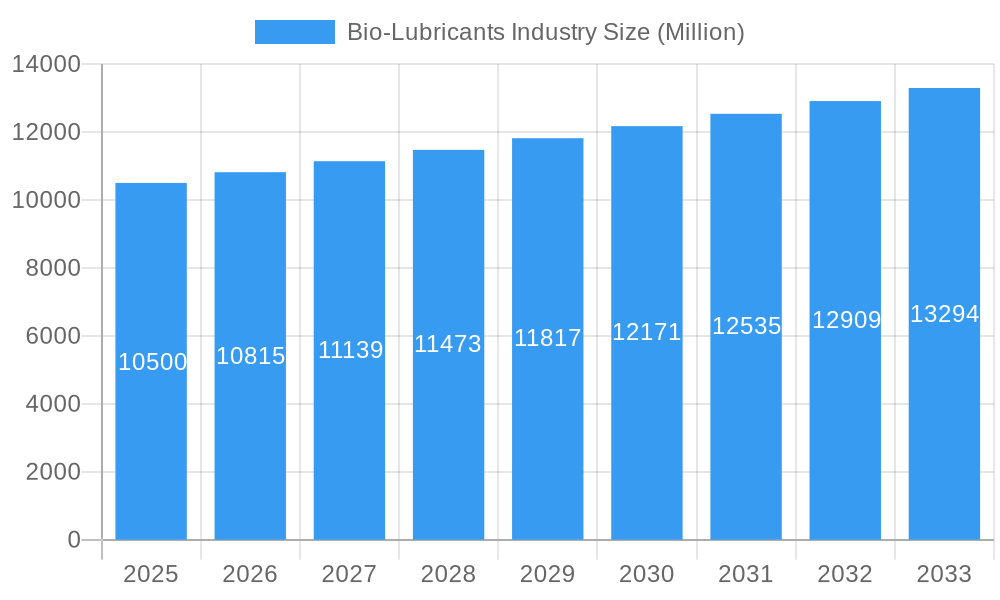
The global Bio-Lubricants market is poised for significant expansion, projected to reach an estimated USD 10,500 Million by 2025. This growth is underpinned by a robust Compound Annual Growth Rate (CAGR) exceeding 3.00% over the forecast period of 2025-2033. This upward trajectory is primarily driven by escalating environmental consciousness, stringent government regulations promoting the use of sustainable products, and a growing demand from key end-user industries like Automotive and Other Transportation, Power Generation, and Metallurgy & Metalworking. The shift towards eco-friendly alternatives for conventional petroleum-based lubricants is a pivotal factor, with industries seeking to reduce their carbon footprint and comply with increasingly demanding environmental standards. Furthermore, advancements in bio-lubricant formulations, enhancing their performance characteristics such as biodegradability, low toxicity, and superior lubrication, are further fueling market adoption. The market's segmentation reveals a diverse landscape, with Engine Oil and Transmission and Hydraulic Fluids leading the product type categories, while the Automotive and Other Transportation sector dominates end-user industry demand.
Bio-Lubricants Industry Market Size (In Billion)
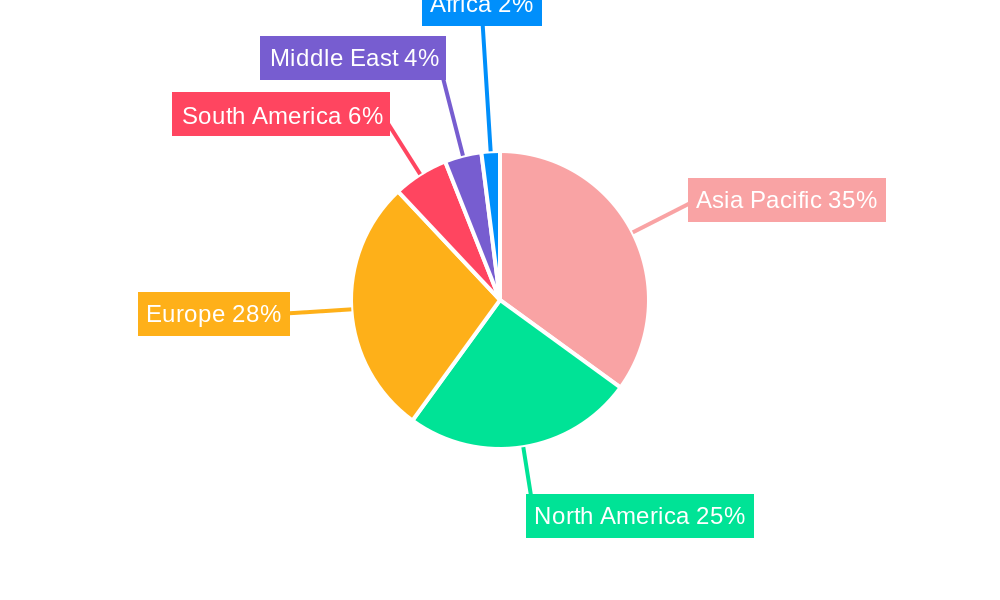
Despite the promising outlook, certain restraints could influence the market's pace. These include the comparatively higher initial cost of bio-lubricants compared to their traditional counterparts, and the ongoing need for research and development to further improve performance and expand application ranges to match or exceed conventional lubricants in all parameters. However, ongoing technological innovations and increasing economies of scale are expected to mitigate these cost barriers over time. Key players like Shell plc, Exxon Mobil Corporation, FUCHS, and Chevron Corporation are actively investing in R&D and strategic expansions, particularly in the Asia Pacific region, which is anticipated to witness substantial growth due to rapid industrialization and increasing adoption of sustainable practices. The Middle East and South America are emerging markets with considerable untapped potential, driven by a growing awareness of environmental sustainability.
Bio-Lubricants Industry Company Market Share
Comprehensive Bio-Lubricants Industry Report: Market Dynamics, Growth Trends, and Future Outlook (2019-2033)
This in-depth report provides a thorough analysis of the global bio-lubricants market, exploring its intricate dynamics, growth trajectory, and future potential from 2019 to 2033. With a base year of 2025 and a forecast period extending to 2033, this research offers critical insights for stakeholders seeking to understand and capitalize on the burgeoning demand for sustainable lubrication solutions. The report delves into parent and child market segments, meticulously dissecting product types and end-user industries to offer a granular view of market evolution. All values are presented in Million units for clear quantitative analysis.
Bio-Lubricants Industry Market Dynamics & Structure
The bio-lubricants industry is characterized by a moderate market concentration, with leading players actively investing in research and development to drive technological innovation. Key drivers include stringent environmental regulations and growing consumer demand for eco-friendly alternatives to conventional petroleum-based lubricants. Regulatory frameworks, such as those promoting biodegradability and reduced toxicity, are significantly shaping product development and market entry strategies. Competitive product substitutes, primarily from conventional lubricants, present a challenge, but the superior environmental profile and specialized performance of bio-lubricants are carving out significant market share. End-user demographics are shifting towards industries with a strong corporate social responsibility focus, including power generation, automotive, and food & beverage. Mergers and acquisitions (M&A) trends are notable, with larger chemical and energy companies acquiring smaller bio-lubricant specialists to expand their sustainable product portfolios.
- Market Concentration: Moderate, with a few dominant global players and a growing number of specialized niche manufacturers.
- Technological Innovation Drivers: Growing awareness of environmental impact, regulatory push for biodegradability, and advancements in esterification and base oil formulations.
- Regulatory Frameworks: Increasingly stringent emissions standards and mandates for eco-certified products in various regions.
- Competitive Product Substitutes: Conventional mineral oil-based lubricants, offering lower initial cost but higher environmental impact.
- End-User Demographics: Increasing adoption in sensitive applications like food processing and environmentally protected areas.
- M&A Trends: Strategic acquisitions by major oil and gas companies to gain access to bio-lubricant technologies and markets.
Bio-Lubricants Industry Growth Trends & Insights
The global bio-lubricants market is poised for substantial growth, driven by a confluence of factors including increasing environmental consciousness, supportive government policies, and advancements in bio-based feedstock technologies. The market size is projected to witness a robust Compound Annual Growth Rate (CAGR) of approximately 7.8% during the forecast period (2025-2033). Adoption rates of bio-lubricants are steadily rising across diverse end-user industries as companies seek to reduce their carbon footprint and comply with sustainability mandates. Technological disruptions, such as the development of high-performance bio-based synthetic lubricants and improved manufacturing processes, are further enhancing their competitiveness against conventional alternatives. Consumer behavior shifts, influenced by a growing preference for ethically sourced and environmentally friendly products, are compelling businesses to integrate bio-lubricants into their operational strategies. The market penetration of bio-lubricants, while still lower than conventional oils, is expanding rapidly, especially in applications where environmental impact is a critical concern. The base year (2025) estimates the market value at approximately $15,000 million, with a projected increase to over $26,000 million by 2033. The historical period (2019-2024) showcased a consistent upward trend, laying the foundation for this accelerated growth.
Dominant Regions, Countries, or Segments in Bio-Lubricants Industry
The Automotive and Other Transportation segment, particularly within the Engine Oil and Transmission and Hydraulic Fluid product types, is a significant growth driver for the bio-lubricants industry. This dominance is fueled by stringent emission regulations in major automotive markets and a growing consumer preference for sustainable transportation solutions. Regions with robust automotive manufacturing sectors and high environmental awareness, such as North America and Europe, are at the forefront of bio-lubricant adoption in this segment. Economic policies that incentivize the use of eco-friendly lubricants and the development of advanced bio-based engine oils with comparable or superior performance to conventional oils are key factors.
Dominant Segment (Product Type): Engine Oil and Transmission and Hydraulic Fluid.
- Key Drivers: Stringent automotive emission standards (e.g., Euro 7, CAFE standards), growing demand for fuel-efficient and environmentally conscious vehicles, and advancements in bio-lubricant formulations offering comparable performance to mineral oils.
- Market Share Potential: Projected to hold over 40% of the total bio-lubricants market by 2033.
- Growth Potential: High, driven by OEM partnerships and consumer awareness campaigns.
Dominant End-user Industry: Automotive and Other Transportation.
- Key Drivers: Electrification of vehicles creating new lubrication demands, increasing focus on life-cycle assessment in automotive manufacturing, and the need for lubricants that can operate efficiently in a wider temperature range.
- Market Share Potential: Significant, with a projected growth rate of 8.5% CAGR.
- Growth Potential: Excellent, supported by ongoing innovation in both internal combustion engine (ICE) and electric vehicle (EV) lubrication.
Beyond automotive, the Heavy Equipment sector, particularly in Gear Oil and General Industrial Oil applications, is showing considerable growth. This is due to the demanding operating conditions and the potential for significant environmental impact from leaks and spills in mining, construction, and agriculture.
Bio-Lubricants Industry Product Landscape
The bio-lubricants industry is witnessing a rapid evolution in its product landscape, driven by innovations in base oil formulations and additive technologies. Biodegradable engine oils designed for passenger cars and heavy-duty vehicles are gaining traction due to their reduced environmental impact in case of spills. Advanced bio-based transmission and hydraulic fluids are offering enhanced thermal stability and improved lubrication properties, making them suitable for demanding industrial applications. Metalworking fluids derived from plant-based oils are providing superior cooling and lubrication while minimizing worker exposure to harmful chemicals. General industrial oils, greases, and process oils are also seeing a surge in bio-based alternatives, catering to a wider range of machinery and operational requirements. Unique selling propositions include enhanced biodegradability, reduced toxicity, and, in some cases, superior lubricity and operating temperatures compared to their petrochemical counterparts. Technological advancements are focused on improving oxidation stability, low-temperature performance, and overall longevity to match or exceed the performance of conventional lubricants, with expected market value of $8,500 Million in 2025 for Engine Oils and Transmission and Hydraulic Fluids combined.
Key Drivers, Barriers & Challenges in Bio-Lubricants Industry
The bio-lubricants industry is propelled by several key drivers, most notably the increasing global emphasis on environmental sustainability and stringent government regulations promoting the use of eco-friendly products. Technological advancements in producing high-performance bio-based base oils from renewable resources like vegetable oils and animal fats are crucial. Growing consumer awareness and corporate social responsibility initiatives further fuel demand for biodegradable and less toxic lubrication solutions.
However, the industry faces significant barriers and challenges. The primary challenge remains the higher cost of bio-lubricants compared to conventional mineral oil-based lubricants, impacting price-sensitive markets. Supply chain volatility and consistency of feedstock availability can also pose issues. Regulatory hurdles, though often drivers, can also create complexity in product standardization and certification across different regions. Furthermore, limited awareness among some industrial end-users about the performance and benefits of bio-lubricants hinders broader adoption.
Key Drivers:
- Environmental Regulations: Mandates for biodegradability and reduced toxicity.
- Sustainability Initiatives: Corporate ESG (Environmental, Social, and Governance) goals.
- Technological Advancements: Improved feedstock processing and additive technologies.
- Consumer Demand: Growing preference for eco-friendly products.
Barriers & Challenges:
- Higher Cost: Compared to conventional mineral oil lubricants.
- Feedstock Availability & Volatility: Potential supply chain disruptions.
- Performance Perceptions: Overcoming the perception that bio-lubricants are less performant.
- Limited Awareness: In certain industrial sectors.
Emerging Opportunities in Bio-Lubricants Industry
Emerging opportunities in the bio-lubricants industry are significant and diverse. The growing demand for lubricants in the marine sector, where environmental protection is paramount, presents a substantial untapped market. Innovative applications in the aerospace industry, focusing on lightweight and high-performance bio-lubricants, are also gaining traction. The food and beverage industry continues to be a strong growth area, driven by strict hygiene standards and the need for food-grade lubricants. Furthermore, the development of advanced bio-lubricants for electric vehicles (EVs), specifically for thermal management and component protection, represents a rapidly expanding niche. Evolving consumer preferences for ethically sourced and sustainable products are also creating opportunities for brands that can effectively communicate their eco-friendly credentials.
Growth Accelerators in the Bio-Lubricants Industry Industry
Several growth accelerators are poised to significantly boost the bio-lubricants industry. Technological breakthroughs in bio-refining and the development of novel bio-based base stocks with enhanced properties like superior oxidation stability and lower pour points are critical. Strategic partnerships between bio-lubricant manufacturers, raw material suppliers, and major end-users are crucial for market penetration and product validation. Market expansion strategies targeting developing economies with increasing environmental awareness and stringent regulations will also drive growth. The continuous innovation in additive packages to enhance the performance and lifespan of bio-lubricants, making them directly competitive with or superior to conventional lubricants, will be a key accelerator.
Key Players Shaping the Bio-Lubricants Industry Market
- Carl Bechem Lubricants India Private Limited
- Shell plc
- TotalEnergies
- Exxon Mobil Corporation
- Cortec Corporation
- FUCHS
- Cargill
- KCM Petro Chemicals
- Chevron Corporation
- Novvi LLC
- Axel Christiernsson
- Environmental Lubricants Manufacturing Inc
- PANOLIN AG
- BP p l c
Notable Milestones in Bio-Lubricants Industry Sector
- November 2022: Wholly-owned subsidiaries of Shell plc in Switzerland, the United Kingdom, the United States, and Sweden entered into agreements to acquire the environmentally considerate lubricants (ECLs) business of the Panolin Group. This transaction brings with it an offering of biodegradable lubricants, enhancing Shell's sustainable product portfolio.
- February 2022: BP acquired a 30% stake in Green Biofuels Ltd and will collaborate to help decarbonize enterprises in the construction, freight, off-road, and maritime sectors. Renewable hydrogenated vegetable oil (HVO) fuels from green biofuels can be utilized as a direct replacement for diesel, indirectly promoting the use of bio-based solutions in transportation.
In-Depth Bio-Lubricants Industry Market Outlook
The future outlook for the bio-lubricants industry is exceptionally promising, driven by an unwavering commitment to sustainability and ongoing technological advancements. Growth accelerators such as the development of high-performance bio-synthetic base stocks and the increasing adoption of bio-lubricants in niche yet high-value applications like marine and aerospace will continue to shape the market. Strategic collaborations between lubricant manufacturers, raw material providers, and end-users will foster innovation and expand market reach. The market is expected to witness robust growth, with the global bio-lubricants market size projected to reach approximately $26,000 million by 2033, indicating significant future potential and strategic opportunities for stakeholders investing in this sustainable sector.
Bio-Lubricants Industry Segmentation
-
1. Product Type
- 1.1. Engine Oil
- 1.2. Transmission and Hydraulic Fluid
- 1.3. Metalworking Fluid
- 1.4. General Industrial Oil
- 1.5. Gear Oil
- 1.6. Grease
- 1.7. Process Oil
- 1.8. Other Product Types
-
2. End-user Industry
- 2.1. Power Generation
- 2.2. Automotive and Other Transportation
- 2.3. Heavy Equipment
- 2.4. Food & Beverage
- 2.5. Metallurgy & Metalworking
- 2.6. Chemical Manufacturing
- 2.7. Other End-user Industries
Bio-Lubricants Industry Segmentation By Geography
-
1. Asia Pacific
- 1.1. China
- 1.2. India
- 1.3. Japan
- 1.4. South Korea
- 1.5. Rest of Asia Pacific
-
2. North America
- 2.1. United States
- 2.2. Canada
- 2.3. Mexico
- 2.4. Rest of North America
-
3. Europe
- 3.1. Germany
- 3.2. United Kingdom
- 3.3. Italy
- 3.4. France
- 3.5. Russia
- 3.6. Rest of Europe
-
4. South America
- 4.1. Brazil
- 4.2. Argentina
- 4.3. Rest of South America
- 5. Middle East
-
6. Saudi Arabia
- 6.1. South Africa
- 6.2. United Arab Emirates
- 6.3. Rest of Middle East
Bio-Lubricants Industry Regional Market Share
Geographic Coverage of Bio-Lubricants Industry
Bio-Lubricants Industry REPORT HIGHLIGHTS
| Aspects | Details |
|---|---|
| Study Period | 2020-2034 |
| Base Year | 2025 |
| Estimated Year | 2026 |
| Forecast Period | 2026-2034 |
| Historical Period | 2020-2025 |
| Growth Rate | CAGR of > 3.00% from 2020-2034 |
| Segmentation |
|
Table of Contents
- 1. Introduction
- 1.1. Research Scope
- 1.2. Market Segmentation
- 1.3. Research Objective
- 1.4. Definitions and Assumptions
- 2. Executive Summary
- 2.1. Market Snapshot
- 3. Market Dynamics
- 3.1. Market Drivers
- 3.2. Market Restrains
- 3.3. Market Trends
- 3.4. Market Opportunities
- 4. Market Factor Analysis
- 4.1. Porters Five Forces
- 4.1.1. Bargaining Power of Suppliers
- 4.1.2. Bargaining Power of Buyers
- 4.1.3. Threat of New Entrants
- 4.1.4. Threat of Substitutes
- 4.1.5. Competitive Rivalry
- 4.2. PESTEL analysis
- 4.3. BCG Analysis
- 4.3.1. Stars (High Growth, High Market Share)
- 4.3.2. Cash Cows (Low Growth, High Market Share)
- 4.3.3. Question Mark (High Growth, Low Market Share)
- 4.3.4. Dogs (Low Growth, Low Market Share)
- 4.4. Ansoff Matrix Analysis
- 4.5. Supply Chain Analysis
- 4.6. Regulatory Landscape
- 4.7. Current Market Potential and Opportunity Assessment (TAM–SAM–SOM Framework)
- 4.8. NRP Analyst Note
- 4.1. Porters Five Forces
- 5. Market Analysis, Insights and Forecast 2021-2033
- 5.1. Market Analysis, Insights and Forecast - by Product Type
- 5.1.1. Engine Oil
- 5.1.2. Transmission and Hydraulic Fluid
- 5.1.3. Metalworking Fluid
- 5.1.4. General Industrial Oil
- 5.1.5. Gear Oil
- 5.1.6. Grease
- 5.1.7. Process Oil
- 5.1.8. Other Product Types
- 5.2. Market Analysis, Insights and Forecast - by End-user Industry
- 5.2.1. Power Generation
- 5.2.2. Automotive and Other Transportation
- 5.2.3. Heavy Equipment
- 5.2.4. Food & Beverage
- 5.2.5. Metallurgy & Metalworking
- 5.2.6. Chemical Manufacturing
- 5.2.7. Other End-user Industries
- 5.3. Market Analysis, Insights and Forecast - by Region
- 5.3.1. Asia Pacific
- 5.3.2. North America
- 5.3.3. Europe
- 5.3.4. South America
- 5.3.5. Middle East
- 5.3.6. Saudi Arabia
- 5.1. Market Analysis, Insights and Forecast - by Product Type
- 6. Global Bio-Lubricants Industry Analysis, Insights and Forecast, 2021-2033
- 6.1. Market Analysis, Insights and Forecast - by Product Type
- 6.1.1. Engine Oil
- 6.1.2. Transmission and Hydraulic Fluid
- 6.1.3. Metalworking Fluid
- 6.1.4. General Industrial Oil
- 6.1.5. Gear Oil
- 6.1.6. Grease
- 6.1.7. Process Oil
- 6.1.8. Other Product Types
- 6.2. Market Analysis, Insights and Forecast - by End-user Industry
- 6.2.1. Power Generation
- 6.2.2. Automotive and Other Transportation
- 6.2.3. Heavy Equipment
- 6.2.4. Food & Beverage
- 6.2.5. Metallurgy & Metalworking
- 6.2.6. Chemical Manufacturing
- 6.2.7. Other End-user Industries
- 6.1. Market Analysis, Insights and Forecast - by Product Type
- 7. Asia Pacific Bio-Lubricants Industry Analysis, Insights and Forecast, 2020-2032
- 7.1. Market Analysis, Insights and Forecast - by Product Type
- 7.1.1. Engine Oil
- 7.1.2. Transmission and Hydraulic Fluid
- 7.1.3. Metalworking Fluid
- 7.1.4. General Industrial Oil
- 7.1.5. Gear Oil
- 7.1.6. Grease
- 7.1.7. Process Oil
- 7.1.8. Other Product Types
- 7.2. Market Analysis, Insights and Forecast - by End-user Industry
- 7.2.1. Power Generation
- 7.2.2. Automotive and Other Transportation
- 7.2.3. Heavy Equipment
- 7.2.4. Food & Beverage
- 7.2.5. Metallurgy & Metalworking
- 7.2.6. Chemical Manufacturing
- 7.2.7. Other End-user Industries
- 7.1. Market Analysis, Insights and Forecast - by Product Type
- 8. North America Bio-Lubricants Industry Analysis, Insights and Forecast, 2020-2032
- 8.1. Market Analysis, Insights and Forecast - by Product Type
- 8.1.1. Engine Oil
- 8.1.2. Transmission and Hydraulic Fluid
- 8.1.3. Metalworking Fluid
- 8.1.4. General Industrial Oil
- 8.1.5. Gear Oil
- 8.1.6. Grease
- 8.1.7. Process Oil
- 8.1.8. Other Product Types
- 8.2. Market Analysis, Insights and Forecast - by End-user Industry
- 8.2.1. Power Generation
- 8.2.2. Automotive and Other Transportation
- 8.2.3. Heavy Equipment
- 8.2.4. Food & Beverage
- 8.2.5. Metallurgy & Metalworking
- 8.2.6. Chemical Manufacturing
- 8.2.7. Other End-user Industries
- 8.1. Market Analysis, Insights and Forecast - by Product Type
- 9. Europe Bio-Lubricants Industry Analysis, Insights and Forecast, 2020-2032
- 9.1. Market Analysis, Insights and Forecast - by Product Type
- 9.1.1. Engine Oil
- 9.1.2. Transmission and Hydraulic Fluid
- 9.1.3. Metalworking Fluid
- 9.1.4. General Industrial Oil
- 9.1.5. Gear Oil
- 9.1.6. Grease
- 9.1.7. Process Oil
- 9.1.8. Other Product Types
- 9.2. Market Analysis, Insights and Forecast - by End-user Industry
- 9.2.1. Power Generation
- 9.2.2. Automotive and Other Transportation
- 9.2.3. Heavy Equipment
- 9.2.4. Food & Beverage
- 9.2.5. Metallurgy & Metalworking
- 9.2.6. Chemical Manufacturing
- 9.2.7. Other End-user Industries
- 9.1. Market Analysis, Insights and Forecast - by Product Type
- 10. South America Bio-Lubricants Industry Analysis, Insights and Forecast, 2020-2032
- 10.1. Market Analysis, Insights and Forecast - by Product Type
- 10.1.1. Engine Oil
- 10.1.2. Transmission and Hydraulic Fluid
- 10.1.3. Metalworking Fluid
- 10.1.4. General Industrial Oil
- 10.1.5. Gear Oil
- 10.1.6. Grease
- 10.1.7. Process Oil
- 10.1.8. Other Product Types
- 10.2. Market Analysis, Insights and Forecast - by End-user Industry
- 10.2.1. Power Generation
- 10.2.2. Automotive and Other Transportation
- 10.2.3. Heavy Equipment
- 10.2.4. Food & Beverage
- 10.2.5. Metallurgy & Metalworking
- 10.2.6. Chemical Manufacturing
- 10.2.7. Other End-user Industries
- 10.1. Market Analysis, Insights and Forecast - by Product Type
- 11. Middle East Bio-Lubricants Industry Analysis, Insights and Forecast, 2020-2032
- 11.1. Market Analysis, Insights and Forecast - by Product Type
- 11.1.1. Engine Oil
- 11.1.2. Transmission and Hydraulic Fluid
- 11.1.3. Metalworking Fluid
- 11.1.4. General Industrial Oil
- 11.1.5. Gear Oil
- 11.1.6. Grease
- 11.1.7. Process Oil
- 11.1.8. Other Product Types
- 11.2. Market Analysis, Insights and Forecast - by End-user Industry
- 11.2.1. Power Generation
- 11.2.2. Automotive and Other Transportation
- 11.2.3. Heavy Equipment
- 11.2.4. Food & Beverage
- 11.2.5. Metallurgy & Metalworking
- 11.2.6. Chemical Manufacturing
- 11.2.7. Other End-user Industries
- 11.1. Market Analysis, Insights and Forecast - by Product Type
- 12. Saudi Arabia Bio-Lubricants Industry Analysis, Insights and Forecast, 2020-2032
- 12.1. Market Analysis, Insights and Forecast - by Product Type
- 12.1.1. Engine Oil
- 12.1.2. Transmission and Hydraulic Fluid
- 12.1.3. Metalworking Fluid
- 12.1.4. General Industrial Oil
- 12.1.5. Gear Oil
- 12.1.6. Grease
- 12.1.7. Process Oil
- 12.1.8. Other Product Types
- 12.2. Market Analysis, Insights and Forecast - by End-user Industry
- 12.2.1. Power Generation
- 12.2.2. Automotive and Other Transportation
- 12.2.3. Heavy Equipment
- 12.2.4. Food & Beverage
- 12.2.5. Metallurgy & Metalworking
- 12.2.6. Chemical Manufacturing
- 12.2.7. Other End-user Industries
- 12.1. Market Analysis, Insights and Forecast - by Product Type
- 13. Competitive Analysis
- 13.1. Company Profiles
- 13.1.1 Carl Bechem Lubricants India Private Limited
- 13.1.1.1. Company Overview
- 13.1.1.2. Products
- 13.1.1.3. Company Financials
- 13.1.1.4. SWOT Analysis
- 13.1.2 Shell plc
- 13.1.2.1. Company Overview
- 13.1.2.2. Products
- 13.1.2.3. Company Financials
- 13.1.2.4. SWOT Analysis
- 13.1.3 TotalEnergies*List Not Exhaustive
- 13.1.3.1. Company Overview
- 13.1.3.2. Products
- 13.1.3.3. Company Financials
- 13.1.3.4. SWOT Analysis
- 13.1.4 Exxon Mobil Corporation
- 13.1.4.1. Company Overview
- 13.1.4.2. Products
- 13.1.4.3. Company Financials
- 13.1.4.4. SWOT Analysis
- 13.1.5 Cortec Corporation
- 13.1.5.1. Company Overview
- 13.1.5.2. Products
- 13.1.5.3. Company Financials
- 13.1.5.4. SWOT Analysis
- 13.1.6 FUCHS
- 13.1.6.1. Company Overview
- 13.1.6.2. Products
- 13.1.6.3. Company Financials
- 13.1.6.4. SWOT Analysis
- 13.1.7 Cargill
- 13.1.7.1. Company Overview
- 13.1.7.2. Products
- 13.1.7.3. Company Financials
- 13.1.7.4. SWOT Analysis
- 13.1.8 KCM Petro Chemicals
- 13.1.8.1. Company Overview
- 13.1.8.2. Products
- 13.1.8.3. Company Financials
- 13.1.8.4. SWOT Analysis
- 13.1.9 Chevron Corporation
- 13.1.9.1. Company Overview
- 13.1.9.2. Products
- 13.1.9.3. Company Financials
- 13.1.9.4. SWOT Analysis
- 13.1.10 Novvi LLC
- 13.1.10.1. Company Overview
- 13.1.10.2. Products
- 13.1.10.3. Company Financials
- 13.1.10.4. SWOT Analysis
- 13.1.11 Axel Christiernsson
- 13.1.11.1. Company Overview
- 13.1.11.2. Products
- 13.1.11.3. Company Financials
- 13.1.11.4. SWOT Analysis
- 13.1.12 Environmental Lubricants Manufacturing Inc
- 13.1.12.1. Company Overview
- 13.1.12.2. Products
- 13.1.12.3. Company Financials
- 13.1.12.4. SWOT Analysis
- 13.1.13 PANOLIN AG
- 13.1.13.1. Company Overview
- 13.1.13.2. Products
- 13.1.13.3. Company Financials
- 13.1.13.4. SWOT Analysis
- 13.1.14 BP p l c
- 13.1.14.1. Company Overview
- 13.1.14.2. Products
- 13.1.14.3. Company Financials
- 13.1.14.4. SWOT Analysis
- 13.1.1 Carl Bechem Lubricants India Private Limited
- 13.2. Market Entropy
- 13.2.1 Company's Key Areas Served
- 13.2.2 Recent Developments
- 13.3. Company Market Share Analysis 2025
- 13.3.1 Top 5 Companies Market Share Analysis
- 13.3.2 Top 3 Companies Market Share Analysis
- 13.4. List of Potential Customers
- 14. Research Methodology
List of Figures
- Figure 1: Global Bio-Lubricants Industry Revenue Breakdown (Million, %) by Region 2025 & 2033
- Figure 2: Global Bio-Lubricants Industry Volume Breakdown (K Tons, %) by Region 2025 & 2033
- Figure 3: Asia Pacific Bio-Lubricants Industry Revenue (Million), by Product Type 2025 & 2033
- Figure 4: Asia Pacific Bio-Lubricants Industry Volume (K Tons), by Product Type 2025 & 2033
- Figure 5: Asia Pacific Bio-Lubricants Industry Revenue Share (%), by Product Type 2025 & 2033
- Figure 6: Asia Pacific Bio-Lubricants Industry Volume Share (%), by Product Type 2025 & 2033
- Figure 7: Asia Pacific Bio-Lubricants Industry Revenue (Million), by End-user Industry 2025 & 2033
- Figure 8: Asia Pacific Bio-Lubricants Industry Volume (K Tons), by End-user Industry 2025 & 2033
- Figure 9: Asia Pacific Bio-Lubricants Industry Revenue Share (%), by End-user Industry 2025 & 2033
- Figure 10: Asia Pacific Bio-Lubricants Industry Volume Share (%), by End-user Industry 2025 & 2033
- Figure 11: Asia Pacific Bio-Lubricants Industry Revenue (Million), by Country 2025 & 2033
- Figure 12: Asia Pacific Bio-Lubricants Industry Volume (K Tons), by Country 2025 & 2033
- Figure 13: Asia Pacific Bio-Lubricants Industry Revenue Share (%), by Country 2025 & 2033
- Figure 14: Asia Pacific Bio-Lubricants Industry Volume Share (%), by Country 2025 & 2033
- Figure 15: North America Bio-Lubricants Industry Revenue (Million), by Product Type 2025 & 2033
- Figure 16: North America Bio-Lubricants Industry Volume (K Tons), by Product Type 2025 & 2033
- Figure 17: North America Bio-Lubricants Industry Revenue Share (%), by Product Type 2025 & 2033
- Figure 18: North America Bio-Lubricants Industry Volume Share (%), by Product Type 2025 & 2033
- Figure 19: North America Bio-Lubricants Industry Revenue (Million), by End-user Industry 2025 & 2033
- Figure 20: North America Bio-Lubricants Industry Volume (K Tons), by End-user Industry 2025 & 2033
- Figure 21: North America Bio-Lubricants Industry Revenue Share (%), by End-user Industry 2025 & 2033
- Figure 22: North America Bio-Lubricants Industry Volume Share (%), by End-user Industry 2025 & 2033
- Figure 23: North America Bio-Lubricants Industry Revenue (Million), by Country 2025 & 2033
- Figure 24: North America Bio-Lubricants Industry Volume (K Tons), by Country 2025 & 2033
- Figure 25: North America Bio-Lubricants Industry Revenue Share (%), by Country 2025 & 2033
- Figure 26: North America Bio-Lubricants Industry Volume Share (%), by Country 2025 & 2033
- Figure 27: Europe Bio-Lubricants Industry Revenue (Million), by Product Type 2025 & 2033
- Figure 28: Europe Bio-Lubricants Industry Volume (K Tons), by Product Type 2025 & 2033
- Figure 29: Europe Bio-Lubricants Industry Revenue Share (%), by Product Type 2025 & 2033
- Figure 30: Europe Bio-Lubricants Industry Volume Share (%), by Product Type 2025 & 2033
- Figure 31: Europe Bio-Lubricants Industry Revenue (Million), by End-user Industry 2025 & 2033
- Figure 32: Europe Bio-Lubricants Industry Volume (K Tons), by End-user Industry 2025 & 2033
- Figure 33: Europe Bio-Lubricants Industry Revenue Share (%), by End-user Industry 2025 & 2033
- Figure 34: Europe Bio-Lubricants Industry Volume Share (%), by End-user Industry 2025 & 2033
- Figure 35: Europe Bio-Lubricants Industry Revenue (Million), by Country 2025 & 2033
- Figure 36: Europe Bio-Lubricants Industry Volume (K Tons), by Country 2025 & 2033
- Figure 37: Europe Bio-Lubricants Industry Revenue Share (%), by Country 2025 & 2033
- Figure 38: Europe Bio-Lubricants Industry Volume Share (%), by Country 2025 & 2033
- Figure 39: South America Bio-Lubricants Industry Revenue (Million), by Product Type 2025 & 2033
- Figure 40: South America Bio-Lubricants Industry Volume (K Tons), by Product Type 2025 & 2033
- Figure 41: South America Bio-Lubricants Industry Revenue Share (%), by Product Type 2025 & 2033
- Figure 42: South America Bio-Lubricants Industry Volume Share (%), by Product Type 2025 & 2033
- Figure 43: South America Bio-Lubricants Industry Revenue (Million), by End-user Industry 2025 & 2033
- Figure 44: South America Bio-Lubricants Industry Volume (K Tons), by End-user Industry 2025 & 2033
- Figure 45: South America Bio-Lubricants Industry Revenue Share (%), by End-user Industry 2025 & 2033
- Figure 46: South America Bio-Lubricants Industry Volume Share (%), by End-user Industry 2025 & 2033
- Figure 47: South America Bio-Lubricants Industry Revenue (Million), by Country 2025 & 2033
- Figure 48: South America Bio-Lubricants Industry Volume (K Tons), by Country 2025 & 2033
- Figure 49: South America Bio-Lubricants Industry Revenue Share (%), by Country 2025 & 2033
- Figure 50: South America Bio-Lubricants Industry Volume Share (%), by Country 2025 & 2033
- Figure 51: Middle East Bio-Lubricants Industry Revenue (Million), by Product Type 2025 & 2033
- Figure 52: Middle East Bio-Lubricants Industry Volume (K Tons), by Product Type 2025 & 2033
- Figure 53: Middle East Bio-Lubricants Industry Revenue Share (%), by Product Type 2025 & 2033
- Figure 54: Middle East Bio-Lubricants Industry Volume Share (%), by Product Type 2025 & 2033
- Figure 55: Middle East Bio-Lubricants Industry Revenue (Million), by End-user Industry 2025 & 2033
- Figure 56: Middle East Bio-Lubricants Industry Volume (K Tons), by End-user Industry 2025 & 2033
- Figure 57: Middle East Bio-Lubricants Industry Revenue Share (%), by End-user Industry 2025 & 2033
- Figure 58: Middle East Bio-Lubricants Industry Volume Share (%), by End-user Industry 2025 & 2033
- Figure 59: Middle East Bio-Lubricants Industry Revenue (Million), by Country 2025 & 2033
- Figure 60: Middle East Bio-Lubricants Industry Volume (K Tons), by Country 2025 & 2033
- Figure 61: Middle East Bio-Lubricants Industry Revenue Share (%), by Country 2025 & 2033
- Figure 62: Middle East Bio-Lubricants Industry Volume Share (%), by Country 2025 & 2033
- Figure 63: Saudi Arabia Bio-Lubricants Industry Revenue (Million), by Product Type 2025 & 2033
- Figure 64: Saudi Arabia Bio-Lubricants Industry Volume (K Tons), by Product Type 2025 & 2033
- Figure 65: Saudi Arabia Bio-Lubricants Industry Revenue Share (%), by Product Type 2025 & 2033
- Figure 66: Saudi Arabia Bio-Lubricants Industry Volume Share (%), by Product Type 2025 & 2033
- Figure 67: Saudi Arabia Bio-Lubricants Industry Revenue (Million), by End-user Industry 2025 & 2033
- Figure 68: Saudi Arabia Bio-Lubricants Industry Volume (K Tons), by End-user Industry 2025 & 2033
- Figure 69: Saudi Arabia Bio-Lubricants Industry Revenue Share (%), by End-user Industry 2025 & 2033
- Figure 70: Saudi Arabia Bio-Lubricants Industry Volume Share (%), by End-user Industry 2025 & 2033
- Figure 71: Saudi Arabia Bio-Lubricants Industry Revenue (Million), by Country 2025 & 2033
- Figure 72: Saudi Arabia Bio-Lubricants Industry Volume (K Tons), by Country 2025 & 2033
- Figure 73: Saudi Arabia Bio-Lubricants Industry Revenue Share (%), by Country 2025 & 2033
- Figure 74: Saudi Arabia Bio-Lubricants Industry Volume Share (%), by Country 2025 & 2033
List of Tables
- Table 1: Global Bio-Lubricants Industry Revenue Million Forecast, by Product Type 2020 & 2033
- Table 2: Global Bio-Lubricants Industry Volume K Tons Forecast, by Product Type 2020 & 2033
- Table 3: Global Bio-Lubricants Industry Revenue Million Forecast, by End-user Industry 2020 & 2033
- Table 4: Global Bio-Lubricants Industry Volume K Tons Forecast, by End-user Industry 2020 & 2033
- Table 5: Global Bio-Lubricants Industry Revenue Million Forecast, by Region 2020 & 2033
- Table 6: Global Bio-Lubricants Industry Volume K Tons Forecast, by Region 2020 & 2033
- Table 7: Global Bio-Lubricants Industry Revenue Million Forecast, by Product Type 2020 & 2033
- Table 8: Global Bio-Lubricants Industry Volume K Tons Forecast, by Product Type 2020 & 2033
- Table 9: Global Bio-Lubricants Industry Revenue Million Forecast, by End-user Industry 2020 & 2033
- Table 10: Global Bio-Lubricants Industry Volume K Tons Forecast, by End-user Industry 2020 & 2033
- Table 11: Global Bio-Lubricants Industry Revenue Million Forecast, by Country 2020 & 2033
- Table 12: Global Bio-Lubricants Industry Volume K Tons Forecast, by Country 2020 & 2033
- Table 13: China Bio-Lubricants Industry Revenue (Million) Forecast, by Application 2020 & 2033
- Table 14: China Bio-Lubricants Industry Volume (K Tons) Forecast, by Application 2020 & 2033
- Table 15: India Bio-Lubricants Industry Revenue (Million) Forecast, by Application 2020 & 2033
- Table 16: India Bio-Lubricants Industry Volume (K Tons) Forecast, by Application 2020 & 2033
- Table 17: Japan Bio-Lubricants Industry Revenue (Million) Forecast, by Application 2020 & 2033
- Table 18: Japan Bio-Lubricants Industry Volume (K Tons) Forecast, by Application 2020 & 2033
- Table 19: South Korea Bio-Lubricants Industry Revenue (Million) Forecast, by Application 2020 & 2033
- Table 20: South Korea Bio-Lubricants Industry Volume (K Tons) Forecast, by Application 2020 & 2033
- Table 21: Rest of Asia Pacific Bio-Lubricants Industry Revenue (Million) Forecast, by Application 2020 & 2033
- Table 22: Rest of Asia Pacific Bio-Lubricants Industry Volume (K Tons) Forecast, by Application 2020 & 2033
- Table 23: Global Bio-Lubricants Industry Revenue Million Forecast, by Product Type 2020 & 2033
- Table 24: Global Bio-Lubricants Industry Volume K Tons Forecast, by Product Type 2020 & 2033
- Table 25: Global Bio-Lubricants Industry Revenue Million Forecast, by End-user Industry 2020 & 2033
- Table 26: Global Bio-Lubricants Industry Volume K Tons Forecast, by End-user Industry 2020 & 2033
- Table 27: Global Bio-Lubricants Industry Revenue Million Forecast, by Country 2020 & 2033
- Table 28: Global Bio-Lubricants Industry Volume K Tons Forecast, by Country 2020 & 2033
- Table 29: United States Bio-Lubricants Industry Revenue (Million) Forecast, by Application 2020 & 2033
- Table 30: United States Bio-Lubricants Industry Volume (K Tons) Forecast, by Application 2020 & 2033
- Table 31: Canada Bio-Lubricants Industry Revenue (Million) Forecast, by Application 2020 & 2033
- Table 32: Canada Bio-Lubricants Industry Volume (K Tons) Forecast, by Application 2020 & 2033
- Table 33: Mexico Bio-Lubricants Industry Revenue (Million) Forecast, by Application 2020 & 2033
- Table 34: Mexico Bio-Lubricants Industry Volume (K Tons) Forecast, by Application 2020 & 2033
- Table 35: Rest of North America Bio-Lubricants Industry Revenue (Million) Forecast, by Application 2020 & 2033
- Table 36: Rest of North America Bio-Lubricants Industry Volume (K Tons) Forecast, by Application 2020 & 2033
- Table 37: Global Bio-Lubricants Industry Revenue Million Forecast, by Product Type 2020 & 2033
- Table 38: Global Bio-Lubricants Industry Volume K Tons Forecast, by Product Type 2020 & 2033
- Table 39: Global Bio-Lubricants Industry Revenue Million Forecast, by End-user Industry 2020 & 2033
- Table 40: Global Bio-Lubricants Industry Volume K Tons Forecast, by End-user Industry 2020 & 2033
- Table 41: Global Bio-Lubricants Industry Revenue Million Forecast, by Country 2020 & 2033
- Table 42: Global Bio-Lubricants Industry Volume K Tons Forecast, by Country 2020 & 2033
- Table 43: Germany Bio-Lubricants Industry Revenue (Million) Forecast, by Application 2020 & 2033
- Table 44: Germany Bio-Lubricants Industry Volume (K Tons) Forecast, by Application 2020 & 2033
- Table 45: United Kingdom Bio-Lubricants Industry Revenue (Million) Forecast, by Application 2020 & 2033
- Table 46: United Kingdom Bio-Lubricants Industry Volume (K Tons) Forecast, by Application 2020 & 2033
- Table 47: Italy Bio-Lubricants Industry Revenue (Million) Forecast, by Application 2020 & 2033
- Table 48: Italy Bio-Lubricants Industry Volume (K Tons) Forecast, by Application 2020 & 2033
- Table 49: France Bio-Lubricants Industry Revenue (Million) Forecast, by Application 2020 & 2033
- Table 50: France Bio-Lubricants Industry Volume (K Tons) Forecast, by Application 2020 & 2033
- Table 51: Russia Bio-Lubricants Industry Revenue (Million) Forecast, by Application 2020 & 2033
- Table 52: Russia Bio-Lubricants Industry Volume (K Tons) Forecast, by Application 2020 & 2033
- Table 53: Rest of Europe Bio-Lubricants Industry Revenue (Million) Forecast, by Application 2020 & 2033
- Table 54: Rest of Europe Bio-Lubricants Industry Volume (K Tons) Forecast, by Application 2020 & 2033
- Table 55: Global Bio-Lubricants Industry Revenue Million Forecast, by Product Type 2020 & 2033
- Table 56: Global Bio-Lubricants Industry Volume K Tons Forecast, by Product Type 2020 & 2033
- Table 57: Global Bio-Lubricants Industry Revenue Million Forecast, by End-user Industry 2020 & 2033
- Table 58: Global Bio-Lubricants Industry Volume K Tons Forecast, by End-user Industry 2020 & 2033
- Table 59: Global Bio-Lubricants Industry Revenue Million Forecast, by Country 2020 & 2033
- Table 60: Global Bio-Lubricants Industry Volume K Tons Forecast, by Country 2020 & 2033
- Table 61: Brazil Bio-Lubricants Industry Revenue (Million) Forecast, by Application 2020 & 2033
- Table 62: Brazil Bio-Lubricants Industry Volume (K Tons) Forecast, by Application 2020 & 2033
- Table 63: Argentina Bio-Lubricants Industry Revenue (Million) Forecast, by Application 2020 & 2033
- Table 64: Argentina Bio-Lubricants Industry Volume (K Tons) Forecast, by Application 2020 & 2033
- Table 65: Rest of South America Bio-Lubricants Industry Revenue (Million) Forecast, by Application 2020 & 2033
- Table 66: Rest of South America Bio-Lubricants Industry Volume (K Tons) Forecast, by Application 2020 & 2033
- Table 67: Global Bio-Lubricants Industry Revenue Million Forecast, by Product Type 2020 & 2033
- Table 68: Global Bio-Lubricants Industry Volume K Tons Forecast, by Product Type 2020 & 2033
- Table 69: Global Bio-Lubricants Industry Revenue Million Forecast, by End-user Industry 2020 & 2033
- Table 70: Global Bio-Lubricants Industry Volume K Tons Forecast, by End-user Industry 2020 & 2033
- Table 71: Global Bio-Lubricants Industry Revenue Million Forecast, by Country 2020 & 2033
- Table 72: Global Bio-Lubricants Industry Volume K Tons Forecast, by Country 2020 & 2033
- Table 73: Global Bio-Lubricants Industry Revenue Million Forecast, by Product Type 2020 & 2033
- Table 74: Global Bio-Lubricants Industry Volume K Tons Forecast, by Product Type 2020 & 2033
- Table 75: Global Bio-Lubricants Industry Revenue Million Forecast, by End-user Industry 2020 & 2033
- Table 76: Global Bio-Lubricants Industry Volume K Tons Forecast, by End-user Industry 2020 & 2033
- Table 77: Global Bio-Lubricants Industry Revenue Million Forecast, by Country 2020 & 2033
- Table 78: Global Bio-Lubricants Industry Volume K Tons Forecast, by Country 2020 & 2033
- Table 79: South Africa Bio-Lubricants Industry Revenue (Million) Forecast, by Application 2020 & 2033
- Table 80: South Africa Bio-Lubricants Industry Volume (K Tons) Forecast, by Application 2020 & 2033
- Table 81: United Arab Emirates Bio-Lubricants Industry Revenue (Million) Forecast, by Application 2020 & 2033
- Table 82: United Arab Emirates Bio-Lubricants Industry Volume (K Tons) Forecast, by Application 2020 & 2033
- Table 83: Rest of Middle East Bio-Lubricants Industry Revenue (Million) Forecast, by Application 2020 & 2033
- Table 84: Rest of Middle East Bio-Lubricants Industry Volume (K Tons) Forecast, by Application 2020 & 2033
Frequently Asked Questions
1. What is the projected Compound Annual Growth Rate (CAGR) of the Bio-Lubricants Industry?
The projected CAGR is approximately > 3.00%.
2. Which companies are prominent players in the Bio-Lubricants Industry?
Key companies in the market include Carl Bechem Lubricants India Private Limited, Shell plc, TotalEnergies*List Not Exhaustive, Exxon Mobil Corporation, Cortec Corporation, FUCHS, Cargill, KCM Petro Chemicals, Chevron Corporation, Novvi LLC, Axel Christiernsson, Environmental Lubricants Manufacturing Inc, PANOLIN AG, BP p l c.
3. What are the main segments of the Bio-Lubricants Industry?
The market segments include Product Type, End-user Industry.
4. Can you provide details about the market size?
The market size is estimated to be USD XX Million as of 2022.
5. What are some drivers contributing to market growth?
Regulatory Norms Driving the Demand for Bio-based Lubricants; Other Drivers.
6. What are the notable trends driving market growth?
Increase in Demand for Bio-Lubricants in Automotive and Transportation Sector.
7. Are there any restraints impacting market growth?
High Price of Bio-based Lubricants; Other Restraints.
8. Can you provide examples of recent developments in the market?
November 2022: Wholly-owned subsidiaries of Shell plc in Switzerland, the United Kingdom, the United States, and Sweden entered into agreements to acquire the environmentally considerate lubricants (ECLs) business of the Panolin Group. This transaction brings with it an offering of biodegradable lubricants.
9. What pricing options are available for accessing the report?
Pricing options include single-user, multi-user, and enterprise licenses priced at USD 4750, USD 5250, and USD 8750 respectively.
10. Is the market size provided in terms of value or volume?
The market size is provided in terms of value, measured in Million and volume, measured in K Tons.
11. Are there any specific market keywords associated with the report?
Yes, the market keyword associated with the report is "Bio-Lubricants Industry," which aids in identifying and referencing the specific market segment covered.
12. How do I determine which pricing option suits my needs best?
The pricing options vary based on user requirements and access needs. Individual users may opt for single-user licenses, while businesses requiring broader access may choose multi-user or enterprise licenses for cost-effective access to the report.
13. Are there any additional resources or data provided in the Bio-Lubricants Industry report?
While the report offers comprehensive insights, it's advisable to review the specific contents or supplementary materials provided to ascertain if additional resources or data are available.
14. How can I stay updated on further developments or reports in the Bio-Lubricants Industry?
To stay informed about further developments, trends, and reports in the Bio-Lubricants Industry, consider subscribing to industry newsletters, following relevant companies and organizations, or regularly checking reputable industry news sources and publications.
Methodology
Step 1 - Identification of Relevant Samples Size from Population Database


Step 2 - Approaches for Defining Global Market Size (Value, Volume* & Price*)

Note*: In applicable scenarios
Step 3 - Data Sources
Primary Research
- Web Analytics
- Survey Reports
- Research Institute
- Latest Research Reports
- Opinion Leaders
Secondary Research
- Annual Reports
- White Paper
- Latest Press Release
- Industry Association
- Paid Database
- Investor Presentations

Step 4 - Data Triangulation
Involves using different sources of information in order to increase the validity of a study
These sources are likely to be stakeholders in a program - participants, other researchers, program staff, other community members, and so on.
Then we put all data in single framework & apply various statistical tools to find out the dynamic on the market.
During the analysis stage, feedback from the stakeholder groups would be compared to determine areas of agreement as well as areas of divergence