

Key Insights
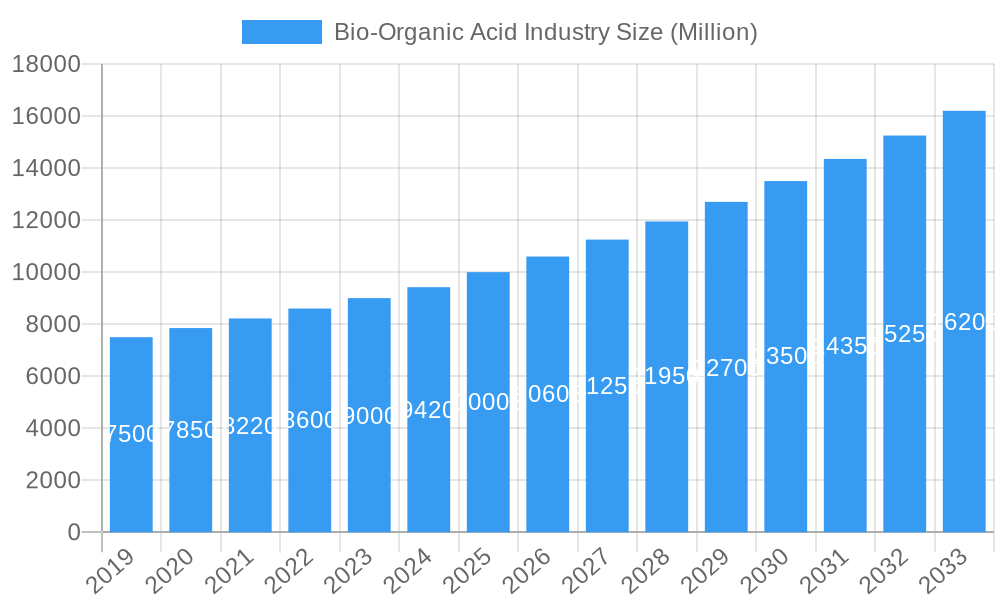
The global Bio-Organic Acid market is poised for significant expansion, projected to surpass a valuation of $10,000 million by 2025 and maintain a robust Compound Annual Growth Rate (CAGR) exceeding 6.00% through 2033. This impressive growth is primarily propelled by the escalating demand for sustainable and environmentally friendly alternatives across a multitude of industries. Key drivers include the increasing consumer preference for bio-based products, stringent government regulations promoting the use of renewable resources, and the continuous innovation in biotechnological processes that enhance production efficiency and reduce costs. The market's diversity is further underscored by its segmentation into various raw materials such as biomass, corn, maize, and sugar, alongside product types like bio lactic acid, bio acetic acid, bio adipic acid, bio acrylic acid, and bio succinic acid. These bio-organic acids are finding widespread applications in burgeoning sectors like polymers, pharmaceuticals, textiles, coatings, and the food and beverage industry, reflecting their versatility and essential role in modern manufacturing.
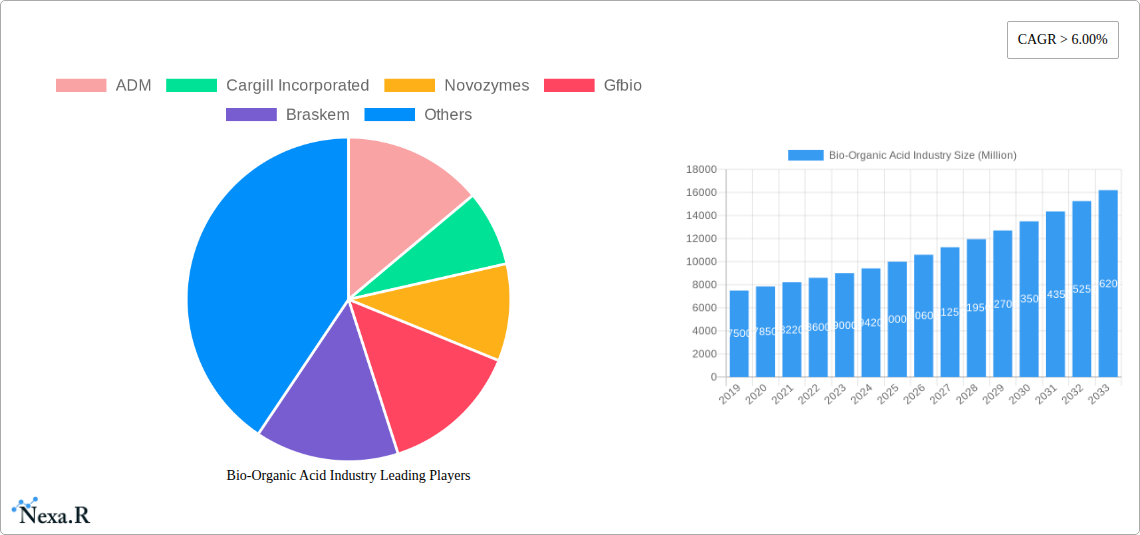
Bio-Organic Acid Industry Market Size (In Billion)
The competitive landscape is characterized by the presence of major global players including ADM, Cargill Incorporated, Novozymes, Gfbio, Braskem, PTT Global Chemical Public Company Limited, Mitsubishi Chemical Corporation, Corbion, BioAmber Inc, Cosun, BASF SE, Abengoa, DSM, NatureWorks LLC, and Genomatica. These companies are actively investing in research and development to introduce novel bio-organic acids and improve existing production methods, thereby fostering market growth and innovation. Emerging trends such as advancements in fermentation technologies, the utilization of waste biomass for feedstock, and the development of biodegradable polymers derived from bio-organic acids are further shaping the market's trajectory. However, challenges such as the higher initial production costs compared to petrochemical alternatives and the fluctuating availability and pricing of raw materials may present some restraints. Despite these hurdles, the overarching shift towards a circular economy and the growing emphasis on sustainability are expected to drive sustained growth and market penetration for bio-organic acids globally. The Asia Pacific region, led by China and India, is anticipated to emerge as a dominant force in this market due to rapid industrialization and supportive government initiatives for bio-based industries.
Bio-Organic Acid Industry Company Market Share
Bio-Organic Acid Industry Report: Sustainable Solutions for a Greener Future
This comprehensive report provides an in-depth analysis of the global Bio-Organic Acid Industry, meticulously detailing market dynamics, growth trajectories, and emerging opportunities. Covering a study period from 2019 to 2033, with a base year of 2025, this report offers critical insights for stakeholders seeking to navigate the evolving landscape of bio-based chemicals. The market is segmented by raw materials (Biomass, Corn, Maize, Sugar, Other Raw Materials), product types (Bio Lactic Acid, Bio Acetic Acid, Bio Adipic Acid, Bio Acrylic Acid, Bio Succinic Acid, Other Pr), and applications (Polymers, Pharmaceuticals, Textile, Coatings, Food and Beverage, Other Ap).
Bio-Organic Acid Industry Market Dynamics & Structure
The global Bio-Organic Acid Industry is characterized by a dynamic interplay of technological innovation, evolving regulatory landscapes, and increasing consumer demand for sustainable products. Market concentration is moderately fragmented, with key players like ADM, Cargill Incorporated, and Novozymes investing heavily in research and development to enhance production efficiency and expand product portfolios. Technological innovation is a primary driver, fueled by advancements in biotechnology and fermentation processes that enable cost-effective production of bio-based organic acids from renewable resources. Regulatory frameworks, particularly those promoting circular economy principles and reducing carbon footprints, are increasingly favorable, incentivizing the adoption of bio-based alternatives. Competitive product substitutes, primarily petroleum-derived chemicals, are facing increasing pressure from their environmentally friendly counterparts. End-user demographics are shifting towards environmentally conscious consumers and industries seeking to reduce their environmental impact. Mergers and acquisitions (M&A) trends indicate a strategic consolidation within the industry as companies aim to gain market share, acquire novel technologies, and secure raw material supply chains. For instance, the acquisition of Gfbio by Corbion highlights consolidation efforts to strengthen market position. While innovation barriers exist, such as the upfront investment in bio-refinery infrastructure and scaling up production, the growing market pull for sustainable solutions is outweighing these challenges.
- Market Concentration: Moderately fragmented with key players and emerging innovators.
- Technological Innovation: Driven by advanced biotechnology, fermentation, and bio-refinery processes.
- Regulatory Frameworks: Favorable policies supporting sustainability and carbon footprint reduction.
- Competitive Landscape: Increasing pressure on petroleum-based substitutes.
- End-User Demographics: Growing demand from environmentally conscious consumers and industries.
- M&A Trends: Strategic consolidations for market share and technology acquisition.
- Innovation Barriers: Upfront infrastructure investment and scaling challenges.
Bio-Organic Acid Industry Growth Trends & Insights
The Bio-Organic Acid Industry is poised for substantial growth, driven by a confluence of factors including rising environmental consciousness, favorable government policies, and continuous technological advancements. The market size is projected to expand significantly, with a projected Compound Annual Growth Rate (CAGR) of approximately 8.5% during the forecast period of 2025–2033. This growth is underpinned by increasing adoption rates of bio-based organic acids across various applications, from bioplastics and biodegradable packaging to pharmaceuticals and food ingredients. Technological disruptions, such as the development of more efficient microbial strains and novel bio-catalytic processes, are enhancing production yields and reducing costs, making bio-organic acids more competitive with their fossil fuel-derived counterparts. Consumer behavior shifts are playing a pivotal role, with a growing preference for products that offer a reduced environmental footprint and are sourced from renewable resources. This trend is particularly evident in developed economies but is also gaining momentum in emerging markets. The penetration of bio-organic acids into traditional chemical markets is accelerating as industries recognize the long-term benefits of sustainability and the potential for brand differentiation. For example, the burgeoning demand for PLA (Polylactic Acid) derived from bio-lactic acid is a testament to this shift, creating substantial market penetration in the polymers sector. Furthermore, innovative applications in textiles, agriculture, and personal care are continuously emerging, broadening the market's scope and driving further adoption. The increasing focus on a circular economy and the desire to mitigate climate change are creating a robust demand pipeline for these sustainable chemical building blocks.
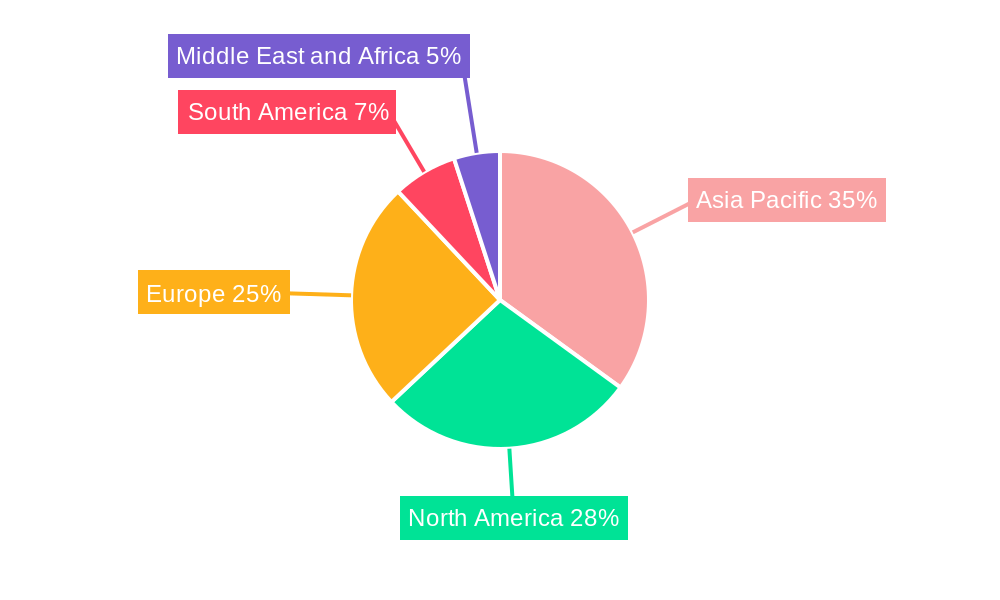
Dominant Regions, Countries, or Segments in Bio-Organic Acid Industry
The global Bio-Organic Acid Industry is experiencing robust growth, with North America and Europe currently leading in market share and adoption rates, driven by stringent environmental regulations and a well-established bio-based economy. However, the Asia-Pacific region, particularly China and Southeast Asia, is emerging as a critical growth engine, fueled by expanding industrial bases, increasing investments in renewable energy, and a rising middle class with growing environmental awareness. From a Raw Material perspective, Biomass is the dominant feedstock, offering a versatile and sustainable source for a wide range of bio-organic acids. Within this, Corn and Maize are particularly significant in regions with strong agricultural sectors, while Sugar from sugarcane and beet remains a crucial raw material in tropical and subtropical areas. The Product Type segment is led by Bio Lactic Acid, primarily due to its extensive use in producing Polylactic Acid (PLA), a biodegradable and compostable polymer. Bio Succinic Acid is also gaining significant traction due to its versatility in producing polyurethanes, resins, and as a platform chemical. In terms of Application, the Polymers segment is the largest contributor to market growth, propelled by the increasing demand for bioplastics in packaging, automotive, and consumer goods. The Food and Beverage industry also represents a substantial application, utilizing bio-organic acids as acidulants, preservatives, and flavor enhancers. The Textile and Pharmaceuticals sectors are also witnessing steady growth as companies increasingly seek sustainable and biocompatible ingredients. Key drivers for dominance in these regions and segments include government incentives for bio-based manufacturing, robust R&D infrastructure, availability of raw materials, and strong consumer demand for eco-friendly products. Market share in these leading segments is estimated to be substantial, with bio-lactic acid in polymers accounting for over 30% of the total market.
- Dominant Region: Asia-Pacific (emerging as a key growth engine).
- Dominant Raw Material: Biomass (especially Corn, Maize, and Sugar).
- Dominant Product Type: Bio Lactic Acid.
- Dominant Application: Polymers (especially bioplastics).
- Key Drivers: Favorable government policies, R&D infrastructure, raw material availability, and consumer demand.
Bio-Organic Acid Industry Product Landscape
The product landscape of the Bio-Organic Acid Industry is characterized by continuous innovation and expansion, driven by the pursuit of enhanced sustainability and performance across diverse applications. Bio-based organic acids, such as Bio Lactic Acid, Bio Acetic Acid, Bio Adipic Acid, Bio Acrylic Acid, and Bio Succinic Acid, are now readily available with improved purity, functionality, and cost-effectiveness. These bio-derived alternatives are increasingly replacing their petrochemical counterparts, offering unique selling propositions like biodegradability, compostability, and a significantly reduced carbon footprint. For example, advanced fermentation technologies have led to the development of high-purity bio-lactic acid suitable for advanced polymer applications, while bio-succinic acid serves as a versatile platform chemical for synthesizing a wide array of downstream products, including biodegradable polyesters and novel resins. Technological advancements are focused on optimizing microbial strains for higher yields and developing more efficient downstream processing techniques, thereby improving product performance metrics like thermal stability and mechanical strength in end-use applications such as textiles, coatings, and pharmaceuticals.
Key Drivers, Barriers & Challenges in Bio-Organic Acid Industry
Key Drivers: The Bio-Organic Acid Industry is propelled by a powerful combination of factors. Growing global environmental consciousness and increasing demand for sustainable products are primary drivers, compelling industries to adopt greener alternatives. Favorable government regulations and policies, including carbon pricing, renewable energy mandates, and bio-based product subsidies, further accelerate market growth. Technological advancements in fermentation, genetic engineering, and downstream processing are enhancing production efficiency and reducing costs, making bio-organic acids more competitive. The expanding applications of bio-based organic acids in high-growth sectors like bioplastics, pharmaceuticals, and food & beverage also contribute significantly.
Barriers & Challenges: Despite its promising growth, the industry faces several barriers. High upfront capital investment for establishing bio-refineries and scaling up production can be a significant hurdle. Fluctuations in the price and availability of agricultural feedstock, influenced by weather patterns and global commodity markets, pose a challenge to consistent production costs. Regulatory hurdles and the need for extensive testing and certification for new bio-based products in certain sectors can slow down market penetration. Competition from established, lower-cost petrochemical-based alternatives remains a persistent challenge, requiring continuous innovation to achieve cost parity. Supply chain complexities and the need for efficient logistics for biomass sourcing and distribution also present operational challenges.
Emerging Opportunities in Bio-Organic Acid Industry
Emerging opportunities in the Bio-Organic Acid Industry are vast and expanding, driven by both technological innovation and evolving market demands. The development of novel bio-based polymers with advanced properties, such as enhanced biodegradability and superior mechanical strength, presents significant growth potential in packaging, automotive, and consumer goods sectors. Furthermore, the exploration of new applications in niche markets like biodegradable textiles, advanced drug delivery systems, and sustainable agricultural chemicals is creating untapped revenue streams. The increasing focus on circular economy principles is driving opportunities for the valorization of waste biomass streams into high-value bio-organic acids, reducing both waste and production costs. The growing consumer preference for natural and sustainable ingredients also opens doors for bio-organic acids in the food and beverage, cosmetics, and personal care industries.
Growth Accelerators in the Bio-Organic Acid Industry Industry
Several key catalysts are accelerating the growth of the Bio-Organic Acid Industry. Continuous advancements in synthetic biology and metabolic engineering are leading to the development of highly efficient microbial strains capable of producing bio-organic acids with improved yields and reduced by-product formation. Strategic partnerships between technology providers, raw material suppliers, and end-product manufacturers are crucial for streamlining the value chain and fostering innovation. For instance, collaborations for the development of integrated bio-refineries that efficiently convert agricultural residues into bio-based chemicals are gaining traction. Market expansion strategies, including the penetration into developing economies where there is a growing demand for sustainable alternatives and the establishment of robust distribution networks, are also vital growth accelerators. Furthermore, supportive government policies, such as tax incentives and public procurement programs for bio-based products, are playing a significant role in driving widespread adoption and investment.
Key Players Shaping the Bio-Organic Acid Industry Market
- ADM
- Cargill Incorporated
- Novozymes
- Gfbio
- Braskem
- PTT Global Chemical Public Company Limited
- Mitsubishi Chemical Corporation
- Corbion
- BioAmber Inc
- Cosun
- BASF SE
- Abengoa
- DSM
- NatureWorks LLC
- Genomatica
Notable Milestones in Bio-Organic Acid Industry Sector
- October 2022: Corbion announced the production of bio-based lactic acid to fulfill the rising demand for environmentally friendly solutions in the Asia-Pacific region. The company announced its plans to build a new lactic acid facility in Thailand. The company's dedication to supplying bio-based organic acids to a larger market is demonstrated by its expansion.
- May 2022: BASF announced the extension of its line of bio-based organic acids. The company manufactured a novel biodegradable and compostable polymer based on bio-based succinic acid. The polymer is more environmentally friendly and has uses in textiles, agriculture, and packaging industries.
In-Depth Bio-Organic Acid Industry Market Outlook
The future outlook for the Bio-Organic Acid Industry is exceptionally promising, driven by sustained innovation and a global imperative for sustainability. Growth accelerators, including advancements in biotechnology for more efficient production and the expanding range of applications in high-demand sectors like bioplastics and sustainable chemicals, will continue to propel the market forward. Strategic partnerships and governmental support for the bio-economy will further solidify the industry's trajectory. The increasing awareness of environmental issues and the tangible benefits offered by bio-organic acids – such as reduced greenhouse gas emissions and biodegradability – are creating a robust market pull. This outlook suggests significant opportunities for investment, technological development, and market expansion, positioning bio-organic acids as a cornerstone of the future chemical industry.
Bio-Organic Acid Industry Segmentation
-
1. Raw Material
- 1.1. Biomass
- 1.2. Corn
- 1.3. Maize
- 1.4. Sugar
- 1.5. Other Raw Materials
-
2. Product Type
- 2.1. Bio Lactic Acid
- 2.2. Bio Acetic Acid
- 2.3. Bio Adipic Acid
- 2.4. Bio Acrylic Acid
- 2.5. Bio Succinic Acid
- 2.6. Other Pr
-
3. Application
- 3.1. Polymers
- 3.2. Pharmaceuticals
- 3.3. Textile
- 3.4. Coatings
- 3.5. Food and Beverage
- 3.6. Other Ap
Bio-Organic Acid Industry Segmentation By Geography
-
1. Asia Pacific
- 1.1. China
- 1.2. India
- 1.3. Japan
- 1.4. South Korea
- 1.5. Rest of Asia Pacific
-
2. North America
- 2.1. United States
- 2.2. Canada
- 2.3. Mexico
-
3. Europe
- 3.1. Germany
- 3.2. United Kingdom
- 3.3. Italy
- 3.4. France
- 3.5. Rest of Europe
-
4. South America
- 4.1. Brazil
- 4.2. Argentina
- 4.3. Rest of South America
-
5. Middle East and Africa
- 5.1. Saudi Arabia
- 5.2. South Africa
- 5.3. Rest of Middle East and Africa
Bio-Organic Acid Industry Regional Market Share
Geographic Coverage of Bio-Organic Acid Industry
Bio-Organic Acid Industry REPORT HIGHLIGHTS
| Aspects | Details |
|---|---|
| Study Period | 2020-2034 |
| Base Year | 2025 |
| Estimated Year | 2026 |
| Forecast Period | 2026-2034 |
| Historical Period | 2020-2025 |
| Growth Rate | CAGR of > 6.00% from 2020-2034 |
| Segmentation |
|
Table of Contents
- 1. Introduction
- 1.1. Research Scope
- 1.2. Market Segmentation
- 1.3. Research Objective
- 1.4. Definitions and Assumptions
- 2. Executive Summary
- 2.1. Market Snapshot
- 3. Market Dynamics
- 3.1. Market Drivers
- 3.2. Market Restrains
- 3.3. Market Trends
- 3.4. Market Opportunities
- 4. Market Factor Analysis
- 4.1. Porters Five Forces
- 4.1.1. Bargaining Power of Suppliers
- 4.1.2. Bargaining Power of Buyers
- 4.1.3. Threat of New Entrants
- 4.1.4. Threat of Substitutes
- 4.1.5. Competitive Rivalry
- 4.2. PESTEL analysis
- 4.3. BCG Analysis
- 4.3.1. Stars (High Growth, High Market Share)
- 4.3.2. Cash Cows (Low Growth, High Market Share)
- 4.3.3. Question Mark (High Growth, Low Market Share)
- 4.3.4. Dogs (Low Growth, Low Market Share)
- 4.4. Ansoff Matrix Analysis
- 4.5. Supply Chain Analysis
- 4.6. Regulatory Landscape
- 4.7. Current Market Potential and Opportunity Assessment (TAM–SAM–SOM Framework)
- 4.8. NRP Analyst Note
- 4.1. Porters Five Forces
- 5. Market Analysis, Insights and Forecast 2021-2033
- 5.1. Market Analysis, Insights and Forecast - by Raw Material
- 5.1.1. Biomass
- 5.1.2. Corn
- 5.1.3. Maize
- 5.1.4. Sugar
- 5.1.5. Other Raw Materials
- 5.2. Market Analysis, Insights and Forecast - by Product Type
- 5.2.1. Bio Lactic Acid
- 5.2.2. Bio Acetic Acid
- 5.2.3. Bio Adipic Acid
- 5.2.4. Bio Acrylic Acid
- 5.2.5. Bio Succinic Acid
- 5.2.6. Other Pr
- 5.3. Market Analysis, Insights and Forecast - by Application
- 5.3.1. Polymers
- 5.3.2. Pharmaceuticals
- 5.3.3. Textile
- 5.3.4. Coatings
- 5.3.5. Food and Beverage
- 5.3.6. Other Ap
- 5.4. Market Analysis, Insights and Forecast - by Region
- 5.4.1. Asia Pacific
- 5.4.2. North America
- 5.4.3. Europe
- 5.4.4. South America
- 5.4.5. Middle East and Africa
- 5.1. Market Analysis, Insights and Forecast - by Raw Material
- 6. Global Bio-Organic Acid Industry Analysis, Insights and Forecast, 2021-2033
- 6.1. Market Analysis, Insights and Forecast - by Raw Material
- 6.1.1. Biomass
- 6.1.2. Corn
- 6.1.3. Maize
- 6.1.4. Sugar
- 6.1.5. Other Raw Materials
- 6.2. Market Analysis, Insights and Forecast - by Product Type
- 6.2.1. Bio Lactic Acid
- 6.2.2. Bio Acetic Acid
- 6.2.3. Bio Adipic Acid
- 6.2.4. Bio Acrylic Acid
- 6.2.5. Bio Succinic Acid
- 6.2.6. Other Pr
- 6.3. Market Analysis, Insights and Forecast - by Application
- 6.3.1. Polymers
- 6.3.2. Pharmaceuticals
- 6.3.3. Textile
- 6.3.4. Coatings
- 6.3.5. Food and Beverage
- 6.3.6. Other Ap
- 6.1. Market Analysis, Insights and Forecast - by Raw Material
- 7. Asia Pacific Bio-Organic Acid Industry Analysis, Insights and Forecast, 2020-2032
- 7.1. Market Analysis, Insights and Forecast - by Raw Material
- 7.1.1. Biomass
- 7.1.2. Corn
- 7.1.3. Maize
- 7.1.4. Sugar
- 7.1.5. Other Raw Materials
- 7.2. Market Analysis, Insights and Forecast - by Product Type
- 7.2.1. Bio Lactic Acid
- 7.2.2. Bio Acetic Acid
- 7.2.3. Bio Adipic Acid
- 7.2.4. Bio Acrylic Acid
- 7.2.5. Bio Succinic Acid
- 7.2.6. Other Pr
- 7.3. Market Analysis, Insights and Forecast - by Application
- 7.3.1. Polymers
- 7.3.2. Pharmaceuticals
- 7.3.3. Textile
- 7.3.4. Coatings
- 7.3.5. Food and Beverage
- 7.3.6. Other Ap
- 7.1. Market Analysis, Insights and Forecast - by Raw Material
- 8. North America Bio-Organic Acid Industry Analysis, Insights and Forecast, 2020-2032
- 8.1. Market Analysis, Insights and Forecast - by Raw Material
- 8.1.1. Biomass
- 8.1.2. Corn
- 8.1.3. Maize
- 8.1.4. Sugar
- 8.1.5. Other Raw Materials
- 8.2. Market Analysis, Insights and Forecast - by Product Type
- 8.2.1. Bio Lactic Acid
- 8.2.2. Bio Acetic Acid
- 8.2.3. Bio Adipic Acid
- 8.2.4. Bio Acrylic Acid
- 8.2.5. Bio Succinic Acid
- 8.2.6. Other Pr
- 8.3. Market Analysis, Insights and Forecast - by Application
- 8.3.1. Polymers
- 8.3.2. Pharmaceuticals
- 8.3.3. Textile
- 8.3.4. Coatings
- 8.3.5. Food and Beverage
- 8.3.6. Other Ap
- 8.1. Market Analysis, Insights and Forecast - by Raw Material
- 9. Europe Bio-Organic Acid Industry Analysis, Insights and Forecast, 2020-2032
- 9.1. Market Analysis, Insights and Forecast - by Raw Material
- 9.1.1. Biomass
- 9.1.2. Corn
- 9.1.3. Maize
- 9.1.4. Sugar
- 9.1.5. Other Raw Materials
- 9.2. Market Analysis, Insights and Forecast - by Product Type
- 9.2.1. Bio Lactic Acid
- 9.2.2. Bio Acetic Acid
- 9.2.3. Bio Adipic Acid
- 9.2.4. Bio Acrylic Acid
- 9.2.5. Bio Succinic Acid
- 9.2.6. Other Pr
- 9.3. Market Analysis, Insights and Forecast - by Application
- 9.3.1. Polymers
- 9.3.2. Pharmaceuticals
- 9.3.3. Textile
- 9.3.4. Coatings
- 9.3.5. Food and Beverage
- 9.3.6. Other Ap
- 9.1. Market Analysis, Insights and Forecast - by Raw Material
- 10. South America Bio-Organic Acid Industry Analysis, Insights and Forecast, 2020-2032
- 10.1. Market Analysis, Insights and Forecast - by Raw Material
- 10.1.1. Biomass
- 10.1.2. Corn
- 10.1.3. Maize
- 10.1.4. Sugar
- 10.1.5. Other Raw Materials
- 10.2. Market Analysis, Insights and Forecast - by Product Type
- 10.2.1. Bio Lactic Acid
- 10.2.2. Bio Acetic Acid
- 10.2.3. Bio Adipic Acid
- 10.2.4. Bio Acrylic Acid
- 10.2.5. Bio Succinic Acid
- 10.2.6. Other Pr
- 10.3. Market Analysis, Insights and Forecast - by Application
- 10.3.1. Polymers
- 10.3.2. Pharmaceuticals
- 10.3.3. Textile
- 10.3.4. Coatings
- 10.3.5. Food and Beverage
- 10.3.6. Other Ap
- 10.1. Market Analysis, Insights and Forecast - by Raw Material
- 11. Middle East and Africa Bio-Organic Acid Industry Analysis, Insights and Forecast, 2020-2032
- 11.1. Market Analysis, Insights and Forecast - by Raw Material
- 11.1.1. Biomass
- 11.1.2. Corn
- 11.1.3. Maize
- 11.1.4. Sugar
- 11.1.5. Other Raw Materials
- 11.2. Market Analysis, Insights and Forecast - by Product Type
- 11.2.1. Bio Lactic Acid
- 11.2.2. Bio Acetic Acid
- 11.2.3. Bio Adipic Acid
- 11.2.4. Bio Acrylic Acid
- 11.2.5. Bio Succinic Acid
- 11.2.6. Other Pr
- 11.3. Market Analysis, Insights and Forecast - by Application
- 11.3.1. Polymers
- 11.3.2. Pharmaceuticals
- 11.3.3. Textile
- 11.3.4. Coatings
- 11.3.5. Food and Beverage
- 11.3.6. Other Ap
- 11.1. Market Analysis, Insights and Forecast - by Raw Material
- 12. Competitive Analysis
- 12.1. Company Profiles
- 12.1.1 ADM
- 12.1.1.1. Company Overview
- 12.1.1.2. Products
- 12.1.1.3. Company Financials
- 12.1.1.4. SWOT Analysis
- 12.1.2 Cargill Incorporated
- 12.1.2.1. Company Overview
- 12.1.2.2. Products
- 12.1.2.3. Company Financials
- 12.1.2.4. SWOT Analysis
- 12.1.3 Novozymes
- 12.1.3.1. Company Overview
- 12.1.3.2. Products
- 12.1.3.3. Company Financials
- 12.1.3.4. SWOT Analysis
- 12.1.4 Gfbio
- 12.1.4.1. Company Overview
- 12.1.4.2. Products
- 12.1.4.3. Company Financials
- 12.1.4.4. SWOT Analysis
- 12.1.5 Braskem
- 12.1.5.1. Company Overview
- 12.1.5.2. Products
- 12.1.5.3. Company Financials
- 12.1.5.4. SWOT Analysis
- 12.1.6 PTT Global Chemical Public Company Limited*List Not Exhaustive
- 12.1.6.1. Company Overview
- 12.1.6.2. Products
- 12.1.6.3. Company Financials
- 12.1.6.4. SWOT Analysis
- 12.1.7 Mitsubishi Chemical Corporation
- 12.1.7.1. Company Overview
- 12.1.7.2. Products
- 12.1.7.3. Company Financials
- 12.1.7.4. SWOT Analysis
- 12.1.8 Corbion
- 12.1.8.1. Company Overview
- 12.1.8.2. Products
- 12.1.8.3. Company Financials
- 12.1.8.4. SWOT Analysis
- 12.1.9 BioAmber Inc
- 12.1.9.1. Company Overview
- 12.1.9.2. Products
- 12.1.9.3. Company Financials
- 12.1.9.4. SWOT Analysis
- 12.1.10 Cosun
- 12.1.10.1. Company Overview
- 12.1.10.2. Products
- 12.1.10.3. Company Financials
- 12.1.10.4. SWOT Analysis
- 12.1.11 BASF SE
- 12.1.11.1. Company Overview
- 12.1.11.2. Products
- 12.1.11.3. Company Financials
- 12.1.11.4. SWOT Analysis
- 12.1.12 Abengoa
- 12.1.12.1. Company Overview
- 12.1.12.2. Products
- 12.1.12.3. Company Financials
- 12.1.12.4. SWOT Analysis
- 12.1.13 DSM
- 12.1.13.1. Company Overview
- 12.1.13.2. Products
- 12.1.13.3. Company Financials
- 12.1.13.4. SWOT Analysis
- 12.1.14 NatureWorks LLC
- 12.1.14.1. Company Overview
- 12.1.14.2. Products
- 12.1.14.3. Company Financials
- 12.1.14.4. SWOT Analysis
- 12.1.15 Genomatica
- 12.1.15.1. Company Overview
- 12.1.15.2. Products
- 12.1.15.3. Company Financials
- 12.1.15.4. SWOT Analysis
- 12.1.1 ADM
- 12.2. Market Entropy
- 12.2.1 Company's Key Areas Served
- 12.2.2 Recent Developments
- 12.3. Company Market Share Analysis 2025
- 12.3.1 Top 5 Companies Market Share Analysis
- 12.3.2 Top 3 Companies Market Share Analysis
- 12.4. List of Potential Customers
- 13. Research Methodology
List of Figures
- Figure 1: Global Bio-Organic Acid Industry Revenue Breakdown (Million, %) by Region 2025 & 2033
- Figure 2: Global Bio-Organic Acid Industry Volume Breakdown (Million, %) by Region 2025 & 2033
- Figure 3: Asia Pacific Bio-Organic Acid Industry Revenue (Million), by Raw Material 2025 & 2033
- Figure 4: Asia Pacific Bio-Organic Acid Industry Volume (Million), by Raw Material 2025 & 2033
- Figure 5: Asia Pacific Bio-Organic Acid Industry Revenue Share (%), by Raw Material 2025 & 2033
- Figure 6: Asia Pacific Bio-Organic Acid Industry Volume Share (%), by Raw Material 2025 & 2033
- Figure 7: Asia Pacific Bio-Organic Acid Industry Revenue (Million), by Product Type 2025 & 2033
- Figure 8: Asia Pacific Bio-Organic Acid Industry Volume (Million), by Product Type 2025 & 2033
- Figure 9: Asia Pacific Bio-Organic Acid Industry Revenue Share (%), by Product Type 2025 & 2033
- Figure 10: Asia Pacific Bio-Organic Acid Industry Volume Share (%), by Product Type 2025 & 2033
- Figure 11: Asia Pacific Bio-Organic Acid Industry Revenue (Million), by Application 2025 & 2033
- Figure 12: Asia Pacific Bio-Organic Acid Industry Volume (Million), by Application 2025 & 2033
- Figure 13: Asia Pacific Bio-Organic Acid Industry Revenue Share (%), by Application 2025 & 2033
- Figure 14: Asia Pacific Bio-Organic Acid Industry Volume Share (%), by Application 2025 & 2033
- Figure 15: Asia Pacific Bio-Organic Acid Industry Revenue (Million), by Country 2025 & 2033
- Figure 16: Asia Pacific Bio-Organic Acid Industry Volume (Million), by Country 2025 & 2033
- Figure 17: Asia Pacific Bio-Organic Acid Industry Revenue Share (%), by Country 2025 & 2033
- Figure 18: Asia Pacific Bio-Organic Acid Industry Volume Share (%), by Country 2025 & 2033
- Figure 19: North America Bio-Organic Acid Industry Revenue (Million), by Raw Material 2025 & 2033
- Figure 20: North America Bio-Organic Acid Industry Volume (Million), by Raw Material 2025 & 2033
- Figure 21: North America Bio-Organic Acid Industry Revenue Share (%), by Raw Material 2025 & 2033
- Figure 22: North America Bio-Organic Acid Industry Volume Share (%), by Raw Material 2025 & 2033
- Figure 23: North America Bio-Organic Acid Industry Revenue (Million), by Product Type 2025 & 2033
- Figure 24: North America Bio-Organic Acid Industry Volume (Million), by Product Type 2025 & 2033
- Figure 25: North America Bio-Organic Acid Industry Revenue Share (%), by Product Type 2025 & 2033
- Figure 26: North America Bio-Organic Acid Industry Volume Share (%), by Product Type 2025 & 2033
- Figure 27: North America Bio-Organic Acid Industry Revenue (Million), by Application 2025 & 2033
- Figure 28: North America Bio-Organic Acid Industry Volume (Million), by Application 2025 & 2033
- Figure 29: North America Bio-Organic Acid Industry Revenue Share (%), by Application 2025 & 2033
- Figure 30: North America Bio-Organic Acid Industry Volume Share (%), by Application 2025 & 2033
- Figure 31: North America Bio-Organic Acid Industry Revenue (Million), by Country 2025 & 2033
- Figure 32: North America Bio-Organic Acid Industry Volume (Million), by Country 2025 & 2033
- Figure 33: North America Bio-Organic Acid Industry Revenue Share (%), by Country 2025 & 2033
- Figure 34: North America Bio-Organic Acid Industry Volume Share (%), by Country 2025 & 2033
- Figure 35: Europe Bio-Organic Acid Industry Revenue (Million), by Raw Material 2025 & 2033
- Figure 36: Europe Bio-Organic Acid Industry Volume (Million), by Raw Material 2025 & 2033
- Figure 37: Europe Bio-Organic Acid Industry Revenue Share (%), by Raw Material 2025 & 2033
- Figure 38: Europe Bio-Organic Acid Industry Volume Share (%), by Raw Material 2025 & 2033
- Figure 39: Europe Bio-Organic Acid Industry Revenue (Million), by Product Type 2025 & 2033
- Figure 40: Europe Bio-Organic Acid Industry Volume (Million), by Product Type 2025 & 2033
- Figure 41: Europe Bio-Organic Acid Industry Revenue Share (%), by Product Type 2025 & 2033
- Figure 42: Europe Bio-Organic Acid Industry Volume Share (%), by Product Type 2025 & 2033
- Figure 43: Europe Bio-Organic Acid Industry Revenue (Million), by Application 2025 & 2033
- Figure 44: Europe Bio-Organic Acid Industry Volume (Million), by Application 2025 & 2033
- Figure 45: Europe Bio-Organic Acid Industry Revenue Share (%), by Application 2025 & 2033
- Figure 46: Europe Bio-Organic Acid Industry Volume Share (%), by Application 2025 & 2033
- Figure 47: Europe Bio-Organic Acid Industry Revenue (Million), by Country 2025 & 2033
- Figure 48: Europe Bio-Organic Acid Industry Volume (Million), by Country 2025 & 2033
- Figure 49: Europe Bio-Organic Acid Industry Revenue Share (%), by Country 2025 & 2033
- Figure 50: Europe Bio-Organic Acid Industry Volume Share (%), by Country 2025 & 2033
- Figure 51: South America Bio-Organic Acid Industry Revenue (Million), by Raw Material 2025 & 2033
- Figure 52: South America Bio-Organic Acid Industry Volume (Million), by Raw Material 2025 & 2033
- Figure 53: South America Bio-Organic Acid Industry Revenue Share (%), by Raw Material 2025 & 2033
- Figure 54: South America Bio-Organic Acid Industry Volume Share (%), by Raw Material 2025 & 2033
- Figure 55: South America Bio-Organic Acid Industry Revenue (Million), by Product Type 2025 & 2033
- Figure 56: South America Bio-Organic Acid Industry Volume (Million), by Product Type 2025 & 2033
- Figure 57: South America Bio-Organic Acid Industry Revenue Share (%), by Product Type 2025 & 2033
- Figure 58: South America Bio-Organic Acid Industry Volume Share (%), by Product Type 2025 & 2033
- Figure 59: South America Bio-Organic Acid Industry Revenue (Million), by Application 2025 & 2033
- Figure 60: South America Bio-Organic Acid Industry Volume (Million), by Application 2025 & 2033
- Figure 61: South America Bio-Organic Acid Industry Revenue Share (%), by Application 2025 & 2033
- Figure 62: South America Bio-Organic Acid Industry Volume Share (%), by Application 2025 & 2033
- Figure 63: South America Bio-Organic Acid Industry Revenue (Million), by Country 2025 & 2033
- Figure 64: South America Bio-Organic Acid Industry Volume (Million), by Country 2025 & 2033
- Figure 65: South America Bio-Organic Acid Industry Revenue Share (%), by Country 2025 & 2033
- Figure 66: South America Bio-Organic Acid Industry Volume Share (%), by Country 2025 & 2033
- Figure 67: Middle East and Africa Bio-Organic Acid Industry Revenue (Million), by Raw Material 2025 & 2033
- Figure 68: Middle East and Africa Bio-Organic Acid Industry Volume (Million), by Raw Material 2025 & 2033
- Figure 69: Middle East and Africa Bio-Organic Acid Industry Revenue Share (%), by Raw Material 2025 & 2033
- Figure 70: Middle East and Africa Bio-Organic Acid Industry Volume Share (%), by Raw Material 2025 & 2033
- Figure 71: Middle East and Africa Bio-Organic Acid Industry Revenue (Million), by Product Type 2025 & 2033
- Figure 72: Middle East and Africa Bio-Organic Acid Industry Volume (Million), by Product Type 2025 & 2033
- Figure 73: Middle East and Africa Bio-Organic Acid Industry Revenue Share (%), by Product Type 2025 & 2033
- Figure 74: Middle East and Africa Bio-Organic Acid Industry Volume Share (%), by Product Type 2025 & 2033
- Figure 75: Middle East and Africa Bio-Organic Acid Industry Revenue (Million), by Application 2025 & 2033
- Figure 76: Middle East and Africa Bio-Organic Acid Industry Volume (Million), by Application 2025 & 2033
- Figure 77: Middle East and Africa Bio-Organic Acid Industry Revenue Share (%), by Application 2025 & 2033
- Figure 78: Middle East and Africa Bio-Organic Acid Industry Volume Share (%), by Application 2025 & 2033
- Figure 79: Middle East and Africa Bio-Organic Acid Industry Revenue (Million), by Country 2025 & 2033
- Figure 80: Middle East and Africa Bio-Organic Acid Industry Volume (Million), by Country 2025 & 2033
- Figure 81: Middle East and Africa Bio-Organic Acid Industry Revenue Share (%), by Country 2025 & 2033
- Figure 82: Middle East and Africa Bio-Organic Acid Industry Volume Share (%), by Country 2025 & 2033
List of Tables
- Table 1: Global Bio-Organic Acid Industry Revenue Million Forecast, by Raw Material 2020 & 2033
- Table 2: Global Bio-Organic Acid Industry Volume Million Forecast, by Raw Material 2020 & 2033
- Table 3: Global Bio-Organic Acid Industry Revenue Million Forecast, by Product Type 2020 & 2033
- Table 4: Global Bio-Organic Acid Industry Volume Million Forecast, by Product Type 2020 & 2033
- Table 5: Global Bio-Organic Acid Industry Revenue Million Forecast, by Application 2020 & 2033
- Table 6: Global Bio-Organic Acid Industry Volume Million Forecast, by Application 2020 & 2033
- Table 7: Global Bio-Organic Acid Industry Revenue Million Forecast, by Region 2020 & 2033
- Table 8: Global Bio-Organic Acid Industry Volume Million Forecast, by Region 2020 & 2033
- Table 9: Global Bio-Organic Acid Industry Revenue Million Forecast, by Raw Material 2020 & 2033
- Table 10: Global Bio-Organic Acid Industry Volume Million Forecast, by Raw Material 2020 & 2033
- Table 11: Global Bio-Organic Acid Industry Revenue Million Forecast, by Product Type 2020 & 2033
- Table 12: Global Bio-Organic Acid Industry Volume Million Forecast, by Product Type 2020 & 2033
- Table 13: Global Bio-Organic Acid Industry Revenue Million Forecast, by Application 2020 & 2033
- Table 14: Global Bio-Organic Acid Industry Volume Million Forecast, by Application 2020 & 2033
- Table 15: Global Bio-Organic Acid Industry Revenue Million Forecast, by Country 2020 & 2033
- Table 16: Global Bio-Organic Acid Industry Volume Million Forecast, by Country 2020 & 2033
- Table 17: China Bio-Organic Acid Industry Revenue (Million) Forecast, by Application 2020 & 2033
- Table 18: China Bio-Organic Acid Industry Volume (Million) Forecast, by Application 2020 & 2033
- Table 19: India Bio-Organic Acid Industry Revenue (Million) Forecast, by Application 2020 & 2033
- Table 20: India Bio-Organic Acid Industry Volume (Million) Forecast, by Application 2020 & 2033
- Table 21: Japan Bio-Organic Acid Industry Revenue (Million) Forecast, by Application 2020 & 2033
- Table 22: Japan Bio-Organic Acid Industry Volume (Million) Forecast, by Application 2020 & 2033
- Table 23: South Korea Bio-Organic Acid Industry Revenue (Million) Forecast, by Application 2020 & 2033
- Table 24: South Korea Bio-Organic Acid Industry Volume (Million) Forecast, by Application 2020 & 2033
- Table 25: Rest of Asia Pacific Bio-Organic Acid Industry Revenue (Million) Forecast, by Application 2020 & 2033
- Table 26: Rest of Asia Pacific Bio-Organic Acid Industry Volume (Million) Forecast, by Application 2020 & 2033
- Table 27: Global Bio-Organic Acid Industry Revenue Million Forecast, by Raw Material 2020 & 2033
- Table 28: Global Bio-Organic Acid Industry Volume Million Forecast, by Raw Material 2020 & 2033
- Table 29: Global Bio-Organic Acid Industry Revenue Million Forecast, by Product Type 2020 & 2033
- Table 30: Global Bio-Organic Acid Industry Volume Million Forecast, by Product Type 2020 & 2033
- Table 31: Global Bio-Organic Acid Industry Revenue Million Forecast, by Application 2020 & 2033
- Table 32: Global Bio-Organic Acid Industry Volume Million Forecast, by Application 2020 & 2033
- Table 33: Global Bio-Organic Acid Industry Revenue Million Forecast, by Country 2020 & 2033
- Table 34: Global Bio-Organic Acid Industry Volume Million Forecast, by Country 2020 & 2033
- Table 35: United States Bio-Organic Acid Industry Revenue (Million) Forecast, by Application 2020 & 2033
- Table 36: United States Bio-Organic Acid Industry Volume (Million) Forecast, by Application 2020 & 2033
- Table 37: Canada Bio-Organic Acid Industry Revenue (Million) Forecast, by Application 2020 & 2033
- Table 38: Canada Bio-Organic Acid Industry Volume (Million) Forecast, by Application 2020 & 2033
- Table 39: Mexico Bio-Organic Acid Industry Revenue (Million) Forecast, by Application 2020 & 2033
- Table 40: Mexico Bio-Organic Acid Industry Volume (Million) Forecast, by Application 2020 & 2033
- Table 41: Global Bio-Organic Acid Industry Revenue Million Forecast, by Raw Material 2020 & 2033
- Table 42: Global Bio-Organic Acid Industry Volume Million Forecast, by Raw Material 2020 & 2033
- Table 43: Global Bio-Organic Acid Industry Revenue Million Forecast, by Product Type 2020 & 2033
- Table 44: Global Bio-Organic Acid Industry Volume Million Forecast, by Product Type 2020 & 2033
- Table 45: Global Bio-Organic Acid Industry Revenue Million Forecast, by Application 2020 & 2033
- Table 46: Global Bio-Organic Acid Industry Volume Million Forecast, by Application 2020 & 2033
- Table 47: Global Bio-Organic Acid Industry Revenue Million Forecast, by Country 2020 & 2033
- Table 48: Global Bio-Organic Acid Industry Volume Million Forecast, by Country 2020 & 2033
- Table 49: Germany Bio-Organic Acid Industry Revenue (Million) Forecast, by Application 2020 & 2033
- Table 50: Germany Bio-Organic Acid Industry Volume (Million) Forecast, by Application 2020 & 2033
- Table 51: United Kingdom Bio-Organic Acid Industry Revenue (Million) Forecast, by Application 2020 & 2033
- Table 52: United Kingdom Bio-Organic Acid Industry Volume (Million) Forecast, by Application 2020 & 2033
- Table 53: Italy Bio-Organic Acid Industry Revenue (Million) Forecast, by Application 2020 & 2033
- Table 54: Italy Bio-Organic Acid Industry Volume (Million) Forecast, by Application 2020 & 2033
- Table 55: France Bio-Organic Acid Industry Revenue (Million) Forecast, by Application 2020 & 2033
- Table 56: France Bio-Organic Acid Industry Volume (Million) Forecast, by Application 2020 & 2033
- Table 57: Rest of Europe Bio-Organic Acid Industry Revenue (Million) Forecast, by Application 2020 & 2033
- Table 58: Rest of Europe Bio-Organic Acid Industry Volume (Million) Forecast, by Application 2020 & 2033
- Table 59: Global Bio-Organic Acid Industry Revenue Million Forecast, by Raw Material 2020 & 2033
- Table 60: Global Bio-Organic Acid Industry Volume Million Forecast, by Raw Material 2020 & 2033
- Table 61: Global Bio-Organic Acid Industry Revenue Million Forecast, by Product Type 2020 & 2033
- Table 62: Global Bio-Organic Acid Industry Volume Million Forecast, by Product Type 2020 & 2033
- Table 63: Global Bio-Organic Acid Industry Revenue Million Forecast, by Application 2020 & 2033
- Table 64: Global Bio-Organic Acid Industry Volume Million Forecast, by Application 2020 & 2033
- Table 65: Global Bio-Organic Acid Industry Revenue Million Forecast, by Country 2020 & 2033
- Table 66: Global Bio-Organic Acid Industry Volume Million Forecast, by Country 2020 & 2033
- Table 67: Brazil Bio-Organic Acid Industry Revenue (Million) Forecast, by Application 2020 & 2033
- Table 68: Brazil Bio-Organic Acid Industry Volume (Million) Forecast, by Application 2020 & 2033
- Table 69: Argentina Bio-Organic Acid Industry Revenue (Million) Forecast, by Application 2020 & 2033
- Table 70: Argentina Bio-Organic Acid Industry Volume (Million) Forecast, by Application 2020 & 2033
- Table 71: Rest of South America Bio-Organic Acid Industry Revenue (Million) Forecast, by Application 2020 & 2033
- Table 72: Rest of South America Bio-Organic Acid Industry Volume (Million) Forecast, by Application 2020 & 2033
- Table 73: Global Bio-Organic Acid Industry Revenue Million Forecast, by Raw Material 2020 & 2033
- Table 74: Global Bio-Organic Acid Industry Volume Million Forecast, by Raw Material 2020 & 2033
- Table 75: Global Bio-Organic Acid Industry Revenue Million Forecast, by Product Type 2020 & 2033
- Table 76: Global Bio-Organic Acid Industry Volume Million Forecast, by Product Type 2020 & 2033
- Table 77: Global Bio-Organic Acid Industry Revenue Million Forecast, by Application 2020 & 2033
- Table 78: Global Bio-Organic Acid Industry Volume Million Forecast, by Application 2020 & 2033
- Table 79: Global Bio-Organic Acid Industry Revenue Million Forecast, by Country 2020 & 2033
- Table 80: Global Bio-Organic Acid Industry Volume Million Forecast, by Country 2020 & 2033
- Table 81: Saudi Arabia Bio-Organic Acid Industry Revenue (Million) Forecast, by Application 2020 & 2033
- Table 82: Saudi Arabia Bio-Organic Acid Industry Volume (Million) Forecast, by Application 2020 & 2033
- Table 83: South Africa Bio-Organic Acid Industry Revenue (Million) Forecast, by Application 2020 & 2033
- Table 84: South Africa Bio-Organic Acid Industry Volume (Million) Forecast, by Application 2020 & 2033
- Table 85: Rest of Middle East and Africa Bio-Organic Acid Industry Revenue (Million) Forecast, by Application 2020 & 2033
- Table 86: Rest of Middle East and Africa Bio-Organic Acid Industry Volume (Million) Forecast, by Application 2020 & 2033
Frequently Asked Questions
1. What is the projected Compound Annual Growth Rate (CAGR) of the Bio-Organic Acid Industry?
The projected CAGR is approximately > 6.00%.
2. Which companies are prominent players in the Bio-Organic Acid Industry?
Key companies in the market include ADM, Cargill Incorporated, Novozymes, Gfbio, Braskem, PTT Global Chemical Public Company Limited*List Not Exhaustive, Mitsubishi Chemical Corporation, Corbion, BioAmber Inc, Cosun, BASF SE, Abengoa, DSM, NatureWorks LLC, Genomatica.
3. What are the main segments of the Bio-Organic Acid Industry?
The market segments include Raw Material, Product Type, Application.
4. Can you provide details about the market size?
The market size is estimated to be USD XX Million as of 2022.
5. What are some drivers contributing to market growth?
Stringent Regulations Over Conventional Organic Acids; Growing Demand for Bio-based Polymer in Healthcare Applications; Other Drivers.
6. What are the notable trends driving market growth?
Food and Beverage Industry to Dominate The Market.
7. Are there any restraints impacting market growth?
Higher Production Cost of Bio-based Chemicals; Other Restraints.
8. Can you provide examples of recent developments in the market?
October 2022: Corbion announced the production of bio-based lactic acid to fulfill the rising demand for environmentally friendly solutions in the Asia-Pacific region. The company announced its plans to build a new lactic acid facility in Thailand. The company's dedication to supplying bio-based organic acids to a larger market is demonstrated by its expansion.
9. What pricing options are available for accessing the report?
Pricing options include single-user, multi-user, and enterprise licenses priced at USD 4750, USD 5250, and USD 8750 respectively.
10. Is the market size provided in terms of value or volume?
The market size is provided in terms of value, measured in Million and volume, measured in Million.
11. Are there any specific market keywords associated with the report?
Yes, the market keyword associated with the report is "Bio-Organic Acid Industry," which aids in identifying and referencing the specific market segment covered.
12. How do I determine which pricing option suits my needs best?
The pricing options vary based on user requirements and access needs. Individual users may opt for single-user licenses, while businesses requiring broader access may choose multi-user or enterprise licenses for cost-effective access to the report.
13. Are there any additional resources or data provided in the Bio-Organic Acid Industry report?
While the report offers comprehensive insights, it's advisable to review the specific contents or supplementary materials provided to ascertain if additional resources or data are available.
14. How can I stay updated on further developments or reports in the Bio-Organic Acid Industry?
To stay informed about further developments, trends, and reports in the Bio-Organic Acid Industry, consider subscribing to industry newsletters, following relevant companies and organizations, or regularly checking reputable industry news sources and publications.
Methodology
Step 1 - Identification of Relevant Samples Size from Population Database


Step 2 - Approaches for Defining Global Market Size (Value, Volume* & Price*)

Note*: In applicable scenarios
Step 3 - Data Sources
Primary Research
- Web Analytics
- Survey Reports
- Research Institute
- Latest Research Reports
- Opinion Leaders
Secondary Research
- Annual Reports
- White Paper
- Latest Press Release
- Industry Association
- Paid Database
- Investor Presentations

Step 4 - Data Triangulation
Involves using different sources of information in order to increase the validity of a study
These sources are likely to be stakeholders in a program - participants, other researchers, program staff, other community members, and so on.
Then we put all data in single framework & apply various statistical tools to find out the dynamic on the market.
During the analysis stage, feedback from the stakeholder groups would be compared to determine areas of agreement as well as areas of divergence