

Key Insights
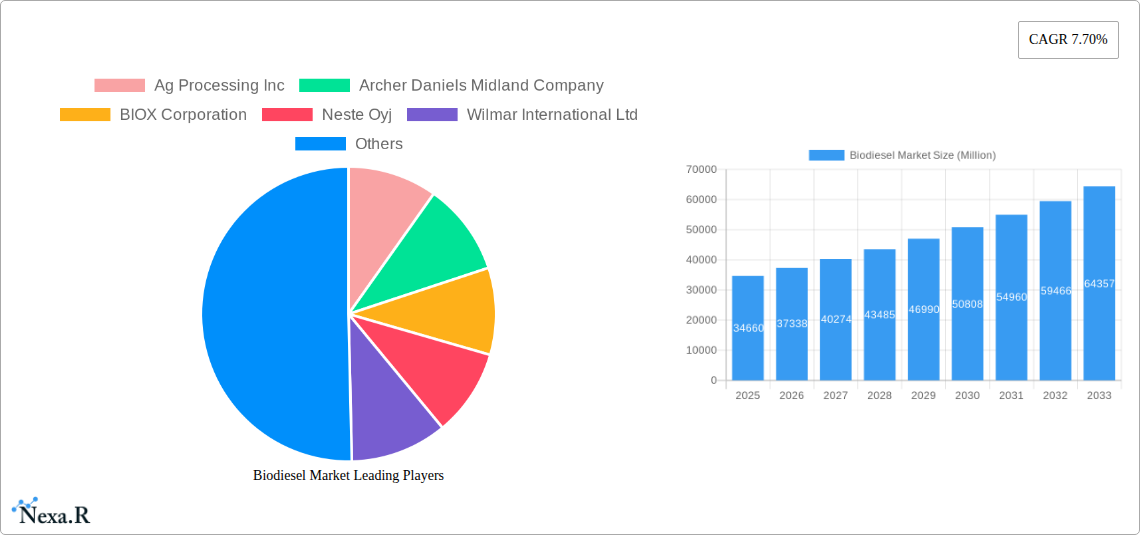
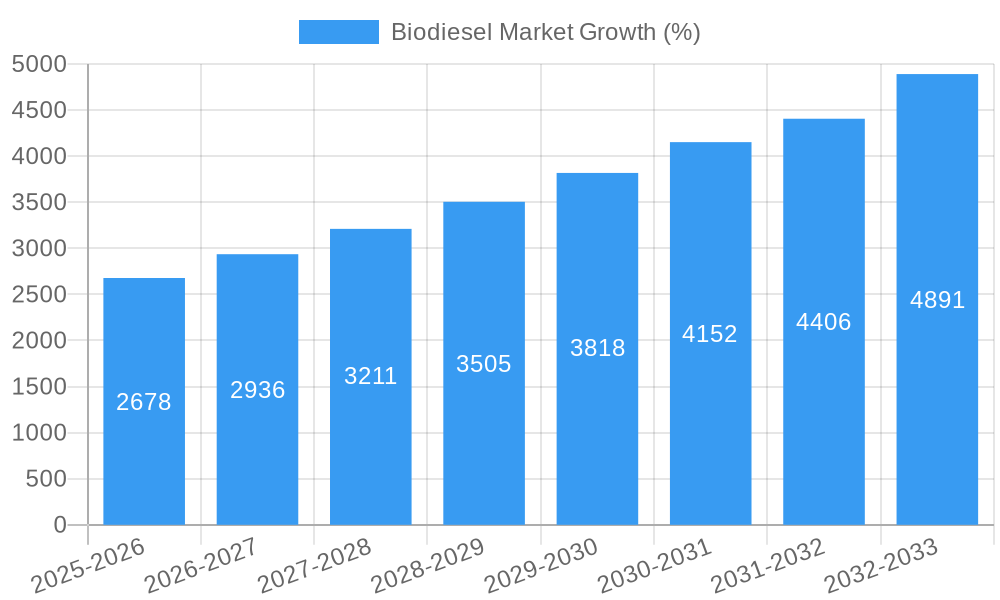
The global biodiesel market, valued at $34.66 billion in 2025, is projected to experience robust growth, driven by increasing environmental concerns and stringent government regulations aimed at reducing carbon emissions from the transportation sector. The market's 7.70% CAGR from 2025 to 2033 indicates a significant expansion, fueled by rising demand for renewable and sustainable energy sources. Key drivers include government incentives promoting biodiesel adoption, growing awareness of its environmental benefits compared to fossil fuels, and increasing investments in biodiesel production infrastructure. The shift towards cleaner transportation fuels, particularly in developed nations, is a major catalyst. While feedstock availability and price volatility pose challenges, technological advancements in biodiesel production are mitigating these risks. The market is segmented by feedstock (animal fat, vegetable oil, and other feedstocks) and application (transportation, power generation, and other applications), with transportation currently dominating the demand. Leading companies like Archer Daniels Midland, Neste Oyj, and Cargill are investing heavily in research and development to improve biodiesel efficiency and expand production capacity. The Asia-Pacific region is expected to witness significant growth, driven by increasing industrialization and government support for renewable energy initiatives in countries like China and India.
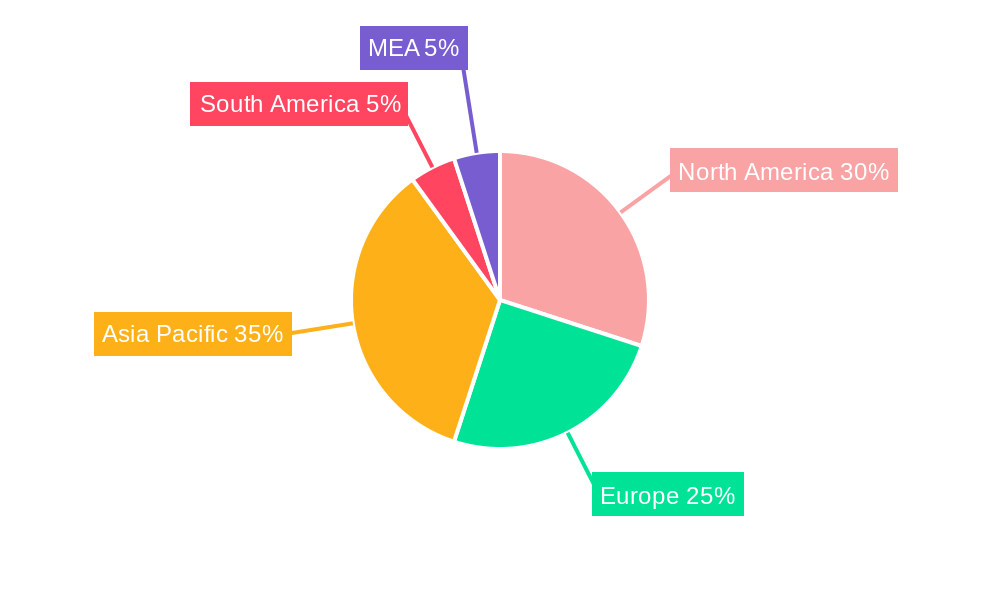
The regional landscape showcases strong growth potential across North America, Europe, and Asia-Pacific. North America benefits from established biodiesel infrastructure and supportive policies, while Europe is witnessing increased adoption across various sectors. The Asia-Pacific region’s rapid economic growth, combined with rising energy demand and environmental concerns, presents a lucrative opportunity for biodiesel producers. South America and the Middle East & Africa are expected to exhibit moderate growth, driven by rising awareness of sustainable fuels and government initiatives. However, the market expansion in these regions faces challenges like limited infrastructure and technological limitations. The overall market outlook remains optimistic, with continuous innovation in production technologies and supportive government policies paving the way for substantial growth over the forecast period.
Biodiesel Market: A Comprehensive Market Research Report (2019-2033)
This comprehensive report provides an in-depth analysis of the global Biodiesel Market, encompassing market dynamics, growth trends, regional dominance, product landscape, key players, and future outlook. The study period spans from 2019 to 2033, with a base year of 2025 and a forecast period of 2025-2033. This report is essential for industry professionals, investors, and stakeholders seeking to understand the current market landscape and future trajectory of the Biodiesel Market, a vital component of the broader renewable energy sector.
Biodiesel Market Dynamics & Structure
The global Biodiesel Market is characterized by a moderately concentrated structure, with key players such as Ag Processing Inc, Archer Daniels Midland Company, and Neste Oyj holding significant market share. However, the market is witnessing increased competition from smaller, specialized biodiesel producers. Technological innovation, particularly in feedstock utilization and production efficiency, is a significant driver, while stringent environmental regulations and government incentives play a crucial role in shaping market growth. The market is also influenced by the availability of competitive substitutes like petroleum diesel and the fluctuating prices of feedstocks. Mergers and acquisitions (M&A) activity has been moderate, with a projected xx deals in the forecast period, largely driven by efforts to expand production capacity and secure feedstock supply chains. End-user demographics are shifting towards increased adoption in transportation and power generation sectors.
- Market Concentration: Moderately concentrated, with top 5 players holding xx% market share in 2025.
- Technological Innovation: Focus on improving feedstock utilization, reducing production costs, and enhancing fuel quality.
- Regulatory Framework: Government incentives and mandates significantly influence market growth.
- Competitive Substitutes: Petroleum diesel remains a primary competitor, with pricing dynamics playing a key role.
- M&A Activity: Projected xx M&A deals between 2025 and 2033.
- Innovation Barriers: High capital investment requirements and technological complexities.
Biodiesel Market Growth Trends & Insights
The Biodiesel Market experienced robust growth during the historical period (2019-2024), exhibiting a Compound Annual Growth Rate (CAGR) of xx%. This growth is attributed to increasing environmental concerns, government policies promoting renewable energy, and rising demand from the transportation sector. The market is expected to maintain significant growth during the forecast period (2025-2033), with a projected CAGR of xx%. Technological advancements, particularly in utilizing diverse feedstocks and improving production efficiency, are driving adoption rates. Consumer behavior is shifting towards greener alternatives, further fueling market growth. However, price volatility of feedstocks and competition from petroleum diesel remain key challenges. Market penetration is estimated at xx% in 2025, with potential for significant increase by 2033.
Dominant Regions, Countries, or Segments in Biodiesel Market
The transportation sector currently dominates the Biodiesel Market, accounting for xx% of total consumption in 2025. Vegetable oil remains the leading feedstock, capturing xx% of the market share, followed by animal fat and other feedstocks. North America and Europe are currently the dominant regions, driven by supportive government policies and a strong focus on sustainability. However, Asia-Pacific is expected to witness the fastest growth due to increasing industrialization and government initiatives promoting renewable energy sources.
- Leading Segment: Transportation (xx% market share in 2025)
- Dominant Feedstock: Vegetable Oil (xx% market share in 2025)
- Key Growth Drivers: Stringent emission regulations, government subsidies, and rising environmental awareness.
- Regional Dominance: North America and Europe in 2025, with Asia-Pacific expected to show rapid growth.
Biodiesel Market Product Landscape
The Biodiesel Market showcases ongoing innovation in feedstock utilization, production processes, and fuel blending technologies. Key developments include advanced biofuel production technologies that enhance efficiency and reduce greenhouse gas emissions. Products are categorized by feedstock type, meeting varying specifications for different applications, with a focus on improving fuel quality, stability, and cold weather performance. The unique selling propositions center around environmental benefits, reduced dependence on fossil fuels, and cost competitiveness in certain applications.
Key Drivers, Barriers & Challenges in Biodiesel Market
Key Drivers:
- Growing environmental concerns and stringent emission regulations are driving the demand for sustainable alternatives to fossil fuels.
- Government incentives and mandates, such as blending mandates, are providing strong impetus for biodiesel adoption.
- Increased focus on energy security and diversification is boosting interest in domestic biodiesel production.
Key Challenges:
- Fluctuating feedstock prices and supply chain disruptions pose significant risks.
- Competition from petroleum diesel, particularly in terms of pricing, remains a major challenge.
- Regulatory hurdles and complexities associated with biodiesel production and distribution can hinder growth.
Emerging Opportunities in Biodiesel Market
Emerging opportunities exist in the utilization of advanced feedstocks like algae and waste cooking oil, leading to higher efficiency and reduced environmental impact. The growing demand for Sustainable Aviation Fuel (SAF) presents a significant opportunity for biodiesel producers to expand into new applications. Furthermore, exploring new market segments, such as marine fuels, offers growth potential. Lastly, technological advancements in production processes may reduce costs and enhance the competitiveness of biodiesel.
Growth Accelerators in the Biodiesel Market Industry
Strategic partnerships between biodiesel producers, technology providers, and policymakers are accelerating market growth. Government investments in research and development are driving technological breakthroughs, leading to enhanced efficiency and cost reductions. Expansion into new geographical markets, especially in developing countries with growing energy demands, presents a significant growth driver. Finally, innovations in fuel distribution and infrastructure are improving accessibility and adoption.
Key Players Shaping the Biodiesel Market Market
- Ag Processing Inc
- Archer Daniels Midland Company
- BIOX Corporation
- Neste Oyj
- Wilmar International Ltd
- Cargill Inc
- Bangchak Corporation Public Company Limited
- Renewable Energy Group Inc
Notable Milestones in Biodiesel Market Sector
- November 2022: Technip Energies secured a contract from TotalEnergies to build a Sustainable Aviation Fuel (SAF) facility in France, capable of producing 210,000 metric tons annually. This signifies a major expansion into the SAF market.
- October 2022: Fluor Corporation received a contract to help Imperial Oil develop a renewable diesel complex in Canada. This illustrates the growing investment in renewable diesel infrastructure.
- February 2022: SLD Pumps & Power switched its fleet to biodiesel, displacing approximately 1 million liters of mineral diesel annually. This signifies increased adoption within various industrial sectors.
In-Depth Biodiesel Market Market Outlook
The Biodiesel Market is poised for continued growth driven by strong environmental regulations, supportive government policies, and increasing consumer demand for sustainable energy sources. Strategic investments in advanced biofuel technologies, expansion into new applications like SAF, and the development of robust supply chains will be crucial in shaping the future market landscape. The market offers significant opportunities for both established players and new entrants seeking to capitalize on the transition towards renewable energy solutions.
Biodiesel Market Segmentation
-
1. Feedstock
- 1.1. Animal Fat
- 1.2. Vegetable Oil
- 1.3. Other Feedstocks
-
2. Application
- 2.1. Transportation
- 2.2. Power Generation
- 2.3. Other Applications
-
3. Geogrpahy
-
3.1. North America
- 3.1.1. United States
- 3.1.2. Canada
- 3.1.3. Rest of North America
-
3.2. Europe
- 3.2.1. Germany
- 3.2.2. France
- 3.2.3. United Kingdom
- 3.2.4. Spain
- 3.2.5. NORDIC
- 3.2.6. Turkey
- 3.2.7. Russia
- 3.2.8. Rest of Europe
-
3.3. Asia-Pacific
- 3.3.1. China
- 3.3.2. India
- 3.3.3. Malaysia
- 3.3.4. Indonesia
- 3.3.5. Vietnam
- 3.3.6. Thailand
- 3.3.7. Japan
- 3.3.8. Australia
- 3.3.9. Rest of Asia-Pacific
-
3.4. South America
- 3.4.1. Brazil
- 3.4.2. Argentina
- 3.4.3. Colombia
- 3.4.4. Rest of South America
-
3.5. Middle East and Africa
- 3.5.1. Saudi Arabia
- 3.5.2. United Arab Emirates
- 3.5.3. Egypt
- 3.5.4. Nigeria
- 3.5.5. Qatar
- 3.5.6. Rest of Middle East and Africa
-
3.1. North America
Biodiesel Market Segmentation By Geography
-
1. North America
- 1.1. United States
- 1.2. Canada
- 1.3. Mexico
-
2. South America
- 2.1. Brazil
- 2.2. Argentina
- 2.3. Rest of South America
-
3. Europe
- 3.1. United Kingdom
- 3.2. Germany
- 3.3. France
- 3.4. Italy
- 3.5. Spain
- 3.6. Russia
- 3.7. Benelux
- 3.8. Nordics
- 3.9. Rest of Europe
-
4. Middle East & Africa
- 4.1. Turkey
- 4.2. Israel
- 4.3. GCC
- 4.4. North Africa
- 4.5. South Africa
- 4.6. Rest of Middle East & Africa
-
5. Asia Pacific
- 5.1. China
- 5.2. India
- 5.3. Japan
- 5.4. South Korea
- 5.5. ASEAN
- 5.6. Oceania
- 5.7. Rest of Asia Pacific
Biodiesel Market REPORT HIGHLIGHTS
| Aspects | Details |
|---|---|
| Study Period | 2019-2033 |
| Base Year | 2024 |
| Estimated Year | 2025 |
| Forecast Period | 2025-2033 |
| Historical Period | 2019-2024 |
| Growth Rate | CAGR of 7.70% from 2019-2033 |
| Segmentation |
|
Table of Contents
- 1. Introduction
- 1.1. Research Scope
- 1.2. Market Segmentation
- 1.3. Research Methodology
- 1.4. Definitions and Assumptions
- 2. Executive Summary
- 2.1. Introduction
- 3. Market Dynamics
- 3.1. Introduction
- 3.2. Market Drivers
- 3.2.1. 4.; The Increasing Demand for Eco-friendly Fuels 4.; Government Support for Biodiesel Production
- 3.3. Market Restrains
- 3.3.1. 4.; The Need for More Feedstock Availability for Biodiesel Generation
- 3.4. Market Trends
- 3.4.1. The Transportation Segment Expected to Dominate the Market
- 4. Market Factor Analysis
- 4.1. Porters Five Forces
- 4.2. Supply/Value Chain
- 4.3. PESTEL analysis
- 4.4. Market Entropy
- 4.5. Patent/Trademark Analysis
- 5. Global Biodiesel Market Analysis, Insights and Forecast, 2019-2031
- 5.1. Market Analysis, Insights and Forecast - by Feedstock
- 5.1.1. Animal Fat
- 5.1.2. Vegetable Oil
- 5.1.3. Other Feedstocks
- 5.2. Market Analysis, Insights and Forecast - by Application
- 5.2.1. Transportation
- 5.2.2. Power Generation
- 5.2.3. Other Applications
- 5.3. Market Analysis, Insights and Forecast - by Geogrpahy
- 5.3.1. North America
- 5.3.1.1. United States
- 5.3.1.2. Canada
- 5.3.1.3. Rest of North America
- 5.3.2. Europe
- 5.3.2.1. Germany
- 5.3.2.2. France
- 5.3.2.3. United Kingdom
- 5.3.2.4. Spain
- 5.3.2.5. NORDIC
- 5.3.2.6. Turkey
- 5.3.2.7. Russia
- 5.3.2.8. Rest of Europe
- 5.3.3. Asia-Pacific
- 5.3.3.1. China
- 5.3.3.2. India
- 5.3.3.3. Malaysia
- 5.3.3.4. Indonesia
- 5.3.3.5. Vietnam
- 5.3.3.6. Thailand
- 5.3.3.7. Japan
- 5.3.3.8. Australia
- 5.3.3.9. Rest of Asia-Pacific
- 5.3.4. South America
- 5.3.4.1. Brazil
- 5.3.4.2. Argentina
- 5.3.4.3. Colombia
- 5.3.4.4. Rest of South America
- 5.3.5. Middle East and Africa
- 5.3.5.1. Saudi Arabia
- 5.3.5.2. United Arab Emirates
- 5.3.5.3. Egypt
- 5.3.5.4. Nigeria
- 5.3.5.5. Qatar
- 5.3.5.6. Rest of Middle East and Africa
- 5.3.1. North America
- 5.4. Market Analysis, Insights and Forecast - by Region
- 5.4.1. North America
- 5.4.2. South America
- 5.4.3. Europe
- 5.4.4. Middle East & Africa
- 5.4.5. Asia Pacific
- 5.1. Market Analysis, Insights and Forecast - by Feedstock
- 6. North America Biodiesel Market Analysis, Insights and Forecast, 2019-2031
- 6.1. Market Analysis, Insights and Forecast - by Feedstock
- 6.1.1. Animal Fat
- 6.1.2. Vegetable Oil
- 6.1.3. Other Feedstocks
- 6.2. Market Analysis, Insights and Forecast - by Application
- 6.2.1. Transportation
- 6.2.2. Power Generation
- 6.2.3. Other Applications
- 6.3. Market Analysis, Insights and Forecast - by Geogrpahy
- 6.3.1. North America
- 6.3.1.1. United States
- 6.3.1.2. Canada
- 6.3.1.3. Rest of North America
- 6.3.2. Europe
- 6.3.2.1. Germany
- 6.3.2.2. France
- 6.3.2.3. United Kingdom
- 6.3.2.4. Spain
- 6.3.2.5. NORDIC
- 6.3.2.6. Turkey
- 6.3.2.7. Russia
- 6.3.2.8. Rest of Europe
- 6.3.3. Asia-Pacific
- 6.3.3.1. China
- 6.3.3.2. India
- 6.3.3.3. Malaysia
- 6.3.3.4. Indonesia
- 6.3.3.5. Vietnam
- 6.3.3.6. Thailand
- 6.3.3.7. Japan
- 6.3.3.8. Australia
- 6.3.3.9. Rest of Asia-Pacific
- 6.3.4. South America
- 6.3.4.1. Brazil
- 6.3.4.2. Argentina
- 6.3.4.3. Colombia
- 6.3.4.4. Rest of South America
- 6.3.5. Middle East and Africa
- 6.3.5.1. Saudi Arabia
- 6.3.5.2. United Arab Emirates
- 6.3.5.3. Egypt
- 6.3.5.4. Nigeria
- 6.3.5.5. Qatar
- 6.3.5.6. Rest of Middle East and Africa
- 6.3.1. North America
- 6.1. Market Analysis, Insights and Forecast - by Feedstock
- 7. South America Biodiesel Market Analysis, Insights and Forecast, 2019-2031
- 7.1. Market Analysis, Insights and Forecast - by Feedstock
- 7.1.1. Animal Fat
- 7.1.2. Vegetable Oil
- 7.1.3. Other Feedstocks
- 7.2. Market Analysis, Insights and Forecast - by Application
- 7.2.1. Transportation
- 7.2.2. Power Generation
- 7.2.3. Other Applications
- 7.3. Market Analysis, Insights and Forecast - by Geogrpahy
- 7.3.1. North America
- 7.3.1.1. United States
- 7.3.1.2. Canada
- 7.3.1.3. Rest of North America
- 7.3.2. Europe
- 7.3.2.1. Germany
- 7.3.2.2. France
- 7.3.2.3. United Kingdom
- 7.3.2.4. Spain
- 7.3.2.5. NORDIC
- 7.3.2.6. Turkey
- 7.3.2.7. Russia
- 7.3.2.8. Rest of Europe
- 7.3.3. Asia-Pacific
- 7.3.3.1. China
- 7.3.3.2. India
- 7.3.3.3. Malaysia
- 7.3.3.4. Indonesia
- 7.3.3.5. Vietnam
- 7.3.3.6. Thailand
- 7.3.3.7. Japan
- 7.3.3.8. Australia
- 7.3.3.9. Rest of Asia-Pacific
- 7.3.4. South America
- 7.3.4.1. Brazil
- 7.3.4.2. Argentina
- 7.3.4.3. Colombia
- 7.3.4.4. Rest of South America
- 7.3.5. Middle East and Africa
- 7.3.5.1. Saudi Arabia
- 7.3.5.2. United Arab Emirates
- 7.3.5.3. Egypt
- 7.3.5.4. Nigeria
- 7.3.5.5. Qatar
- 7.3.5.6. Rest of Middle East and Africa
- 7.3.1. North America
- 7.1. Market Analysis, Insights and Forecast - by Feedstock
- 8. Europe Biodiesel Market Analysis, Insights and Forecast, 2019-2031
- 8.1. Market Analysis, Insights and Forecast - by Feedstock
- 8.1.1. Animal Fat
- 8.1.2. Vegetable Oil
- 8.1.3. Other Feedstocks
- 8.2. Market Analysis, Insights and Forecast - by Application
- 8.2.1. Transportation
- 8.2.2. Power Generation
- 8.2.3. Other Applications
- 8.3. Market Analysis, Insights and Forecast - by Geogrpahy
- 8.3.1. North America
- 8.3.1.1. United States
- 8.3.1.2. Canada
- 8.3.1.3. Rest of North America
- 8.3.2. Europe
- 8.3.2.1. Germany
- 8.3.2.2. France
- 8.3.2.3. United Kingdom
- 8.3.2.4. Spain
- 8.3.2.5. NORDIC
- 8.3.2.6. Turkey
- 8.3.2.7. Russia
- 8.3.2.8. Rest of Europe
- 8.3.3. Asia-Pacific
- 8.3.3.1. China
- 8.3.3.2. India
- 8.3.3.3. Malaysia
- 8.3.3.4. Indonesia
- 8.3.3.5. Vietnam
- 8.3.3.6. Thailand
- 8.3.3.7. Japan
- 8.3.3.8. Australia
- 8.3.3.9. Rest of Asia-Pacific
- 8.3.4. South America
- 8.3.4.1. Brazil
- 8.3.4.2. Argentina
- 8.3.4.3. Colombia
- 8.3.4.4. Rest of South America
- 8.3.5. Middle East and Africa
- 8.3.5.1. Saudi Arabia
- 8.3.5.2. United Arab Emirates
- 8.3.5.3. Egypt
- 8.3.5.4. Nigeria
- 8.3.5.5. Qatar
- 8.3.5.6. Rest of Middle East and Africa
- 8.3.1. North America
- 8.1. Market Analysis, Insights and Forecast - by Feedstock
- 9. Middle East & Africa Biodiesel Market Analysis, Insights and Forecast, 2019-2031
- 9.1. Market Analysis, Insights and Forecast - by Feedstock
- 9.1.1. Animal Fat
- 9.1.2. Vegetable Oil
- 9.1.3. Other Feedstocks
- 9.2. Market Analysis, Insights and Forecast - by Application
- 9.2.1. Transportation
- 9.2.2. Power Generation
- 9.2.3. Other Applications
- 9.3. Market Analysis, Insights and Forecast - by Geogrpahy
- 9.3.1. North America
- 9.3.1.1. United States
- 9.3.1.2. Canada
- 9.3.1.3. Rest of North America
- 9.3.2. Europe
- 9.3.2.1. Germany
- 9.3.2.2. France
- 9.3.2.3. United Kingdom
- 9.3.2.4. Spain
- 9.3.2.5. NORDIC
- 9.3.2.6. Turkey
- 9.3.2.7. Russia
- 9.3.2.8. Rest of Europe
- 9.3.3. Asia-Pacific
- 9.3.3.1. China
- 9.3.3.2. India
- 9.3.3.3. Malaysia
- 9.3.3.4. Indonesia
- 9.3.3.5. Vietnam
- 9.3.3.6. Thailand
- 9.3.3.7. Japan
- 9.3.3.8. Australia
- 9.3.3.9. Rest of Asia-Pacific
- 9.3.4. South America
- 9.3.4.1. Brazil
- 9.3.4.2. Argentina
- 9.3.4.3. Colombia
- 9.3.4.4. Rest of South America
- 9.3.5. Middle East and Africa
- 9.3.5.1. Saudi Arabia
- 9.3.5.2. United Arab Emirates
- 9.3.5.3. Egypt
- 9.3.5.4. Nigeria
- 9.3.5.5. Qatar
- 9.3.5.6. Rest of Middle East and Africa
- 9.3.1. North America
- 9.1. Market Analysis, Insights and Forecast - by Feedstock
- 10. Asia Pacific Biodiesel Market Analysis, Insights and Forecast, 2019-2031
- 10.1. Market Analysis, Insights and Forecast - by Feedstock
- 10.1.1. Animal Fat
- 10.1.2. Vegetable Oil
- 10.1.3. Other Feedstocks
- 10.2. Market Analysis, Insights and Forecast - by Application
- 10.2.1. Transportation
- 10.2.2. Power Generation
- 10.2.3. Other Applications
- 10.3. Market Analysis, Insights and Forecast - by Geogrpahy
- 10.3.1. North America
- 10.3.1.1. United States
- 10.3.1.2. Canada
- 10.3.1.3. Rest of North America
- 10.3.2. Europe
- 10.3.2.1. Germany
- 10.3.2.2. France
- 10.3.2.3. United Kingdom
- 10.3.2.4. Spain
- 10.3.2.5. NORDIC
- 10.3.2.6. Turkey
- 10.3.2.7. Russia
- 10.3.2.8. Rest of Europe
- 10.3.3. Asia-Pacific
- 10.3.3.1. China
- 10.3.3.2. India
- 10.3.3.3. Malaysia
- 10.3.3.4. Indonesia
- 10.3.3.5. Vietnam
- 10.3.3.6. Thailand
- 10.3.3.7. Japan
- 10.3.3.8. Australia
- 10.3.3.9. Rest of Asia-Pacific
- 10.3.4. South America
- 10.3.4.1. Brazil
- 10.3.4.2. Argentina
- 10.3.4.3. Colombia
- 10.3.4.4. Rest of South America
- 10.3.5. Middle East and Africa
- 10.3.5.1. Saudi Arabia
- 10.3.5.2. United Arab Emirates
- 10.3.5.3. Egypt
- 10.3.5.4. Nigeria
- 10.3.5.5. Qatar
- 10.3.5.6. Rest of Middle East and Africa
- 10.3.1. North America
- 10.1. Market Analysis, Insights and Forecast - by Feedstock
- 11. North America Biodiesel Market Analysis, Insights and Forecast, 2019-2031
- 11.1. Market Analysis, Insights and Forecast - By Country/Sub-region
- 11.1.1 United States
- 11.1.2 Canada
- 11.1.3 Mexico
- 12. Europe Biodiesel Market Analysis, Insights and Forecast, 2019-2031
- 12.1. Market Analysis, Insights and Forecast - By Country/Sub-region
- 12.1.1 Germany
- 12.1.2 United Kingdom
- 12.1.3 France
- 12.1.4 Spain
- 12.1.5 Italy
- 12.1.6 Spain
- 12.1.7 Belgium
- 12.1.8 Netherland
- 12.1.9 Nordics
- 12.1.10 Rest of Europe
- 13. Asia Pacific Biodiesel Market Analysis, Insights and Forecast, 2019-2031
- 13.1. Market Analysis, Insights and Forecast - By Country/Sub-region
- 13.1.1 China
- 13.1.2 Japan
- 13.1.3 India
- 13.1.4 South Korea
- 13.1.5 Southeast Asia
- 13.1.6 Australia
- 13.1.7 Indonesia
- 13.1.8 Phillipes
- 13.1.9 Singapore
- 13.1.10 Thailandc
- 13.1.11 Rest of Asia Pacific
- 14. South America Biodiesel Market Analysis, Insights and Forecast, 2019-2031
- 14.1. Market Analysis, Insights and Forecast - By Country/Sub-region
- 14.1.1 Brazil
- 14.1.2 Argentina
- 14.1.3 Peru
- 14.1.4 Chile
- 14.1.5 Colombia
- 14.1.6 Ecuador
- 14.1.7 Venezuela
- 14.1.8 Rest of South America
- 15. MEA Biodiesel Market Analysis, Insights and Forecast, 2019-2031
- 15.1. Market Analysis, Insights and Forecast - By Country/Sub-region
- 15.1.1 United Arab Emirates
- 15.1.2 Saudi Arabia
- 15.1.3 South Africa
- 15.1.4 Rest of Middle East and Africa
- 16. Competitive Analysis
- 16.1. Global Market Share Analysis 2024
- 16.2. Company Profiles
- 16.2.1 Ag Processing Inc
- 16.2.1.1. Overview
- 16.2.1.2. Products
- 16.2.1.3. SWOT Analysis
- 16.2.1.4. Recent Developments
- 16.2.1.5. Financials (Based on Availability)
- 16.2.2 Archer Daniels Midland Company
- 16.2.2.1. Overview
- 16.2.2.2. Products
- 16.2.2.3. SWOT Analysis
- 16.2.2.4. Recent Developments
- 16.2.2.5. Financials (Based on Availability)
- 16.2.3 BIOX Corporation
- 16.2.3.1. Overview
- 16.2.3.2. Products
- 16.2.3.3. SWOT Analysis
- 16.2.3.4. Recent Developments
- 16.2.3.5. Financials (Based on Availability)
- 16.2.4 Neste Oyj
- 16.2.4.1. Overview
- 16.2.4.2. Products
- 16.2.4.3. SWOT Analysis
- 16.2.4.4. Recent Developments
- 16.2.4.5. Financials (Based on Availability)
- 16.2.5 Wilmar International Ltd
- 16.2.5.1. Overview
- 16.2.5.2. Products
- 16.2.5.3. SWOT Analysis
- 16.2.5.4. Recent Developments
- 16.2.5.5. Financials (Based on Availability)
- 16.2.6 Cargill Inc
- 16.2.6.1. Overview
- 16.2.6.2. Products
- 16.2.6.3. SWOT Analysis
- 16.2.6.4. Recent Developments
- 16.2.6.5. Financials (Based on Availability)
- 16.2.7 Bangchak Corporation Public Company Limited
- 16.2.7.1. Overview
- 16.2.7.2. Products
- 16.2.7.3. SWOT Analysis
- 16.2.7.4. Recent Developments
- 16.2.7.5. Financials (Based on Availability)
- 16.2.8 Renewable Energy Group Inc
- 16.2.8.1. Overview
- 16.2.8.2. Products
- 16.2.8.3. SWOT Analysis
- 16.2.8.4. Recent Developments
- 16.2.8.5. Financials (Based on Availability)
- 16.2.1 Ag Processing Inc
List of Figures
- Figure 1: Global Biodiesel Market Revenue Breakdown (Million, %) by Region 2024 & 2032
- Figure 2: Global Biodiesel Market Volume Breakdown (Gallons, %) by Region 2024 & 2032
- Figure 3: North America Biodiesel Market Revenue (Million), by Country 2024 & 2032
- Figure 4: North America Biodiesel Market Volume (Gallons), by Country 2024 & 2032
- Figure 5: North America Biodiesel Market Revenue Share (%), by Country 2024 & 2032
- Figure 6: North America Biodiesel Market Volume Share (%), by Country 2024 & 2032
- Figure 7: Europe Biodiesel Market Revenue (Million), by Country 2024 & 2032
- Figure 8: Europe Biodiesel Market Volume (Gallons), by Country 2024 & 2032
- Figure 9: Europe Biodiesel Market Revenue Share (%), by Country 2024 & 2032
- Figure 10: Europe Biodiesel Market Volume Share (%), by Country 2024 & 2032
- Figure 11: Asia Pacific Biodiesel Market Revenue (Million), by Country 2024 & 2032
- Figure 12: Asia Pacific Biodiesel Market Volume (Gallons), by Country 2024 & 2032
- Figure 13: Asia Pacific Biodiesel Market Revenue Share (%), by Country 2024 & 2032
- Figure 14: Asia Pacific Biodiesel Market Volume Share (%), by Country 2024 & 2032
- Figure 15: South America Biodiesel Market Revenue (Million), by Country 2024 & 2032
- Figure 16: South America Biodiesel Market Volume (Gallons), by Country 2024 & 2032
- Figure 17: South America Biodiesel Market Revenue Share (%), by Country 2024 & 2032
- Figure 18: South America Biodiesel Market Volume Share (%), by Country 2024 & 2032
- Figure 19: MEA Biodiesel Market Revenue (Million), by Country 2024 & 2032
- Figure 20: MEA Biodiesel Market Volume (Gallons), by Country 2024 & 2032
- Figure 21: MEA Biodiesel Market Revenue Share (%), by Country 2024 & 2032
- Figure 22: MEA Biodiesel Market Volume Share (%), by Country 2024 & 2032
- Figure 23: North America Biodiesel Market Revenue (Million), by Feedstock 2024 & 2032
- Figure 24: North America Biodiesel Market Volume (Gallons), by Feedstock 2024 & 2032
- Figure 25: North America Biodiesel Market Revenue Share (%), by Feedstock 2024 & 2032
- Figure 26: North America Biodiesel Market Volume Share (%), by Feedstock 2024 & 2032
- Figure 27: North America Biodiesel Market Revenue (Million), by Application 2024 & 2032
- Figure 28: North America Biodiesel Market Volume (Gallons), by Application 2024 & 2032
- Figure 29: North America Biodiesel Market Revenue Share (%), by Application 2024 & 2032
- Figure 30: North America Biodiesel Market Volume Share (%), by Application 2024 & 2032
- Figure 31: North America Biodiesel Market Revenue (Million), by Geogrpahy 2024 & 2032
- Figure 32: North America Biodiesel Market Volume (Gallons), by Geogrpahy 2024 & 2032
- Figure 33: North America Biodiesel Market Revenue Share (%), by Geogrpahy 2024 & 2032
- Figure 34: North America Biodiesel Market Volume Share (%), by Geogrpahy 2024 & 2032
- Figure 35: North America Biodiesel Market Revenue (Million), by Country 2024 & 2032
- Figure 36: North America Biodiesel Market Volume (Gallons), by Country 2024 & 2032
- Figure 37: North America Biodiesel Market Revenue Share (%), by Country 2024 & 2032
- Figure 38: North America Biodiesel Market Volume Share (%), by Country 2024 & 2032
- Figure 39: South America Biodiesel Market Revenue (Million), by Feedstock 2024 & 2032
- Figure 40: South America Biodiesel Market Volume (Gallons), by Feedstock 2024 & 2032
- Figure 41: South America Biodiesel Market Revenue Share (%), by Feedstock 2024 & 2032
- Figure 42: South America Biodiesel Market Volume Share (%), by Feedstock 2024 & 2032
- Figure 43: South America Biodiesel Market Revenue (Million), by Application 2024 & 2032
- Figure 44: South America Biodiesel Market Volume (Gallons), by Application 2024 & 2032
- Figure 45: South America Biodiesel Market Revenue Share (%), by Application 2024 & 2032
- Figure 46: South America Biodiesel Market Volume Share (%), by Application 2024 & 2032
- Figure 47: South America Biodiesel Market Revenue (Million), by Geogrpahy 2024 & 2032
- Figure 48: South America Biodiesel Market Volume (Gallons), by Geogrpahy 2024 & 2032
- Figure 49: South America Biodiesel Market Revenue Share (%), by Geogrpahy 2024 & 2032
- Figure 50: South America Biodiesel Market Volume Share (%), by Geogrpahy 2024 & 2032
- Figure 51: South America Biodiesel Market Revenue (Million), by Country 2024 & 2032
- Figure 52: South America Biodiesel Market Volume (Gallons), by Country 2024 & 2032
- Figure 53: South America Biodiesel Market Revenue Share (%), by Country 2024 & 2032
- Figure 54: South America Biodiesel Market Volume Share (%), by Country 2024 & 2032
- Figure 55: Europe Biodiesel Market Revenue (Million), by Feedstock 2024 & 2032
- Figure 56: Europe Biodiesel Market Volume (Gallons), by Feedstock 2024 & 2032
- Figure 57: Europe Biodiesel Market Revenue Share (%), by Feedstock 2024 & 2032
- Figure 58: Europe Biodiesel Market Volume Share (%), by Feedstock 2024 & 2032
- Figure 59: Europe Biodiesel Market Revenue (Million), by Application 2024 & 2032
- Figure 60: Europe Biodiesel Market Volume (Gallons), by Application 2024 & 2032
- Figure 61: Europe Biodiesel Market Revenue Share (%), by Application 2024 & 2032
- Figure 62: Europe Biodiesel Market Volume Share (%), by Application 2024 & 2032
- Figure 63: Europe Biodiesel Market Revenue (Million), by Geogrpahy 2024 & 2032
- Figure 64: Europe Biodiesel Market Volume (Gallons), by Geogrpahy 2024 & 2032
- Figure 65: Europe Biodiesel Market Revenue Share (%), by Geogrpahy 2024 & 2032
- Figure 66: Europe Biodiesel Market Volume Share (%), by Geogrpahy 2024 & 2032
- Figure 67: Europe Biodiesel Market Revenue (Million), by Country 2024 & 2032
- Figure 68: Europe Biodiesel Market Volume (Gallons), by Country 2024 & 2032
- Figure 69: Europe Biodiesel Market Revenue Share (%), by Country 2024 & 2032
- Figure 70: Europe Biodiesel Market Volume Share (%), by Country 2024 & 2032
- Figure 71: Middle East & Africa Biodiesel Market Revenue (Million), by Feedstock 2024 & 2032
- Figure 72: Middle East & Africa Biodiesel Market Volume (Gallons), by Feedstock 2024 & 2032
- Figure 73: Middle East & Africa Biodiesel Market Revenue Share (%), by Feedstock 2024 & 2032
- Figure 74: Middle East & Africa Biodiesel Market Volume Share (%), by Feedstock 2024 & 2032
- Figure 75: Middle East & Africa Biodiesel Market Revenue (Million), by Application 2024 & 2032
- Figure 76: Middle East & Africa Biodiesel Market Volume (Gallons), by Application 2024 & 2032
- Figure 77: Middle East & Africa Biodiesel Market Revenue Share (%), by Application 2024 & 2032
- Figure 78: Middle East & Africa Biodiesel Market Volume Share (%), by Application 2024 & 2032
- Figure 79: Middle East & Africa Biodiesel Market Revenue (Million), by Geogrpahy 2024 & 2032
- Figure 80: Middle East & Africa Biodiesel Market Volume (Gallons), by Geogrpahy 2024 & 2032
- Figure 81: Middle East & Africa Biodiesel Market Revenue Share (%), by Geogrpahy 2024 & 2032
- Figure 82: Middle East & Africa Biodiesel Market Volume Share (%), by Geogrpahy 2024 & 2032
- Figure 83: Middle East & Africa Biodiesel Market Revenue (Million), by Country 2024 & 2032
- Figure 84: Middle East & Africa Biodiesel Market Volume (Gallons), by Country 2024 & 2032
- Figure 85: Middle East & Africa Biodiesel Market Revenue Share (%), by Country 2024 & 2032
- Figure 86: Middle East & Africa Biodiesel Market Volume Share (%), by Country 2024 & 2032
- Figure 87: Asia Pacific Biodiesel Market Revenue (Million), by Feedstock 2024 & 2032
- Figure 88: Asia Pacific Biodiesel Market Volume (Gallons), by Feedstock 2024 & 2032
- Figure 89: Asia Pacific Biodiesel Market Revenue Share (%), by Feedstock 2024 & 2032
- Figure 90: Asia Pacific Biodiesel Market Volume Share (%), by Feedstock 2024 & 2032
- Figure 91: Asia Pacific Biodiesel Market Revenue (Million), by Application 2024 & 2032
- Figure 92: Asia Pacific Biodiesel Market Volume (Gallons), by Application 2024 & 2032
- Figure 93: Asia Pacific Biodiesel Market Revenue Share (%), by Application 2024 & 2032
- Figure 94: Asia Pacific Biodiesel Market Volume Share (%), by Application 2024 & 2032
- Figure 95: Asia Pacific Biodiesel Market Revenue (Million), by Geogrpahy 2024 & 2032
- Figure 96: Asia Pacific Biodiesel Market Volume (Gallons), by Geogrpahy 2024 & 2032
- Figure 97: Asia Pacific Biodiesel Market Revenue Share (%), by Geogrpahy 2024 & 2032
- Figure 98: Asia Pacific Biodiesel Market Volume Share (%), by Geogrpahy 2024 & 2032
- Figure 99: Asia Pacific Biodiesel Market Revenue (Million), by Country 2024 & 2032
- Figure 100: Asia Pacific Biodiesel Market Volume (Gallons), by Country 2024 & 2032
- Figure 101: Asia Pacific Biodiesel Market Revenue Share (%), by Country 2024 & 2032
- Figure 102: Asia Pacific Biodiesel Market Volume Share (%), by Country 2024 & 2032
List of Tables
- Table 1: Global Biodiesel Market Revenue Million Forecast, by Region 2019 & 2032
- Table 2: Global Biodiesel Market Volume Gallons Forecast, by Region 2019 & 2032
- Table 3: Global Biodiesel Market Revenue Million Forecast, by Feedstock 2019 & 2032
- Table 4: Global Biodiesel Market Volume Gallons Forecast, by Feedstock 2019 & 2032
- Table 5: Global Biodiesel Market Revenue Million Forecast, by Application 2019 & 2032
- Table 6: Global Biodiesel Market Volume Gallons Forecast, by Application 2019 & 2032
- Table 7: Global Biodiesel Market Revenue Million Forecast, by Geogrpahy 2019 & 2032
- Table 8: Global Biodiesel Market Volume Gallons Forecast, by Geogrpahy 2019 & 2032
- Table 9: Global Biodiesel Market Revenue Million Forecast, by Region 2019 & 2032
- Table 10: Global Biodiesel Market Volume Gallons Forecast, by Region 2019 & 2032
- Table 11: Global Biodiesel Market Revenue Million Forecast, by Country 2019 & 2032
- Table 12: Global Biodiesel Market Volume Gallons Forecast, by Country 2019 & 2032
- Table 13: United States Biodiesel Market Revenue (Million) Forecast, by Application 2019 & 2032
- Table 14: United States Biodiesel Market Volume (Gallons) Forecast, by Application 2019 & 2032
- Table 15: Canada Biodiesel Market Revenue (Million) Forecast, by Application 2019 & 2032
- Table 16: Canada Biodiesel Market Volume (Gallons) Forecast, by Application 2019 & 2032
- Table 17: Mexico Biodiesel Market Revenue (Million) Forecast, by Application 2019 & 2032
- Table 18: Mexico Biodiesel Market Volume (Gallons) Forecast, by Application 2019 & 2032
- Table 19: Global Biodiesel Market Revenue Million Forecast, by Country 2019 & 2032
- Table 20: Global Biodiesel Market Volume Gallons Forecast, by Country 2019 & 2032
- Table 21: Germany Biodiesel Market Revenue (Million) Forecast, by Application 2019 & 2032
- Table 22: Germany Biodiesel Market Volume (Gallons) Forecast, by Application 2019 & 2032
- Table 23: United Kingdom Biodiesel Market Revenue (Million) Forecast, by Application 2019 & 2032
- Table 24: United Kingdom Biodiesel Market Volume (Gallons) Forecast, by Application 2019 & 2032
- Table 25: France Biodiesel Market Revenue (Million) Forecast, by Application 2019 & 2032
- Table 26: France Biodiesel Market Volume (Gallons) Forecast, by Application 2019 & 2032
- Table 27: Spain Biodiesel Market Revenue (Million) Forecast, by Application 2019 & 2032
- Table 28: Spain Biodiesel Market Volume (Gallons) Forecast, by Application 2019 & 2032
- Table 29: Italy Biodiesel Market Revenue (Million) Forecast, by Application 2019 & 2032
- Table 30: Italy Biodiesel Market Volume (Gallons) Forecast, by Application 2019 & 2032
- Table 31: Spain Biodiesel Market Revenue (Million) Forecast, by Application 2019 & 2032
- Table 32: Spain Biodiesel Market Volume (Gallons) Forecast, by Application 2019 & 2032
- Table 33: Belgium Biodiesel Market Revenue (Million) Forecast, by Application 2019 & 2032
- Table 34: Belgium Biodiesel Market Volume (Gallons) Forecast, by Application 2019 & 2032
- Table 35: Netherland Biodiesel Market Revenue (Million) Forecast, by Application 2019 & 2032
- Table 36: Netherland Biodiesel Market Volume (Gallons) Forecast, by Application 2019 & 2032
- Table 37: Nordics Biodiesel Market Revenue (Million) Forecast, by Application 2019 & 2032
- Table 38: Nordics Biodiesel Market Volume (Gallons) Forecast, by Application 2019 & 2032
- Table 39: Rest of Europe Biodiesel Market Revenue (Million) Forecast, by Application 2019 & 2032
- Table 40: Rest of Europe Biodiesel Market Volume (Gallons) Forecast, by Application 2019 & 2032
- Table 41: Global Biodiesel Market Revenue Million Forecast, by Country 2019 & 2032
- Table 42: Global Biodiesel Market Volume Gallons Forecast, by Country 2019 & 2032
- Table 43: China Biodiesel Market Revenue (Million) Forecast, by Application 2019 & 2032
- Table 44: China Biodiesel Market Volume (Gallons) Forecast, by Application 2019 & 2032
- Table 45: Japan Biodiesel Market Revenue (Million) Forecast, by Application 2019 & 2032
- Table 46: Japan Biodiesel Market Volume (Gallons) Forecast, by Application 2019 & 2032
- Table 47: India Biodiesel Market Revenue (Million) Forecast, by Application 2019 & 2032
- Table 48: India Biodiesel Market Volume (Gallons) Forecast, by Application 2019 & 2032
- Table 49: South Korea Biodiesel Market Revenue (Million) Forecast, by Application 2019 & 2032
- Table 50: South Korea Biodiesel Market Volume (Gallons) Forecast, by Application 2019 & 2032
- Table 51: Southeast Asia Biodiesel Market Revenue (Million) Forecast, by Application 2019 & 2032
- Table 52: Southeast Asia Biodiesel Market Volume (Gallons) Forecast, by Application 2019 & 2032
- Table 53: Australia Biodiesel Market Revenue (Million) Forecast, by Application 2019 & 2032
- Table 54: Australia Biodiesel Market Volume (Gallons) Forecast, by Application 2019 & 2032
- Table 55: Indonesia Biodiesel Market Revenue (Million) Forecast, by Application 2019 & 2032
- Table 56: Indonesia Biodiesel Market Volume (Gallons) Forecast, by Application 2019 & 2032
- Table 57: Phillipes Biodiesel Market Revenue (Million) Forecast, by Application 2019 & 2032
- Table 58: Phillipes Biodiesel Market Volume (Gallons) Forecast, by Application 2019 & 2032
- Table 59: Singapore Biodiesel Market Revenue (Million) Forecast, by Application 2019 & 2032
- Table 60: Singapore Biodiesel Market Volume (Gallons) Forecast, by Application 2019 & 2032
- Table 61: Thailandc Biodiesel Market Revenue (Million) Forecast, by Application 2019 & 2032
- Table 62: Thailandc Biodiesel Market Volume (Gallons) Forecast, by Application 2019 & 2032
- Table 63: Rest of Asia Pacific Biodiesel Market Revenue (Million) Forecast, by Application 2019 & 2032
- Table 64: Rest of Asia Pacific Biodiesel Market Volume (Gallons) Forecast, by Application 2019 & 2032
- Table 65: Global Biodiesel Market Revenue Million Forecast, by Country 2019 & 2032
- Table 66: Global Biodiesel Market Volume Gallons Forecast, by Country 2019 & 2032
- Table 67: Brazil Biodiesel Market Revenue (Million) Forecast, by Application 2019 & 2032
- Table 68: Brazil Biodiesel Market Volume (Gallons) Forecast, by Application 2019 & 2032
- Table 69: Argentina Biodiesel Market Revenue (Million) Forecast, by Application 2019 & 2032
- Table 70: Argentina Biodiesel Market Volume (Gallons) Forecast, by Application 2019 & 2032
- Table 71: Peru Biodiesel Market Revenue (Million) Forecast, by Application 2019 & 2032
- Table 72: Peru Biodiesel Market Volume (Gallons) Forecast, by Application 2019 & 2032
- Table 73: Chile Biodiesel Market Revenue (Million) Forecast, by Application 2019 & 2032
- Table 74: Chile Biodiesel Market Volume (Gallons) Forecast, by Application 2019 & 2032
- Table 75: Colombia Biodiesel Market Revenue (Million) Forecast, by Application 2019 & 2032
- Table 76: Colombia Biodiesel Market Volume (Gallons) Forecast, by Application 2019 & 2032
- Table 77: Ecuador Biodiesel Market Revenue (Million) Forecast, by Application 2019 & 2032
- Table 78: Ecuador Biodiesel Market Volume (Gallons) Forecast, by Application 2019 & 2032
- Table 79: Venezuela Biodiesel Market Revenue (Million) Forecast, by Application 2019 & 2032
- Table 80: Venezuela Biodiesel Market Volume (Gallons) Forecast, by Application 2019 & 2032
- Table 81: Rest of South America Biodiesel Market Revenue (Million) Forecast, by Application 2019 & 2032
- Table 82: Rest of South America Biodiesel Market Volume (Gallons) Forecast, by Application 2019 & 2032
- Table 83: Global Biodiesel Market Revenue Million Forecast, by Country 2019 & 2032
- Table 84: Global Biodiesel Market Volume Gallons Forecast, by Country 2019 & 2032
- Table 85: United Arab Emirates Biodiesel Market Revenue (Million) Forecast, by Application 2019 & 2032
- Table 86: United Arab Emirates Biodiesel Market Volume (Gallons) Forecast, by Application 2019 & 2032
- Table 87: Saudi Arabia Biodiesel Market Revenue (Million) Forecast, by Application 2019 & 2032
- Table 88: Saudi Arabia Biodiesel Market Volume (Gallons) Forecast, by Application 2019 & 2032
- Table 89: South Africa Biodiesel Market Revenue (Million) Forecast, by Application 2019 & 2032
- Table 90: South Africa Biodiesel Market Volume (Gallons) Forecast, by Application 2019 & 2032
- Table 91: Rest of Middle East and Africa Biodiesel Market Revenue (Million) Forecast, by Application 2019 & 2032
- Table 92: Rest of Middle East and Africa Biodiesel Market Volume (Gallons) Forecast, by Application 2019 & 2032
- Table 93: Global Biodiesel Market Revenue Million Forecast, by Feedstock 2019 & 2032
- Table 94: Global Biodiesel Market Volume Gallons Forecast, by Feedstock 2019 & 2032
- Table 95: Global Biodiesel Market Revenue Million Forecast, by Application 2019 & 2032
- Table 96: Global Biodiesel Market Volume Gallons Forecast, by Application 2019 & 2032
- Table 97: Global Biodiesel Market Revenue Million Forecast, by Geogrpahy 2019 & 2032
- Table 98: Global Biodiesel Market Volume Gallons Forecast, by Geogrpahy 2019 & 2032
- Table 99: Global Biodiesel Market Revenue Million Forecast, by Country 2019 & 2032
- Table 100: Global Biodiesel Market Volume Gallons Forecast, by Country 2019 & 2032
- Table 101: United States Biodiesel Market Revenue (Million) Forecast, by Application 2019 & 2032
- Table 102: United States Biodiesel Market Volume (Gallons) Forecast, by Application 2019 & 2032
- Table 103: Canada Biodiesel Market Revenue (Million) Forecast, by Application 2019 & 2032
- Table 104: Canada Biodiesel Market Volume (Gallons) Forecast, by Application 2019 & 2032
- Table 105: Mexico Biodiesel Market Revenue (Million) Forecast, by Application 2019 & 2032
- Table 106: Mexico Biodiesel Market Volume (Gallons) Forecast, by Application 2019 & 2032
- Table 107: Global Biodiesel Market Revenue Million Forecast, by Feedstock 2019 & 2032
- Table 108: Global Biodiesel Market Volume Gallons Forecast, by Feedstock 2019 & 2032
- Table 109: Global Biodiesel Market Revenue Million Forecast, by Application 2019 & 2032
- Table 110: Global Biodiesel Market Volume Gallons Forecast, by Application 2019 & 2032
- Table 111: Global Biodiesel Market Revenue Million Forecast, by Geogrpahy 2019 & 2032
- Table 112: Global Biodiesel Market Volume Gallons Forecast, by Geogrpahy 2019 & 2032
- Table 113: Global Biodiesel Market Revenue Million Forecast, by Country 2019 & 2032
- Table 114: Global Biodiesel Market Volume Gallons Forecast, by Country 2019 & 2032
- Table 115: Brazil Biodiesel Market Revenue (Million) Forecast, by Application 2019 & 2032
- Table 116: Brazil Biodiesel Market Volume (Gallons) Forecast, by Application 2019 & 2032
- Table 117: Argentina Biodiesel Market Revenue (Million) Forecast, by Application 2019 & 2032
- Table 118: Argentina Biodiesel Market Volume (Gallons) Forecast, by Application 2019 & 2032
- Table 119: Rest of South America Biodiesel Market Revenue (Million) Forecast, by Application 2019 & 2032
- Table 120: Rest of South America Biodiesel Market Volume (Gallons) Forecast, by Application 2019 & 2032
- Table 121: Global Biodiesel Market Revenue Million Forecast, by Feedstock 2019 & 2032
- Table 122: Global Biodiesel Market Volume Gallons Forecast, by Feedstock 2019 & 2032
- Table 123: Global Biodiesel Market Revenue Million Forecast, by Application 2019 & 2032
- Table 124: Global Biodiesel Market Volume Gallons Forecast, by Application 2019 & 2032
- Table 125: Global Biodiesel Market Revenue Million Forecast, by Geogrpahy 2019 & 2032
- Table 126: Global Biodiesel Market Volume Gallons Forecast, by Geogrpahy 2019 & 2032
- Table 127: Global Biodiesel Market Revenue Million Forecast, by Country 2019 & 2032
- Table 128: Global Biodiesel Market Volume Gallons Forecast, by Country 2019 & 2032
- Table 129: United Kingdom Biodiesel Market Revenue (Million) Forecast, by Application 2019 & 2032
- Table 130: United Kingdom Biodiesel Market Volume (Gallons) Forecast, by Application 2019 & 2032
- Table 131: Germany Biodiesel Market Revenue (Million) Forecast, by Application 2019 & 2032
- Table 132: Germany Biodiesel Market Volume (Gallons) Forecast, by Application 2019 & 2032
- Table 133: France Biodiesel Market Revenue (Million) Forecast, by Application 2019 & 2032
- Table 134: France Biodiesel Market Volume (Gallons) Forecast, by Application 2019 & 2032
- Table 135: Italy Biodiesel Market Revenue (Million) Forecast, by Application 2019 & 2032
- Table 136: Italy Biodiesel Market Volume (Gallons) Forecast, by Application 2019 & 2032
- Table 137: Spain Biodiesel Market Revenue (Million) Forecast, by Application 2019 & 2032
- Table 138: Spain Biodiesel Market Volume (Gallons) Forecast, by Application 2019 & 2032
- Table 139: Russia Biodiesel Market Revenue (Million) Forecast, by Application 2019 & 2032
- Table 140: Russia Biodiesel Market Volume (Gallons) Forecast, by Application 2019 & 2032
- Table 141: Benelux Biodiesel Market Revenue (Million) Forecast, by Application 2019 & 2032
- Table 142: Benelux Biodiesel Market Volume (Gallons) Forecast, by Application 2019 & 2032
- Table 143: Nordics Biodiesel Market Revenue (Million) Forecast, by Application 2019 & 2032
- Table 144: Nordics Biodiesel Market Volume (Gallons) Forecast, by Application 2019 & 2032
- Table 145: Rest of Europe Biodiesel Market Revenue (Million) Forecast, by Application 2019 & 2032
- Table 146: Rest of Europe Biodiesel Market Volume (Gallons) Forecast, by Application 2019 & 2032
- Table 147: Global Biodiesel Market Revenue Million Forecast, by Feedstock 2019 & 2032
- Table 148: Global Biodiesel Market Volume Gallons Forecast, by Feedstock 2019 & 2032
- Table 149: Global Biodiesel Market Revenue Million Forecast, by Application 2019 & 2032
- Table 150: Global Biodiesel Market Volume Gallons Forecast, by Application 2019 & 2032
- Table 151: Global Biodiesel Market Revenue Million Forecast, by Geogrpahy 2019 & 2032
- Table 152: Global Biodiesel Market Volume Gallons Forecast, by Geogrpahy 2019 & 2032
- Table 153: Global Biodiesel Market Revenue Million Forecast, by Country 2019 & 2032
- Table 154: Global Biodiesel Market Volume Gallons Forecast, by Country 2019 & 2032
- Table 155: Turkey Biodiesel Market Revenue (Million) Forecast, by Application 2019 & 2032
- Table 156: Turkey Biodiesel Market Volume (Gallons) Forecast, by Application 2019 & 2032
- Table 157: Israel Biodiesel Market Revenue (Million) Forecast, by Application 2019 & 2032
- Table 158: Israel Biodiesel Market Volume (Gallons) Forecast, by Application 2019 & 2032
- Table 159: GCC Biodiesel Market Revenue (Million) Forecast, by Application 2019 & 2032
- Table 160: GCC Biodiesel Market Volume (Gallons) Forecast, by Application 2019 & 2032
- Table 161: North Africa Biodiesel Market Revenue (Million) Forecast, by Application 2019 & 2032
- Table 162: North Africa Biodiesel Market Volume (Gallons) Forecast, by Application 2019 & 2032
- Table 163: South Africa Biodiesel Market Revenue (Million) Forecast, by Application 2019 & 2032
- Table 164: South Africa Biodiesel Market Volume (Gallons) Forecast, by Application 2019 & 2032
- Table 165: Rest of Middle East & Africa Biodiesel Market Revenue (Million) Forecast, by Application 2019 & 2032
- Table 166: Rest of Middle East & Africa Biodiesel Market Volume (Gallons) Forecast, by Application 2019 & 2032
- Table 167: Global Biodiesel Market Revenue Million Forecast, by Feedstock 2019 & 2032
- Table 168: Global Biodiesel Market Volume Gallons Forecast, by Feedstock 2019 & 2032
- Table 169: Global Biodiesel Market Revenue Million Forecast, by Application 2019 & 2032
- Table 170: Global Biodiesel Market Volume Gallons Forecast, by Application 2019 & 2032
- Table 171: Global Biodiesel Market Revenue Million Forecast, by Geogrpahy 2019 & 2032
- Table 172: Global Biodiesel Market Volume Gallons Forecast, by Geogrpahy 2019 & 2032
- Table 173: Global Biodiesel Market Revenue Million Forecast, by Country 2019 & 2032
- Table 174: Global Biodiesel Market Volume Gallons Forecast, by Country 2019 & 2032
- Table 175: China Biodiesel Market Revenue (Million) Forecast, by Application 2019 & 2032
- Table 176: China Biodiesel Market Volume (Gallons) Forecast, by Application 2019 & 2032
- Table 177: India Biodiesel Market Revenue (Million) Forecast, by Application 2019 & 2032
- Table 178: India Biodiesel Market Volume (Gallons) Forecast, by Application 2019 & 2032
- Table 179: Japan Biodiesel Market Revenue (Million) Forecast, by Application 2019 & 2032
- Table 180: Japan Biodiesel Market Volume (Gallons) Forecast, by Application 2019 & 2032
- Table 181: South Korea Biodiesel Market Revenue (Million) Forecast, by Application 2019 & 2032
- Table 182: South Korea Biodiesel Market Volume (Gallons) Forecast, by Application 2019 & 2032
- Table 183: ASEAN Biodiesel Market Revenue (Million) Forecast, by Application 2019 & 2032
- Table 184: ASEAN Biodiesel Market Volume (Gallons) Forecast, by Application 2019 & 2032
- Table 185: Oceania Biodiesel Market Revenue (Million) Forecast, by Application 2019 & 2032
- Table 186: Oceania Biodiesel Market Volume (Gallons) Forecast, by Application 2019 & 2032
- Table 187: Rest of Asia Pacific Biodiesel Market Revenue (Million) Forecast, by Application 2019 & 2032
- Table 188: Rest of Asia Pacific Biodiesel Market Volume (Gallons) Forecast, by Application 2019 & 2032
Frequently Asked Questions
1. What is the projected Compound Annual Growth Rate (CAGR) of the Biodiesel Market?
The projected CAGR is approximately 7.70%.
2. Which companies are prominent players in the Biodiesel Market?
Key companies in the market include Ag Processing Inc, Archer Daniels Midland Company, BIOX Corporation, Neste Oyj, Wilmar International Ltd, Cargill Inc, Bangchak Corporation Public Company Limited, Renewable Energy Group Inc.
3. What are the main segments of the Biodiesel Market?
The market segments include Feedstock, Application, Geogrpahy.
4. Can you provide details about the market size?
The market size is estimated to be USD 34.66 Million as of 2022.
5. What are some drivers contributing to market growth?
4.; The Increasing Demand for Eco-friendly Fuels 4.; Government Support for Biodiesel Production.
6. What are the notable trends driving market growth?
The Transportation Segment Expected to Dominate the Market.
7. Are there any restraints impacting market growth?
4.; The Need for More Feedstock Availability for Biodiesel Generation.
8. Can you provide examples of recent developments in the market?
November 2022: Technip Energies received a contract from TotalEnergies to produce Sustainable Aviation Fuel (SAF) at the Grandpuits platform in France. The contract covers the EPC assistance for converting the refinery into a zero-crude platform focused on SAF. This facility can produce around 210,000 metric tons per year.
9. What pricing options are available for accessing the report?
Pricing options include single-user, multi-user, and enterprise licenses priced at USD 4750, USD 5250, and USD 8750 respectively.
10. Is the market size provided in terms of value or volume?
The market size is provided in terms of value, measured in Million and volume, measured in Gallons.
11. Are there any specific market keywords associated with the report?
Yes, the market keyword associated with the report is "Biodiesel Market," which aids in identifying and referencing the specific market segment covered.
12. How do I determine which pricing option suits my needs best?
The pricing options vary based on user requirements and access needs. Individual users may opt for single-user licenses, while businesses requiring broader access may choose multi-user or enterprise licenses for cost-effective access to the report.
13. Are there any additional resources or data provided in the Biodiesel Market report?
While the report offers comprehensive insights, it's advisable to review the specific contents or supplementary materials provided to ascertain if additional resources or data are available.
14. How can I stay updated on further developments or reports in the Biodiesel Market?
To stay informed about further developments, trends, and reports in the Biodiesel Market, consider subscribing to industry newsletters, following relevant companies and organizations, or regularly checking reputable industry news sources and publications.
Methodology
Step 1 - Identification of Relevant Samples Size from Population Database


Step 2 - Approaches for Defining Global Market Size (Value, Volume* & Price*)

Note*: In applicable scenarios
Step 3 - Data Sources
Primary Research
- Web Analytics
- Survey Reports
- Research Institute
- Latest Research Reports
- Opinion Leaders
Secondary Research
- Annual Reports
- White Paper
- Latest Press Release
- Industry Association
- Paid Database
- Investor Presentations

Step 4 - Data Triangulation
Involves using different sources of information in order to increase the validity of a study
These sources are likely to be stakeholders in a program - participants, other researchers, program staff, other community members, and so on.
Then we put all data in single framework & apply various statistical tools to find out the dynamic on the market.
During the analysis stage, feedback from the stakeholder groups would be compared to determine areas of agreement as well as areas of divergence
