

Key Insights
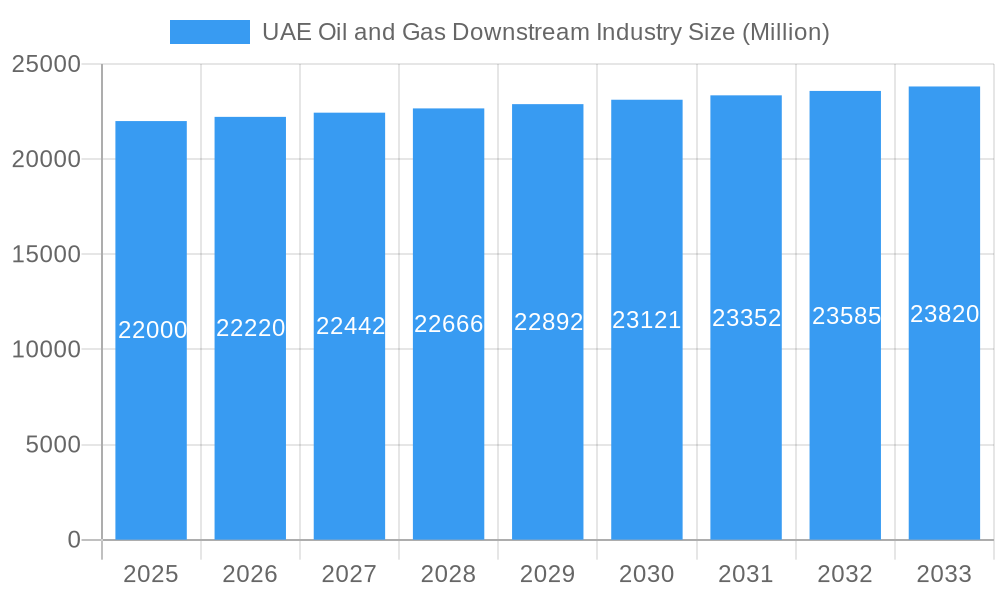
The United Arab Emirates' oil and gas downstream sector, comprising refining, petrochemicals, and marketing, is a dynamic and expanding market. Driven by robust domestic demand and strategic infrastructure investments, the sector is projected for substantial growth. A Compound Annual Growth Rate (CAGR) of 3.7% indicates consistent expansion. Based on UAE's prominent role in global oil production, its expanding petrochemical industry, and commitment to downstream diversification, the market size is estimated at $3.4 billion in the base year of 2024. Key growth drivers include significant investments in refinery upgrades for higher-value petrochemical production, increasing demand for refined petroleum products domestically and regionally, and government-led initiatives for industrial diversification. Strategic international partnerships are also enhancing technological advancements and operational efficiency.
UAE Oil and Gas Downstream Industry Market Size (In Billion)
Despite positive outlook, the sector faces challenges, including long-term restraints from global energy transition initiatives and volatility in international crude oil prices affecting profitability. Maintaining regional and global competitiveness requires continuous innovation and adaptation to evolving environmental regulations. Understanding market segmentation (upstream, midstream, downstream) and geographical nuances (onshore/offshore) is vital for identifying investment opportunities and risks. Key stakeholders, including ADNOC, Emirates National Oil Co., ExxonMobil, and TotalEnergies, are pivotal in shaping the sector's future through existing infrastructure and expansion projects. Prioritizing value-added products and sustainable practices will be essential for the UAE's oil and gas downstream industry's enduring success.
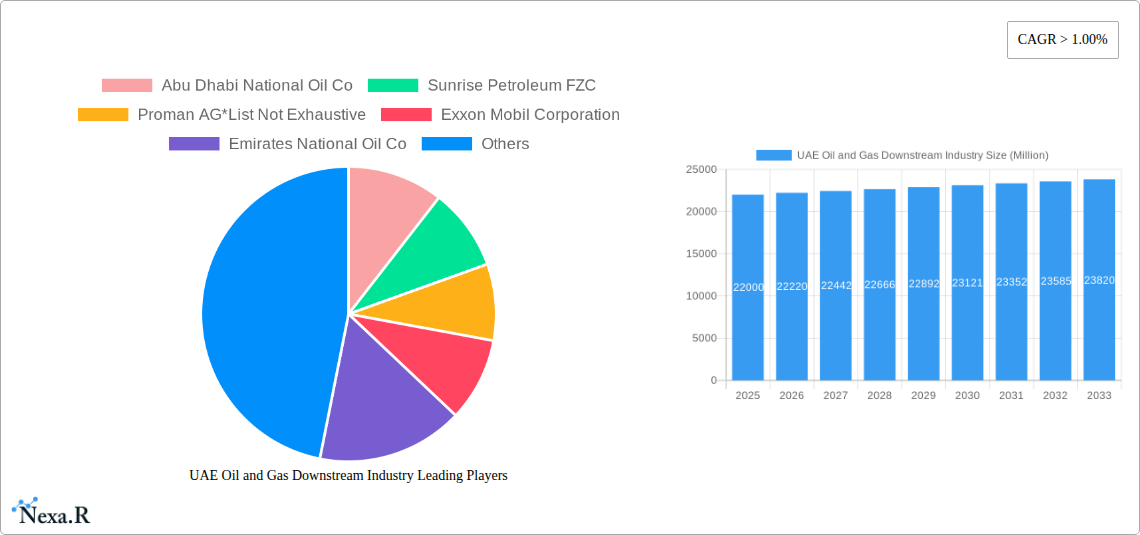
UAE Oil and Gas Downstream Industry Company Market Share
UAE Oil and Gas Downstream Industry Market Report: 2019-2033
This comprehensive report provides an in-depth analysis of the UAE's dynamic oil and gas downstream industry, offering invaluable insights for industry professionals, investors, and strategic decision-makers. Covering the period from 2019 to 2033, with a focus on 2025, this report unveils market trends, growth drivers, challenges, and opportunities within this crucial sector. The report analyzes key segments (Upstream, Midstream, Downstream), applications (Onshore, Offshore), and dominant players, including ADNOC, Emirates National Oil Co, and TotalEnergies SA, providing a complete picture of the UAE's downstream landscape.
UAE Oil and Gas Downstream Industry Market Dynamics & Structure
The UAE's oil and gas downstream sector is characterized by a concentrated market structure, with significant players like ADNOC holding substantial market share (estimated at xx%). Technological innovation, driven by the need for enhanced efficiency and sustainability, is a key dynamic, although barriers to entry, such as high capital expenditure requirements and stringent regulatory frameworks, remain significant. The industry is witnessing increased adoption of advanced technologies like digitalization and automation to optimize operations and reduce environmental impact. Furthermore, the competitive landscape is influenced by the presence of both domestic and international players, leading to strategic mergers and acquisitions (M&A) activity. Over the historical period (2019-2024), M&A deal volume totaled approximately xx million USD, with a notable increase in activity in recent years.
- Market Concentration: Highly concentrated, with major players controlling a significant portion of the market.
- Technological Innovation: Driven by efficiency gains, environmental concerns, and digital transformation.
- Regulatory Framework: Stringent regulations influence investment and operational strategies.
- Competitive Substitutes: Limited direct substitutes, but increasing competition from renewable energy sources.
- End-User Demographics: Primarily focused on industrial and commercial sectors, with growing demand from the domestic market.
- M&A Trends: Increasing M&A activity driven by consolidation and expansion strategies.
UAE Oil and Gas Downstream Industry Growth Trends & Insights
The UAE's oil and gas downstream market has experienced significant growth over the past few years, driven by increasing domestic demand and regional exports. From 2019 to 2024, the market exhibited a Compound Annual Growth Rate (CAGR) of xx%, reaching a market size of xx million USD in 2024. This growth is projected to continue, with a forecasted CAGR of xx% from 2025 to 2033, reaching xx million USD by 2033. Technological advancements, such as the adoption of smart technologies and automation, are significantly impacting efficiency and production capacity. Consumer behavior, however, is shifting towards more sustainable and environmentally conscious products, putting pressure on companies to adapt and invest in greener technologies. Market penetration for advanced technologies is projected to reach xx% by 2033.
Dominant Regions, Countries, or Segments in UAE Oil and Gas Downstream Industry
The downstream segment dominates the UAE oil and gas market, driven by strong domestic demand and a strategic focus on petrochemical production. Ruwais, Abu Dhabi, is a key hub for refining and petrochemical activities, benefiting from significant investments in infrastructure and proximity to key resources. The onshore sector currently holds a larger market share than the offshore sector due to easier accessibility and established infrastructure. Government policies supporting industrial diversification and economic diversification are further boosting growth.
- Key Drivers:
- Government investments in infrastructure
- Strategic location and access to resources
- Growing domestic and regional demand
- Favorable economic policies promoting industrial growth
- Dominance Factors:
- Concentrated infrastructure in specific regions
- Established supply chains and logistical networks
- Significant government support for development
UAE Oil and Gas Downstream Industry Product Landscape
The UAE's downstream industry produces a diverse range of products, including refined petroleum products (gasoline, diesel, jet fuel), petrochemicals (ethylene, propylene, polyethylene), and specialty chemicals. Recent innovations focus on improving product quality, enhancing efficiency, and minimizing environmental impact. The industry is witnessing a shift toward high-value-added products and the integration of advanced technologies to enhance product performance and sustainability.
Key Drivers, Barriers & Challenges in UAE Oil and Gas Downstream Industry
Key Drivers: Increased domestic demand, government investments in infrastructure development, and strategic partnerships to expand production capacity are major growth drivers. Furthermore, technological advancements are improving efficiency and reducing environmental impact.
Key Challenges: Maintaining supply chain resilience amid geopolitical instability, complying with stringent environmental regulations, and managing intense competition in the global market represent key hurdles. The cost of new technologies and skilled labor pose additional challenges.
Emerging Opportunities in UAE Oil and Gas Downstream Industry
The UAE's downstream sector offers significant opportunities in specialty chemicals, sustainable fuels, and circular economy initiatives. Untapped markets within the region and growing demand for eco-friendly products create promising avenues for growth. Furthermore, innovative applications of petrochemicals in emerging sectors like advanced materials and 3D printing present further potential.
Growth Accelerators in the UAE Oil and Gas Downstream Industry Industry
Technological advancements, particularly in automation and digitalization, are boosting efficiency and optimizing production processes. Strategic partnerships between domestic and international companies are fostering knowledge transfer and attracting investment. Furthermore, government initiatives promoting diversification and sustainability are creating a conducive environment for long-term growth.
Key Players Shaping the UAE Oil and Gas Downstream Industry Market
- Abu Dhabi National Oil Co (ADNOC)
- Sunrise Petroleum FZC
- Proman AG
- Exxon Mobil Corporation
- Emirates National Oil Co (ENOC)
- TotalEnergies SA
- Royal Dutch Shell PLC
- Abu Dhabi Polymers Company Ltd
Notable Milestones in UAE Oil and Gas Downstream Industry Sector
- March 2022: Proman and ADNOC agree to build the UAE's first world-scale methanol production facility (1.8 million tons/year capacity).
- December 2021: Technip Energies and TARGET Engineering awarded a contract to build a new Ethane Cracker Unit at the Borouge 4 complex (1,500 KTA capacity).
In-Depth UAE Oil and Gas Downstream Industry Market Outlook
The UAE's oil and gas downstream sector is poised for continued growth, driven by technological advancements, strategic investments, and a supportive regulatory environment. Opportunities abound in specialty chemicals, sustainable fuels, and circular economy initiatives, offering significant potential for market expansion and value creation. Strategic partnerships and innovation will be crucial for companies to thrive in this evolving landscape.
UAE Oil and Gas Downstream Industry Segmentation
- 1. Refining
- 2. Petrochemicals
UAE Oil and Gas Downstream Industry Segmentation By Geography
-
1. North America
- 1.1. United States
- 1.2. Canada
- 1.3. Mexico
-
2. South America
- 2.1. Brazil
- 2.2. Argentina
- 2.3. Rest of South America
-
3. Europe
- 3.1. United Kingdom
- 3.2. Germany
- 3.3. France
- 3.4. Italy
- 3.5. Spain
- 3.6. Russia
- 3.7. Benelux
- 3.8. Nordics
- 3.9. Rest of Europe
-
4. Middle East & Africa
- 4.1. Turkey
- 4.2. Israel
- 4.3. GCC
- 4.4. North Africa
- 4.5. South Africa
- 4.6. Rest of Middle East & Africa
-
5. Asia Pacific
- 5.1. China
- 5.2. India
- 5.3. Japan
- 5.4. South Korea
- 5.5. ASEAN
- 5.6. Oceania
- 5.7. Rest of Asia Pacific
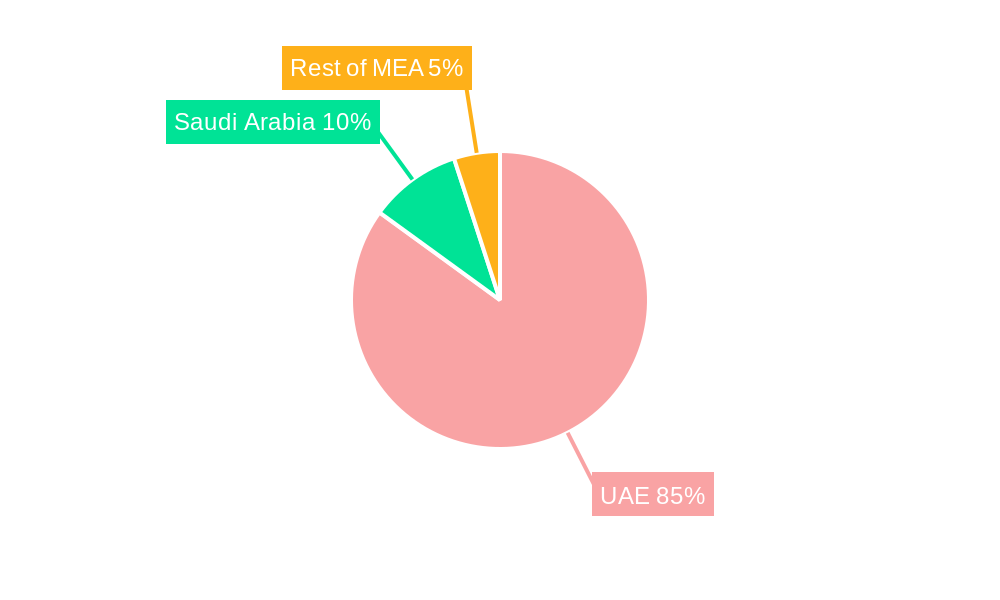
UAE Oil and Gas Downstream Industry Regional Market Share
Geographic Coverage of UAE Oil and Gas Downstream Industry
UAE Oil and Gas Downstream Industry REPORT HIGHLIGHTS
| Aspects | Details |
|---|---|
| Study Period | 2020-2034 |
| Base Year | 2025 |
| Estimated Year | 2026 |
| Forecast Period | 2026-2034 |
| Historical Period | 2020-2025 |
| Growth Rate | CAGR of 3.7% from 2020-2034 |
| Segmentation |
|
Table of Contents
- 1. Introduction
- 1.1. Research Scope
- 1.2. Market Segmentation
- 1.3. Research Methodology
- 1.4. Definitions and Assumptions
- 2. Executive Summary
- 2.1. Introduction
- 3. Market Dynamics
- 3.1. Introduction
- 3.2. Market Drivers
- 3.2.1. 4.; Increasing Renewables Capacity in Thailand4.; Rising Modernization of Existing Transmission and Distribution Infrastructure
- 3.3. Market Restrains
- 3.3.1. 4.; Huge Capital Expenditure Required for Carrying out Modernization of Existing Facilities
- 3.4. Market Trends
- 3.4.1. Refining Sector to Witness Significant Growth
- 4. Market Factor Analysis
- 4.1. Porters Five Forces
- 4.2. Supply/Value Chain
- 4.3. PESTEL analysis
- 4.4. Market Entropy
- 4.5. Patent/Trademark Analysis
- 5. Global UAE Oil and Gas Downstream Industry Analysis, Insights and Forecast, 2020-2032
- 5.1. Market Analysis, Insights and Forecast - by Refining
- 5.2. Market Analysis, Insights and Forecast - by Petrochemicals
- 5.3. Market Analysis, Insights and Forecast - by Region
- 5.3.1. North America
- 5.3.2. South America
- 5.3.3. Europe
- 5.3.4. Middle East & Africa
- 5.3.5. Asia Pacific
- 5.1. Market Analysis, Insights and Forecast - by Refining
- 6. North America UAE Oil and Gas Downstream Industry Analysis, Insights and Forecast, 2020-2032
- 6.1. Market Analysis, Insights and Forecast - by Refining
- 6.2. Market Analysis, Insights and Forecast - by Petrochemicals
- 6.1. Market Analysis, Insights and Forecast - by Refining
- 7. South America UAE Oil and Gas Downstream Industry Analysis, Insights and Forecast, 2020-2032
- 7.1. Market Analysis, Insights and Forecast - by Refining
- 7.2. Market Analysis, Insights and Forecast - by Petrochemicals
- 7.1. Market Analysis, Insights and Forecast - by Refining
- 8. Europe UAE Oil and Gas Downstream Industry Analysis, Insights and Forecast, 2020-2032
- 8.1. Market Analysis, Insights and Forecast - by Refining
- 8.2. Market Analysis, Insights and Forecast - by Petrochemicals
- 8.1. Market Analysis, Insights and Forecast - by Refining
- 9. Middle East & Africa UAE Oil and Gas Downstream Industry Analysis, Insights and Forecast, 2020-2032
- 9.1. Market Analysis, Insights and Forecast - by Refining
- 9.2. Market Analysis, Insights and Forecast - by Petrochemicals
- 9.1. Market Analysis, Insights and Forecast - by Refining
- 10. Asia Pacific UAE Oil and Gas Downstream Industry Analysis, Insights and Forecast, 2020-2032
- 10.1. Market Analysis, Insights and Forecast - by Refining
- 10.2. Market Analysis, Insights and Forecast - by Petrochemicals
- 10.1. Market Analysis, Insights and Forecast - by Refining
- 11. Competitive Analysis
- 11.1. Global Market Share Analysis 2025
- 11.2. Company Profiles
- 11.2.1 Abu Dhabi National Oil Co
- 11.2.1.1. Overview
- 11.2.1.2. Products
- 11.2.1.3. SWOT Analysis
- 11.2.1.4. Recent Developments
- 11.2.1.5. Financials (Based on Availability)
- 11.2.2 Sunrise Petroleum FZC
- 11.2.2.1. Overview
- 11.2.2.2. Products
- 11.2.2.3. SWOT Analysis
- 11.2.2.4. Recent Developments
- 11.2.2.5. Financials (Based on Availability)
- 11.2.3 Proman AG*List Not Exhaustive
- 11.2.3.1. Overview
- 11.2.3.2. Products
- 11.2.3.3. SWOT Analysis
- 11.2.3.4. Recent Developments
- 11.2.3.5. Financials (Based on Availability)
- 11.2.4 Exxon Mobil Corporation
- 11.2.4.1. Overview
- 11.2.4.2. Products
- 11.2.4.3. SWOT Analysis
- 11.2.4.4. Recent Developments
- 11.2.4.5. Financials (Based on Availability)
- 11.2.5 Emirates National Oil Co
- 11.2.5.1. Overview
- 11.2.5.2. Products
- 11.2.5.3. SWOT Analysis
- 11.2.5.4. Recent Developments
- 11.2.5.5. Financials (Based on Availability)
- 11.2.6 TotalEnergies SA
- 11.2.6.1. Overview
- 11.2.6.2. Products
- 11.2.6.3. SWOT Analysis
- 11.2.6.4. Recent Developments
- 11.2.6.5. Financials (Based on Availability)
- 11.2.7 Royal Dutch Shell PLC
- 11.2.7.1. Overview
- 11.2.7.2. Products
- 11.2.7.3. SWOT Analysis
- 11.2.7.4. Recent Developments
- 11.2.7.5. Financials (Based on Availability)
- 11.2.8 Abu Dhabi Polymers Company Ltd
- 11.2.8.1. Overview
- 11.2.8.2. Products
- 11.2.8.3. SWOT Analysis
- 11.2.8.4. Recent Developments
- 11.2.8.5. Financials (Based on Availability)
- 11.2.1 Abu Dhabi National Oil Co
List of Figures
- Figure 1: Global UAE Oil and Gas Downstream Industry Revenue Breakdown (billion, %) by Region 2025 & 2033
- Figure 2: Global UAE Oil and Gas Downstream Industry Volume Breakdown (Tonnes, %) by Region 2025 & 2033
- Figure 3: North America UAE Oil and Gas Downstream Industry Revenue (billion), by Refining 2025 & 2033
- Figure 4: North America UAE Oil and Gas Downstream Industry Volume (Tonnes), by Refining 2025 & 2033
- Figure 5: North America UAE Oil and Gas Downstream Industry Revenue Share (%), by Refining 2025 & 2033
- Figure 6: North America UAE Oil and Gas Downstream Industry Volume Share (%), by Refining 2025 & 2033
- Figure 7: North America UAE Oil and Gas Downstream Industry Revenue (billion), by Petrochemicals 2025 & 2033
- Figure 8: North America UAE Oil and Gas Downstream Industry Volume (Tonnes), by Petrochemicals 2025 & 2033
- Figure 9: North America UAE Oil and Gas Downstream Industry Revenue Share (%), by Petrochemicals 2025 & 2033
- Figure 10: North America UAE Oil and Gas Downstream Industry Volume Share (%), by Petrochemicals 2025 & 2033
- Figure 11: North America UAE Oil and Gas Downstream Industry Revenue (billion), by Country 2025 & 2033
- Figure 12: North America UAE Oil and Gas Downstream Industry Volume (Tonnes), by Country 2025 & 2033
- Figure 13: North America UAE Oil and Gas Downstream Industry Revenue Share (%), by Country 2025 & 2033
- Figure 14: North America UAE Oil and Gas Downstream Industry Volume Share (%), by Country 2025 & 2033
- Figure 15: South America UAE Oil and Gas Downstream Industry Revenue (billion), by Refining 2025 & 2033
- Figure 16: South America UAE Oil and Gas Downstream Industry Volume (Tonnes), by Refining 2025 & 2033
- Figure 17: South America UAE Oil and Gas Downstream Industry Revenue Share (%), by Refining 2025 & 2033
- Figure 18: South America UAE Oil and Gas Downstream Industry Volume Share (%), by Refining 2025 & 2033
- Figure 19: South America UAE Oil and Gas Downstream Industry Revenue (billion), by Petrochemicals 2025 & 2033
- Figure 20: South America UAE Oil and Gas Downstream Industry Volume (Tonnes), by Petrochemicals 2025 & 2033
- Figure 21: South America UAE Oil and Gas Downstream Industry Revenue Share (%), by Petrochemicals 2025 & 2033
- Figure 22: South America UAE Oil and Gas Downstream Industry Volume Share (%), by Petrochemicals 2025 & 2033
- Figure 23: South America UAE Oil and Gas Downstream Industry Revenue (billion), by Country 2025 & 2033
- Figure 24: South America UAE Oil and Gas Downstream Industry Volume (Tonnes), by Country 2025 & 2033
- Figure 25: South America UAE Oil and Gas Downstream Industry Revenue Share (%), by Country 2025 & 2033
- Figure 26: South America UAE Oil and Gas Downstream Industry Volume Share (%), by Country 2025 & 2033
- Figure 27: Europe UAE Oil and Gas Downstream Industry Revenue (billion), by Refining 2025 & 2033
- Figure 28: Europe UAE Oil and Gas Downstream Industry Volume (Tonnes), by Refining 2025 & 2033
- Figure 29: Europe UAE Oil and Gas Downstream Industry Revenue Share (%), by Refining 2025 & 2033
- Figure 30: Europe UAE Oil and Gas Downstream Industry Volume Share (%), by Refining 2025 & 2033
- Figure 31: Europe UAE Oil and Gas Downstream Industry Revenue (billion), by Petrochemicals 2025 & 2033
- Figure 32: Europe UAE Oil and Gas Downstream Industry Volume (Tonnes), by Petrochemicals 2025 & 2033
- Figure 33: Europe UAE Oil and Gas Downstream Industry Revenue Share (%), by Petrochemicals 2025 & 2033
- Figure 34: Europe UAE Oil and Gas Downstream Industry Volume Share (%), by Petrochemicals 2025 & 2033
- Figure 35: Europe UAE Oil and Gas Downstream Industry Revenue (billion), by Country 2025 & 2033
- Figure 36: Europe UAE Oil and Gas Downstream Industry Volume (Tonnes), by Country 2025 & 2033
- Figure 37: Europe UAE Oil and Gas Downstream Industry Revenue Share (%), by Country 2025 & 2033
- Figure 38: Europe UAE Oil and Gas Downstream Industry Volume Share (%), by Country 2025 & 2033
- Figure 39: Middle East & Africa UAE Oil and Gas Downstream Industry Revenue (billion), by Refining 2025 & 2033
- Figure 40: Middle East & Africa UAE Oil and Gas Downstream Industry Volume (Tonnes), by Refining 2025 & 2033
- Figure 41: Middle East & Africa UAE Oil and Gas Downstream Industry Revenue Share (%), by Refining 2025 & 2033
- Figure 42: Middle East & Africa UAE Oil and Gas Downstream Industry Volume Share (%), by Refining 2025 & 2033
- Figure 43: Middle East & Africa UAE Oil and Gas Downstream Industry Revenue (billion), by Petrochemicals 2025 & 2033
- Figure 44: Middle East & Africa UAE Oil and Gas Downstream Industry Volume (Tonnes), by Petrochemicals 2025 & 2033
- Figure 45: Middle East & Africa UAE Oil and Gas Downstream Industry Revenue Share (%), by Petrochemicals 2025 & 2033
- Figure 46: Middle East & Africa UAE Oil and Gas Downstream Industry Volume Share (%), by Petrochemicals 2025 & 2033
- Figure 47: Middle East & Africa UAE Oil and Gas Downstream Industry Revenue (billion), by Country 2025 & 2033
- Figure 48: Middle East & Africa UAE Oil and Gas Downstream Industry Volume (Tonnes), by Country 2025 & 2033
- Figure 49: Middle East & Africa UAE Oil and Gas Downstream Industry Revenue Share (%), by Country 2025 & 2033
- Figure 50: Middle East & Africa UAE Oil and Gas Downstream Industry Volume Share (%), by Country 2025 & 2033
- Figure 51: Asia Pacific UAE Oil and Gas Downstream Industry Revenue (billion), by Refining 2025 & 2033
- Figure 52: Asia Pacific UAE Oil and Gas Downstream Industry Volume (Tonnes), by Refining 2025 & 2033
- Figure 53: Asia Pacific UAE Oil and Gas Downstream Industry Revenue Share (%), by Refining 2025 & 2033
- Figure 54: Asia Pacific UAE Oil and Gas Downstream Industry Volume Share (%), by Refining 2025 & 2033
- Figure 55: Asia Pacific UAE Oil and Gas Downstream Industry Revenue (billion), by Petrochemicals 2025 & 2033
- Figure 56: Asia Pacific UAE Oil and Gas Downstream Industry Volume (Tonnes), by Petrochemicals 2025 & 2033
- Figure 57: Asia Pacific UAE Oil and Gas Downstream Industry Revenue Share (%), by Petrochemicals 2025 & 2033
- Figure 58: Asia Pacific UAE Oil and Gas Downstream Industry Volume Share (%), by Petrochemicals 2025 & 2033
- Figure 59: Asia Pacific UAE Oil and Gas Downstream Industry Revenue (billion), by Country 2025 & 2033
- Figure 60: Asia Pacific UAE Oil and Gas Downstream Industry Volume (Tonnes), by Country 2025 & 2033
- Figure 61: Asia Pacific UAE Oil and Gas Downstream Industry Revenue Share (%), by Country 2025 & 2033
- Figure 62: Asia Pacific UAE Oil and Gas Downstream Industry Volume Share (%), by Country 2025 & 2033
List of Tables
- Table 1: Global UAE Oil and Gas Downstream Industry Revenue billion Forecast, by Refining 2020 & 2033
- Table 2: Global UAE Oil and Gas Downstream Industry Volume Tonnes Forecast, by Refining 2020 & 2033
- Table 3: Global UAE Oil and Gas Downstream Industry Revenue billion Forecast, by Petrochemicals 2020 & 2033
- Table 4: Global UAE Oil and Gas Downstream Industry Volume Tonnes Forecast, by Petrochemicals 2020 & 2033
- Table 5: Global UAE Oil and Gas Downstream Industry Revenue billion Forecast, by Region 2020 & 2033
- Table 6: Global UAE Oil and Gas Downstream Industry Volume Tonnes Forecast, by Region 2020 & 2033
- Table 7: Global UAE Oil and Gas Downstream Industry Revenue billion Forecast, by Refining 2020 & 2033
- Table 8: Global UAE Oil and Gas Downstream Industry Volume Tonnes Forecast, by Refining 2020 & 2033
- Table 9: Global UAE Oil and Gas Downstream Industry Revenue billion Forecast, by Petrochemicals 2020 & 2033
- Table 10: Global UAE Oil and Gas Downstream Industry Volume Tonnes Forecast, by Petrochemicals 2020 & 2033
- Table 11: Global UAE Oil and Gas Downstream Industry Revenue billion Forecast, by Country 2020 & 2033
- Table 12: Global UAE Oil and Gas Downstream Industry Volume Tonnes Forecast, by Country 2020 & 2033
- Table 13: United States UAE Oil and Gas Downstream Industry Revenue (billion) Forecast, by Application 2020 & 2033
- Table 14: United States UAE Oil and Gas Downstream Industry Volume (Tonnes) Forecast, by Application 2020 & 2033
- Table 15: Canada UAE Oil and Gas Downstream Industry Revenue (billion) Forecast, by Application 2020 & 2033
- Table 16: Canada UAE Oil and Gas Downstream Industry Volume (Tonnes) Forecast, by Application 2020 & 2033
- Table 17: Mexico UAE Oil and Gas Downstream Industry Revenue (billion) Forecast, by Application 2020 & 2033
- Table 18: Mexico UAE Oil and Gas Downstream Industry Volume (Tonnes) Forecast, by Application 2020 & 2033
- Table 19: Global UAE Oil and Gas Downstream Industry Revenue billion Forecast, by Refining 2020 & 2033
- Table 20: Global UAE Oil and Gas Downstream Industry Volume Tonnes Forecast, by Refining 2020 & 2033
- Table 21: Global UAE Oil and Gas Downstream Industry Revenue billion Forecast, by Petrochemicals 2020 & 2033
- Table 22: Global UAE Oil and Gas Downstream Industry Volume Tonnes Forecast, by Petrochemicals 2020 & 2033
- Table 23: Global UAE Oil and Gas Downstream Industry Revenue billion Forecast, by Country 2020 & 2033
- Table 24: Global UAE Oil and Gas Downstream Industry Volume Tonnes Forecast, by Country 2020 & 2033
- Table 25: Brazil UAE Oil and Gas Downstream Industry Revenue (billion) Forecast, by Application 2020 & 2033
- Table 26: Brazil UAE Oil and Gas Downstream Industry Volume (Tonnes) Forecast, by Application 2020 & 2033
- Table 27: Argentina UAE Oil and Gas Downstream Industry Revenue (billion) Forecast, by Application 2020 & 2033
- Table 28: Argentina UAE Oil and Gas Downstream Industry Volume (Tonnes) Forecast, by Application 2020 & 2033
- Table 29: Rest of South America UAE Oil and Gas Downstream Industry Revenue (billion) Forecast, by Application 2020 & 2033
- Table 30: Rest of South America UAE Oil and Gas Downstream Industry Volume (Tonnes) Forecast, by Application 2020 & 2033
- Table 31: Global UAE Oil and Gas Downstream Industry Revenue billion Forecast, by Refining 2020 & 2033
- Table 32: Global UAE Oil and Gas Downstream Industry Volume Tonnes Forecast, by Refining 2020 & 2033
- Table 33: Global UAE Oil and Gas Downstream Industry Revenue billion Forecast, by Petrochemicals 2020 & 2033
- Table 34: Global UAE Oil and Gas Downstream Industry Volume Tonnes Forecast, by Petrochemicals 2020 & 2033
- Table 35: Global UAE Oil and Gas Downstream Industry Revenue billion Forecast, by Country 2020 & 2033
- Table 36: Global UAE Oil and Gas Downstream Industry Volume Tonnes Forecast, by Country 2020 & 2033
- Table 37: United Kingdom UAE Oil and Gas Downstream Industry Revenue (billion) Forecast, by Application 2020 & 2033
- Table 38: United Kingdom UAE Oil and Gas Downstream Industry Volume (Tonnes) Forecast, by Application 2020 & 2033
- Table 39: Germany UAE Oil and Gas Downstream Industry Revenue (billion) Forecast, by Application 2020 & 2033
- Table 40: Germany UAE Oil and Gas Downstream Industry Volume (Tonnes) Forecast, by Application 2020 & 2033
- Table 41: France UAE Oil and Gas Downstream Industry Revenue (billion) Forecast, by Application 2020 & 2033
- Table 42: France UAE Oil and Gas Downstream Industry Volume (Tonnes) Forecast, by Application 2020 & 2033
- Table 43: Italy UAE Oil and Gas Downstream Industry Revenue (billion) Forecast, by Application 2020 & 2033
- Table 44: Italy UAE Oil and Gas Downstream Industry Volume (Tonnes) Forecast, by Application 2020 & 2033
- Table 45: Spain UAE Oil and Gas Downstream Industry Revenue (billion) Forecast, by Application 2020 & 2033
- Table 46: Spain UAE Oil and Gas Downstream Industry Volume (Tonnes) Forecast, by Application 2020 & 2033
- Table 47: Russia UAE Oil and Gas Downstream Industry Revenue (billion) Forecast, by Application 2020 & 2033
- Table 48: Russia UAE Oil and Gas Downstream Industry Volume (Tonnes) Forecast, by Application 2020 & 2033
- Table 49: Benelux UAE Oil and Gas Downstream Industry Revenue (billion) Forecast, by Application 2020 & 2033
- Table 50: Benelux UAE Oil and Gas Downstream Industry Volume (Tonnes) Forecast, by Application 2020 & 2033
- Table 51: Nordics UAE Oil and Gas Downstream Industry Revenue (billion) Forecast, by Application 2020 & 2033
- Table 52: Nordics UAE Oil and Gas Downstream Industry Volume (Tonnes) Forecast, by Application 2020 & 2033
- Table 53: Rest of Europe UAE Oil and Gas Downstream Industry Revenue (billion) Forecast, by Application 2020 & 2033
- Table 54: Rest of Europe UAE Oil and Gas Downstream Industry Volume (Tonnes) Forecast, by Application 2020 & 2033
- Table 55: Global UAE Oil and Gas Downstream Industry Revenue billion Forecast, by Refining 2020 & 2033
- Table 56: Global UAE Oil and Gas Downstream Industry Volume Tonnes Forecast, by Refining 2020 & 2033
- Table 57: Global UAE Oil and Gas Downstream Industry Revenue billion Forecast, by Petrochemicals 2020 & 2033
- Table 58: Global UAE Oil and Gas Downstream Industry Volume Tonnes Forecast, by Petrochemicals 2020 & 2033
- Table 59: Global UAE Oil and Gas Downstream Industry Revenue billion Forecast, by Country 2020 & 2033
- Table 60: Global UAE Oil and Gas Downstream Industry Volume Tonnes Forecast, by Country 2020 & 2033
- Table 61: Turkey UAE Oil and Gas Downstream Industry Revenue (billion) Forecast, by Application 2020 & 2033
- Table 62: Turkey UAE Oil and Gas Downstream Industry Volume (Tonnes) Forecast, by Application 2020 & 2033
- Table 63: Israel UAE Oil and Gas Downstream Industry Revenue (billion) Forecast, by Application 2020 & 2033
- Table 64: Israel UAE Oil and Gas Downstream Industry Volume (Tonnes) Forecast, by Application 2020 & 2033
- Table 65: GCC UAE Oil and Gas Downstream Industry Revenue (billion) Forecast, by Application 2020 & 2033
- Table 66: GCC UAE Oil and Gas Downstream Industry Volume (Tonnes) Forecast, by Application 2020 & 2033
- Table 67: North Africa UAE Oil and Gas Downstream Industry Revenue (billion) Forecast, by Application 2020 & 2033
- Table 68: North Africa UAE Oil and Gas Downstream Industry Volume (Tonnes) Forecast, by Application 2020 & 2033
- Table 69: South Africa UAE Oil and Gas Downstream Industry Revenue (billion) Forecast, by Application 2020 & 2033
- Table 70: South Africa UAE Oil and Gas Downstream Industry Volume (Tonnes) Forecast, by Application 2020 & 2033
- Table 71: Rest of Middle East & Africa UAE Oil and Gas Downstream Industry Revenue (billion) Forecast, by Application 2020 & 2033
- Table 72: Rest of Middle East & Africa UAE Oil and Gas Downstream Industry Volume (Tonnes) Forecast, by Application 2020 & 2033
- Table 73: Global UAE Oil and Gas Downstream Industry Revenue billion Forecast, by Refining 2020 & 2033
- Table 74: Global UAE Oil and Gas Downstream Industry Volume Tonnes Forecast, by Refining 2020 & 2033
- Table 75: Global UAE Oil and Gas Downstream Industry Revenue billion Forecast, by Petrochemicals 2020 & 2033
- Table 76: Global UAE Oil and Gas Downstream Industry Volume Tonnes Forecast, by Petrochemicals 2020 & 2033
- Table 77: Global UAE Oil and Gas Downstream Industry Revenue billion Forecast, by Country 2020 & 2033
- Table 78: Global UAE Oil and Gas Downstream Industry Volume Tonnes Forecast, by Country 2020 & 2033
- Table 79: China UAE Oil and Gas Downstream Industry Revenue (billion) Forecast, by Application 2020 & 2033
- Table 80: China UAE Oil and Gas Downstream Industry Volume (Tonnes) Forecast, by Application 2020 & 2033
- Table 81: India UAE Oil and Gas Downstream Industry Revenue (billion) Forecast, by Application 2020 & 2033
- Table 82: India UAE Oil and Gas Downstream Industry Volume (Tonnes) Forecast, by Application 2020 & 2033
- Table 83: Japan UAE Oil and Gas Downstream Industry Revenue (billion) Forecast, by Application 2020 & 2033
- Table 84: Japan UAE Oil and Gas Downstream Industry Volume (Tonnes) Forecast, by Application 2020 & 2033
- Table 85: South Korea UAE Oil and Gas Downstream Industry Revenue (billion) Forecast, by Application 2020 & 2033
- Table 86: South Korea UAE Oil and Gas Downstream Industry Volume (Tonnes) Forecast, by Application 2020 & 2033
- Table 87: ASEAN UAE Oil and Gas Downstream Industry Revenue (billion) Forecast, by Application 2020 & 2033
- Table 88: ASEAN UAE Oil and Gas Downstream Industry Volume (Tonnes) Forecast, by Application 2020 & 2033
- Table 89: Oceania UAE Oil and Gas Downstream Industry Revenue (billion) Forecast, by Application 2020 & 2033
- Table 90: Oceania UAE Oil and Gas Downstream Industry Volume (Tonnes) Forecast, by Application 2020 & 2033
- Table 91: Rest of Asia Pacific UAE Oil and Gas Downstream Industry Revenue (billion) Forecast, by Application 2020 & 2033
- Table 92: Rest of Asia Pacific UAE Oil and Gas Downstream Industry Volume (Tonnes) Forecast, by Application 2020 & 2033
Frequently Asked Questions
1. What is the projected Compound Annual Growth Rate (CAGR) of the UAE Oil and Gas Downstream Industry?
The projected CAGR is approximately 3.7%.
2. Which companies are prominent players in the UAE Oil and Gas Downstream Industry?
Key companies in the market include Abu Dhabi National Oil Co, Sunrise Petroleum FZC, Proman AG*List Not Exhaustive, Exxon Mobil Corporation, Emirates National Oil Co, TotalEnergies SA, Royal Dutch Shell PLC, Abu Dhabi Polymers Company Ltd.
3. What are the main segments of the UAE Oil and Gas Downstream Industry?
The market segments include Refining, Petrochemicals.
4. Can you provide details about the market size?
The market size is estimated to be USD 3.4 billion as of 2022.
5. What are some drivers contributing to market growth?
4.; Increasing Renewables Capacity in Thailand4.; Rising Modernization of Existing Transmission and Distribution Infrastructure.
6. What are the notable trends driving market growth?
Refining Sector to Witness Significant Growth.
7. Are there any restraints impacting market growth?
4.; Huge Capital Expenditure Required for Carrying out Modernization of Existing Facilities.
8. Can you provide examples of recent developments in the market?
In March 2022, Proman signed an agreement with Abu Dhabi National Oil Company ('ADNOC') to construct the UAE's first world-scale methanol production facility at the TA'ZIZ Industrial Chemicals Zone in Ruwais, Abu Dhabi. This agreement is under the terms of Abu Dhabi Chemicals Derivatives Company RSC Ltd. In collaboration with Proman, TA'ZIZ will construct a facility to convert natural gas into methanol with an anticipated annual capacity of up to 1.8 million ton.
9. What pricing options are available for accessing the report?
Pricing options include single-user, multi-user, and enterprise licenses priced at USD 3800, USD 4500, and USD 5800 respectively.
10. Is the market size provided in terms of value or volume?
The market size is provided in terms of value, measured in billion and volume, measured in Tonnes.
11. Are there any specific market keywords associated with the report?
Yes, the market keyword associated with the report is "UAE Oil and Gas Downstream Industry," which aids in identifying and referencing the specific market segment covered.
12. How do I determine which pricing option suits my needs best?
The pricing options vary based on user requirements and access needs. Individual users may opt for single-user licenses, while businesses requiring broader access may choose multi-user or enterprise licenses for cost-effective access to the report.
13. Are there any additional resources or data provided in the UAE Oil and Gas Downstream Industry report?
While the report offers comprehensive insights, it's advisable to review the specific contents or supplementary materials provided to ascertain if additional resources or data are available.
14. How can I stay updated on further developments or reports in the UAE Oil and Gas Downstream Industry?
To stay informed about further developments, trends, and reports in the UAE Oil and Gas Downstream Industry, consider subscribing to industry newsletters, following relevant companies and organizations, or regularly checking reputable industry news sources and publications.
Methodology
Step 1 - Identification of Relevant Samples Size from Population Database


Step 2 - Approaches for Defining Global Market Size (Value, Volume* & Price*)

Note*: In applicable scenarios
Step 3 - Data Sources
Primary Research
- Web Analytics
- Survey Reports
- Research Institute
- Latest Research Reports
- Opinion Leaders
Secondary Research
- Annual Reports
- White Paper
- Latest Press Release
- Industry Association
- Paid Database
- Investor Presentations

Step 4 - Data Triangulation
Involves using different sources of information in order to increase the validity of a study
These sources are likely to be stakeholders in a program - participants, other researchers, program staff, other community members, and so on.
Then we put all data in single framework & apply various statistical tools to find out the dynamic on the market.
During the analysis stage, feedback from the stakeholder groups would be compared to determine areas of agreement as well as areas of divergence