

Key Insights
The Asia-Pacific (APAC) nuclear power reactor decommissioning market is poised for substantial expansion, driven by an aging nuclear fleet and evolving regulatory landscapes mandating safe and efficient end-of-life management. The market, valued at $8.01 billion in the base year 2025, is projected to achieve a Compound Annual Growth Rate (CAGR) of 3.59% through 2033. Key growth catalysts include the increasing number of reactors reaching retirement age, particularly in established nuclear economies like Japan and South Korea, alongside intensified environmental regulations and public demand for responsible nuclear waste disposal. This surge necessitates significant investment in advanced decommissioning technologies and specialized services, opening avenues for companies in dismantling, waste management, and site remediation. While initial capital expenditure presents a challenge, the long-term environmental benefits and land restoration potential are compelling drivers for market growth. Segmentation by reactor type highlights strong demand for services related to Pressurized Water Reactors (PWRs) and Boiling Water Reactors (BWRs), which form the predominant reactor types in the region. Collaborative efforts between governmental bodies and private enterprises are also fostering technology transfer and knowledge exchange, further stimulating market development.
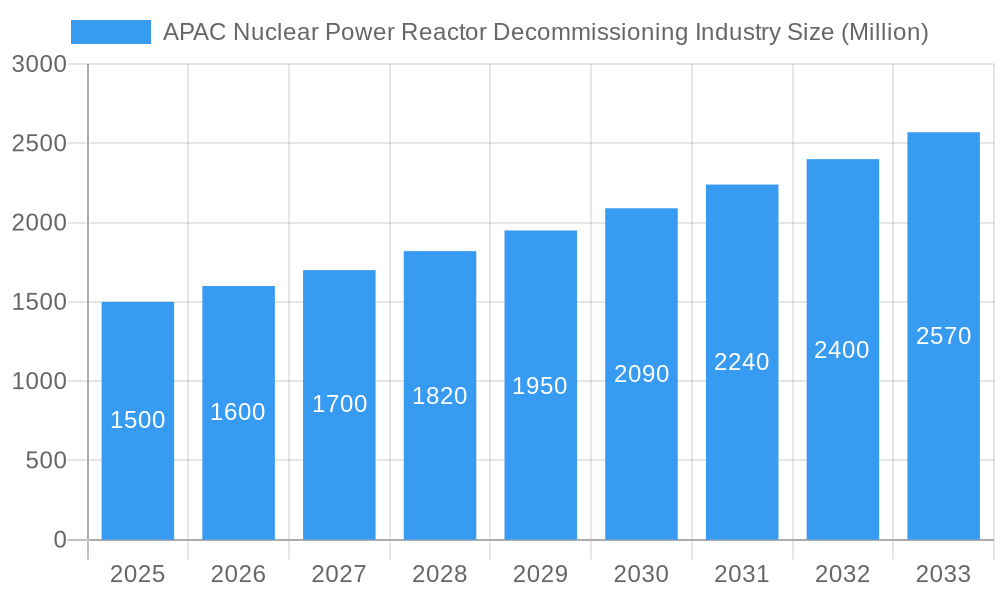
APAC Nuclear Power Reactor Decommissioning Industry Market Size (In Billion)
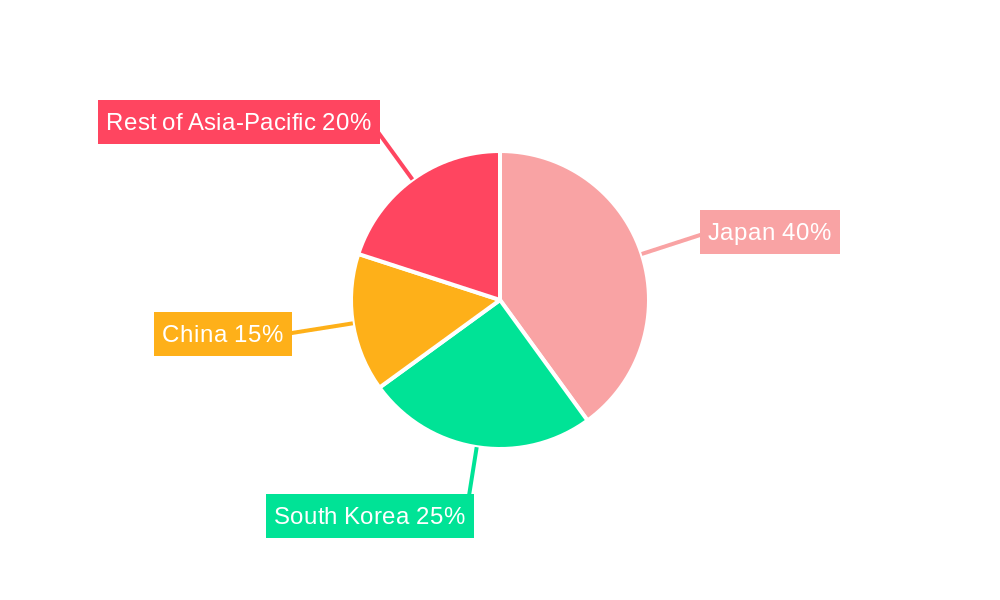
Regional dynamics within APAC are varied. Japan, a frontrunner in nuclear power, leads market contributions, followed by South Korea and China. Emerging nuclear programs in India and other Southeast Asian nations are expected to contribute to future market expansion as their existing reactor infrastructure ages. The market is segmented by reactor type, application (commercial, prototype, research), and capacity (MW), offering diverse opportunities for specialized service providers. The presence of both international and domestic companies, each bringing unique expertise to nuclear decommissioning, is enhancing the technological sophistication and operational efficiency of projects throughout the region. The inherent complexities of managing radioactive waste and ensuring stringent worker safety protocols underscore the demand for highly skilled professionals and cutting-edge technologies, thereby fueling continuous market advancement.
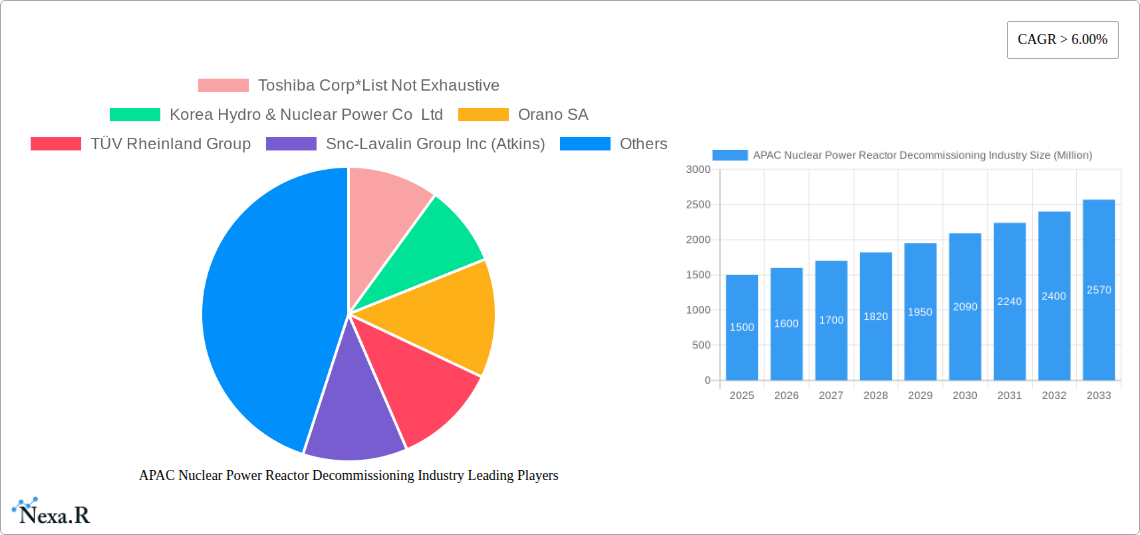
APAC Nuclear Power Reactor Decommissioning Industry Company Market Share
APAC Nuclear Power Reactor Decommissioning Industry: A Comprehensive Market Report (2019-2033)
This comprehensive report offers an in-depth analysis of the Asia-Pacific (APAC) nuclear power reactor decommissioning industry, providing crucial insights for industry professionals, investors, and policymakers. The study period spans from 2019 to 2033, with 2025 serving as both the base and estimated year. The forecast period covers 2025-2033, while the historical period encompasses 2019-2024. This report meticulously examines market dynamics, growth trends, dominant segments, and key players, offering a 360° view of this critical sector. The report leverages extensive primary and secondary research, incorporating data from various sources to provide accurate and reliable predictions.
APAC Nuclear Power Reactor Decommissioning Industry Market Dynamics & Structure
The APAC nuclear power reactor decommissioning market is characterized by a moderately concentrated structure, with key players like Toshiba Corp, Korea Hydro & Nuclear Power Co Ltd, Orano SA, TÜV Rheinland Group, Snc-Lavalin Group Inc (Atkins), The Japan Atomic Power Co, GE- Hitachi Nuclear Energy Ltd, and Tokyo Electric Power Company Holdings Inc. holding significant market share. However, the emergence of specialized decommissioning firms and international collaborations is gradually increasing competition. Technological innovation, particularly in robotics and remote handling technologies, is a key driver, alongside stringent regulatory frameworks aimed at ensuring safety and environmental protection. The high capital expenditure required for decommissioning projects and the complexities involved act as barriers to entry. M&A activity in this sector has been relatively limited, but strategic partnerships are becoming increasingly common, especially as companies seek expertise in specialized areas.
- Market Concentration: Moderately concentrated, with top players holding xx% market share (2025).
- Technological Innovation: Robotics, AI, and advanced materials are driving efficiency improvements.
- Regulatory Framework: Stringent safety and environmental regulations influence project timelines and costs.
- Competitive Landscape: Increasing competition from specialized decommissioning firms and international collaborations.
- M&A Activity: Low volume, with strategic partnerships becoming more prevalent. xx M&A deals recorded between 2019-2024.
APAC Nuclear Power Reactor Decommissioning Industry Growth Trends & Insights
The APAC nuclear power reactor decommissioning market is experiencing significant growth, driven by the aging nuclear power plant fleet across the region and the increasing need to address the long-term challenges of nuclear waste management. Japan, specifically, presents a substantial market opportunity due to its high density of older reactors and the ongoing Fukushima Daiichi decommissioning project. The market size is projected to reach xx Million by 2028, exhibiting a CAGR of xx% during the forecast period (2025-2033). This growth is further fueled by technological advancements improving decommissioning efficiency and reducing costs, alongside supportive government policies and regulations. However, fluctuating fuel prices and public perception remain significant factors impacting market penetration and growth. Consumer behavior, focused on environmental responsibility and public safety, is increasingly influencing decision-making in this area.
Dominant Regions, Countries, or Segments in APAP Nuclear Power Reactor Decommissioning Industry
Japan dominates the APAP nuclear power reactor decommissioning market, accounting for xx% of the market share in 2025. This dominance stems from the large number of aging reactors requiring decommissioning, coupled with the extensive cleanup efforts at the Fukushima Daiichi nuclear power plant, representing a multi-billion dollar undertaking. The considerable government investment in decommissioning projects and the highly developed infrastructure further contribute to Japan's leading position. China is experiencing rapid growth in this market driven by its expanding nuclear power capacity, and while currently smaller than Japan’s market, it is anticipated to become the second most important segment in the next decade. The Pressurized Water Reactor (PWR) segment holds the largest market share due to its prevalence in the region.
- Key Drivers in Japan: Fukushima Daiichi decommissioning, government investment, and advanced infrastructure.
- Key Drivers in China: Expanding nuclear power capacity and increasing government focus on nuclear waste management.
- Dominant Reactor Type: Pressurized Water Reactor (PWR).
- Dominant Application: Commercial Power Reactor.
APAC Nuclear Power Reactor Decommissioning Industry Product Landscape
The product landscape includes various technologies and services, ranging from remote handling systems and robotics for dismantling reactors to waste management solutions and site remediation services. Recent innovations focus on improving efficiency, reducing radiation exposure to workers, and minimizing environmental impact. Unique selling propositions include advanced robotics with AI-powered capabilities, specialized tools for handling radioactive materials, and integrated waste management solutions. Technological advancements continue to drive innovation, including the development of more efficient and safer decommissioning methods.
Key Drivers, Barriers & Challenges in APAC Nuclear Power Reactor Decommissioning Industry
Key Drivers:
- Aging nuclear power plant fleets requiring decommissioning.
- Stringent government regulations and safety standards.
- Technological advancements making decommissioning more efficient and cost-effective.
- Growing public awareness of nuclear waste management.
Key Challenges and Restraints:
- High capital expenditure and long project timelines.
- Complex regulatory landscape and licensing processes.
- Potential supply chain disruptions related to specialized equipment and materials.
- Public perception and acceptance of decommissioning projects. (estimated xx% of the population expressed concerns in 2024).
Emerging Opportunities in APAC Nuclear Power Reactor Decommissioning Industry
Emerging opportunities lie in the development and deployment of advanced technologies such as AI-powered robotics for dismantling, improved waste treatment and storage solutions, and specialized decommissioning services for smaller reactors. Untapped markets exist in the rest of Asia-Pacific region, as many countries embark on their nuclear power programs and begin to plan for decommissioning. Growing demand for skilled labor and specialized services create further opportunities for training and consultancy.
Growth Accelerators in the APAC Nuclear Power Reactor Decommissioning Industry
Technological breakthroughs in robotics, AI, and nuclear waste management significantly contribute to long-term growth. Strategic partnerships between international firms and local companies facilitate technology transfer and knowledge sharing. Government policies and funding initiatives focused on sustainable nuclear decommissioning further accelerate market expansion. The increasing focus on environmental sustainability and reducing the long-term impact of nuclear waste also drives adoption of innovative technologies.
Key Players Shaping the APAC Nuclear Power Reactor Decommissioning Industry Market
- Toshiba Corp
- Korea Hydro & Nuclear Power Co Ltd
- Orano SA
- TÜV Rheinland Group
- Snc-Lavalin Group Inc (Atkins)
- The Japan Atomic Power Co
- GE- Hitachi Nuclear Energy Ltd
- Tokyo Electric Power Company Holdings Inc
Notable Milestones in APAC Nuclear Power Reactor Decommissioning Industry Sector
- May 2022: Jacobs selected by Tokyo Electric Power Company (Tepco) for Fukushima Daiichi decommissioning support. This significantly impacts the market by introducing advanced engineering expertise and accelerating the project's progress.
- January 2022: Japanese government announces wastewater discharge plan from Fukushima, demonstrating a commitment to decommissioning and highlighting the scale of the undertaking. This milestone underscores the substantial market potential for decommissioning services and technologies related to the Fukushima project.
In-Depth APAC Nuclear Power Reactor Decommissioning Industry Market Outlook
The APAC nuclear power reactor decommissioning market exhibits substantial long-term growth potential. Continued investment in innovative technologies, coupled with a growing number of aging reactors and stringent regulatory requirements, will drive sustained demand for decommissioning services. Strategic partnerships, technological advancements, and government support present significant opportunities for market players. The market is poised for substantial growth, driven by both the significant scale of the existing projects and the anticipated increase in future requirements for decommissioning.
APAC Nuclear Power Reactor Decommissioning Industry Segmentation
-
1. Reactor Type
- 1.1. Pressurized Water Reactor
- 1.2. Pressurized Heavy Water Reactor
- 1.3. Boiling Water Reactor
- 1.4. High-temperature Gas-cooled Reactor
- 1.5. Liquid Metal Fast Breeder Reactor
- 1.6. Other Reactor Types
-
2. Application
- 2.1. Commercial Power Reactor
- 2.2. Prototype Power Reactor
- 2.3. Research Reactor
-
3. Capacity
- 3.1. Below 100 MW
- 3.2. 100-1000 MW
- 3.3. Above 1000 MW
APAC Nuclear Power Reactor Decommissioning Industry Segmentation By Geography
-
1. North America
- 1.1. United States
- 1.2. Canada
- 1.3. Mexico
-
2. South America
- 2.1. Brazil
- 2.2. Argentina
- 2.3. Rest of South America
-
3. Europe
- 3.1. United Kingdom
- 3.2. Germany
- 3.3. France
- 3.4. Italy
- 3.5. Spain
- 3.6. Russia
- 3.7. Benelux
- 3.8. Nordics
- 3.9. Rest of Europe
-
4. Middle East & Africa
- 4.1. Turkey
- 4.2. Israel
- 4.3. GCC
- 4.4. North Africa
- 4.5. South Africa
- 4.6. Rest of Middle East & Africa
-
5. Asia Pacific
- 5.1. China
- 5.2. India
- 5.3. Japan
- 5.4. South Korea
- 5.5. ASEAN
- 5.6. Oceania
- 5.7. Rest of Asia Pacific
APAC Nuclear Power Reactor Decommissioning Industry Regional Market Share
Geographic Coverage of APAC Nuclear Power Reactor Decommissioning Industry
APAC Nuclear Power Reactor Decommissioning Industry REPORT HIGHLIGHTS
| Aspects | Details |
|---|---|
| Study Period | 2020-2034 |
| Base Year | 2025 |
| Estimated Year | 2026 |
| Forecast Period | 2026-2034 |
| Historical Period | 2020-2025 |
| Growth Rate | CAGR of 3.59% from 2020-2034 |
| Segmentation |
|
Table of Contents
- 1. Introduction
- 1.1. Research Scope
- 1.2. Market Segmentation
- 1.3. Research Objective
- 1.4. Definitions and Assumptions
- 2. Executive Summary
- 2.1. Market Snapshot
- 3. Market Dynamics
- 3.1. Market Drivers
- 3.2. Market Restrains
- 3.3. Market Trends
- 3.4. Market Opportunities
- 4. Market Factor Analysis
- 4.1. Porters Five Forces
- 4.1.1. Bargaining Power of Suppliers
- 4.1.2. Bargaining Power of Buyers
- 4.1.3. Threat of New Entrants
- 4.1.4. Threat of Substitutes
- 4.1.5. Competitive Rivalry
- 4.2. PESTEL analysis
- 4.3. BCG Analysis
- 4.3.1. Stars (High Growth, High Market Share)
- 4.3.2. Cash Cows (Low Growth, High Market Share)
- 4.3.3. Question Mark (High Growth, Low Market Share)
- 4.3.4. Dogs (Low Growth, Low Market Share)
- 4.4. Ansoff Matrix Analysis
- 4.5. Supply Chain Analysis
- 4.6. Regulatory Landscape
- 4.7. Current Market Potential and Opportunity Assessment (TAM–SAM–SOM Framework)
- 4.8. NRP Analyst Note
- 4.1. Porters Five Forces
- 5. Market Analysis, Insights and Forecast 2021-2033
- 5.1. Market Analysis, Insights and Forecast - by Reactor Type
- 5.1.1. Pressurized Water Reactor
- 5.1.2. Pressurized Heavy Water Reactor
- 5.1.3. Boiling Water Reactor
- 5.1.4. High-temperature Gas-cooled Reactor
- 5.1.5. Liquid Metal Fast Breeder Reactor
- 5.1.6. Other Reactor Types
- 5.2. Market Analysis, Insights and Forecast - by Application
- 5.2.1. Commercial Power Reactor
- 5.2.2. Prototype Power Reactor
- 5.2.3. Research Reactor
- 5.3. Market Analysis, Insights and Forecast - by Capacity
- 5.3.1. Below 100 MW
- 5.3.2. 100-1000 MW
- 5.3.3. Above 1000 MW
- 5.4. Market Analysis, Insights and Forecast - by Region
- 5.4.1. North America
- 5.4.2. South America
- 5.4.3. Europe
- 5.4.4. Middle East & Africa
- 5.4.5. Asia Pacific
- 5.1. Market Analysis, Insights and Forecast - by Reactor Type
- 6. Global APAC Nuclear Power Reactor Decommissioning Industry Analysis, Insights and Forecast, 2021-2033
- 6.1. Market Analysis, Insights and Forecast - by Reactor Type
- 6.1.1. Pressurized Water Reactor
- 6.1.2. Pressurized Heavy Water Reactor
- 6.1.3. Boiling Water Reactor
- 6.1.4. High-temperature Gas-cooled Reactor
- 6.1.5. Liquid Metal Fast Breeder Reactor
- 6.1.6. Other Reactor Types
- 6.2. Market Analysis, Insights and Forecast - by Application
- 6.2.1. Commercial Power Reactor
- 6.2.2. Prototype Power Reactor
- 6.2.3. Research Reactor
- 6.3. Market Analysis, Insights and Forecast - by Capacity
- 6.3.1. Below 100 MW
- 6.3.2. 100-1000 MW
- 6.3.3. Above 1000 MW
- 6.1. Market Analysis, Insights and Forecast - by Reactor Type
- 7. North America APAC Nuclear Power Reactor Decommissioning Industry Analysis, Insights and Forecast, 2020-2032
- 7.1. Market Analysis, Insights and Forecast - by Reactor Type
- 7.1.1. Pressurized Water Reactor
- 7.1.2. Pressurized Heavy Water Reactor
- 7.1.3. Boiling Water Reactor
- 7.1.4. High-temperature Gas-cooled Reactor
- 7.1.5. Liquid Metal Fast Breeder Reactor
- 7.1.6. Other Reactor Types
- 7.2. Market Analysis, Insights and Forecast - by Application
- 7.2.1. Commercial Power Reactor
- 7.2.2. Prototype Power Reactor
- 7.2.3. Research Reactor
- 7.3. Market Analysis, Insights and Forecast - by Capacity
- 7.3.1. Below 100 MW
- 7.3.2. 100-1000 MW
- 7.3.3. Above 1000 MW
- 7.1. Market Analysis, Insights and Forecast - by Reactor Type
- 8. South America APAC Nuclear Power Reactor Decommissioning Industry Analysis, Insights and Forecast, 2020-2032
- 8.1. Market Analysis, Insights and Forecast - by Reactor Type
- 8.1.1. Pressurized Water Reactor
- 8.1.2. Pressurized Heavy Water Reactor
- 8.1.3. Boiling Water Reactor
- 8.1.4. High-temperature Gas-cooled Reactor
- 8.1.5. Liquid Metal Fast Breeder Reactor
- 8.1.6. Other Reactor Types
- 8.2. Market Analysis, Insights and Forecast - by Application
- 8.2.1. Commercial Power Reactor
- 8.2.2. Prototype Power Reactor
- 8.2.3. Research Reactor
- 8.3. Market Analysis, Insights and Forecast - by Capacity
- 8.3.1. Below 100 MW
- 8.3.2. 100-1000 MW
- 8.3.3. Above 1000 MW
- 8.1. Market Analysis, Insights and Forecast - by Reactor Type
- 9. Europe APAC Nuclear Power Reactor Decommissioning Industry Analysis, Insights and Forecast, 2020-2032
- 9.1. Market Analysis, Insights and Forecast - by Reactor Type
- 9.1.1. Pressurized Water Reactor
- 9.1.2. Pressurized Heavy Water Reactor
- 9.1.3. Boiling Water Reactor
- 9.1.4. High-temperature Gas-cooled Reactor
- 9.1.5. Liquid Metal Fast Breeder Reactor
- 9.1.6. Other Reactor Types
- 9.2. Market Analysis, Insights and Forecast - by Application
- 9.2.1. Commercial Power Reactor
- 9.2.2. Prototype Power Reactor
- 9.2.3. Research Reactor
- 9.3. Market Analysis, Insights and Forecast - by Capacity
- 9.3.1. Below 100 MW
- 9.3.2. 100-1000 MW
- 9.3.3. Above 1000 MW
- 9.1. Market Analysis, Insights and Forecast - by Reactor Type
- 10. Middle East & Africa APAC Nuclear Power Reactor Decommissioning Industry Analysis, Insights and Forecast, 2020-2032
- 10.1. Market Analysis, Insights and Forecast - by Reactor Type
- 10.1.1. Pressurized Water Reactor
- 10.1.2. Pressurized Heavy Water Reactor
- 10.1.3. Boiling Water Reactor
- 10.1.4. High-temperature Gas-cooled Reactor
- 10.1.5. Liquid Metal Fast Breeder Reactor
- 10.1.6. Other Reactor Types
- 10.2. Market Analysis, Insights and Forecast - by Application
- 10.2.1. Commercial Power Reactor
- 10.2.2. Prototype Power Reactor
- 10.2.3. Research Reactor
- 10.3. Market Analysis, Insights and Forecast - by Capacity
- 10.3.1. Below 100 MW
- 10.3.2. 100-1000 MW
- 10.3.3. Above 1000 MW
- 10.1. Market Analysis, Insights and Forecast - by Reactor Type
- 11. Asia Pacific APAC Nuclear Power Reactor Decommissioning Industry Analysis, Insights and Forecast, 2020-2032
- 11.1. Market Analysis, Insights and Forecast - by Reactor Type
- 11.1.1. Pressurized Water Reactor
- 11.1.2. Pressurized Heavy Water Reactor
- 11.1.3. Boiling Water Reactor
- 11.1.4. High-temperature Gas-cooled Reactor
- 11.1.5. Liquid Metal Fast Breeder Reactor
- 11.1.6. Other Reactor Types
- 11.2. Market Analysis, Insights and Forecast - by Application
- 11.2.1. Commercial Power Reactor
- 11.2.2. Prototype Power Reactor
- 11.2.3. Research Reactor
- 11.3. Market Analysis, Insights and Forecast - by Capacity
- 11.3.1. Below 100 MW
- 11.3.2. 100-1000 MW
- 11.3.3. Above 1000 MW
- 11.1. Market Analysis, Insights and Forecast - by Reactor Type
- 12. Competitive Analysis
- 12.1. Company Profiles
- 12.1.1 Toshiba Corp*List Not Exhaustive
- 12.1.1.1. Company Overview
- 12.1.1.2. Products
- 12.1.1.3. Company Financials
- 12.1.1.4. SWOT Analysis
- 12.1.2 Korea Hydro & Nuclear Power Co Ltd
- 12.1.2.1. Company Overview
- 12.1.2.2. Products
- 12.1.2.3. Company Financials
- 12.1.2.4. SWOT Analysis
- 12.1.3 Orano SA
- 12.1.3.1. Company Overview
- 12.1.3.2. Products
- 12.1.3.3. Company Financials
- 12.1.3.4. SWOT Analysis
- 12.1.4 TÜV Rheinland Group
- 12.1.4.1. Company Overview
- 12.1.4.2. Products
- 12.1.4.3. Company Financials
- 12.1.4.4. SWOT Analysis
- 12.1.5 Snc-Lavalin Group Inc (Atkins)
- 12.1.5.1. Company Overview
- 12.1.5.2. Products
- 12.1.5.3. Company Financials
- 12.1.5.4. SWOT Analysis
- 12.1.6 The Japan Atomic Power Co
- 12.1.6.1. Company Overview
- 12.1.6.2. Products
- 12.1.6.3. Company Financials
- 12.1.6.4. SWOT Analysis
- 12.1.7 GE- Hitachi Nuclear Energy Ltd
- 12.1.7.1. Company Overview
- 12.1.7.2. Products
- 12.1.7.3. Company Financials
- 12.1.7.4. SWOT Analysis
- 12.1.8 Tokyo Electric Power Company Holdings Inc
- 12.1.8.1. Company Overview
- 12.1.8.2. Products
- 12.1.8.3. Company Financials
- 12.1.8.4. SWOT Analysis
- 12.1.1 Toshiba Corp*List Not Exhaustive
- 12.2. Market Entropy
- 12.2.1 Company's Key Areas Served
- 12.2.2 Recent Developments
- 12.3. Company Market Share Analysis 2025
- 12.3.1 Top 5 Companies Market Share Analysis
- 12.3.2 Top 3 Companies Market Share Analysis
- 12.4. List of Potential Customers
- 13. Research Methodology
List of Figures
- Figure 1: Global APAC Nuclear Power Reactor Decommissioning Industry Revenue Breakdown (billion, %) by Region 2025 & 2033
- Figure 2: North America APAC Nuclear Power Reactor Decommissioning Industry Revenue (billion), by Reactor Type 2025 & 2033
- Figure 3: North America APAC Nuclear Power Reactor Decommissioning Industry Revenue Share (%), by Reactor Type 2025 & 2033
- Figure 4: North America APAC Nuclear Power Reactor Decommissioning Industry Revenue (billion), by Application 2025 & 2033
- Figure 5: North America APAC Nuclear Power Reactor Decommissioning Industry Revenue Share (%), by Application 2025 & 2033
- Figure 6: North America APAC Nuclear Power Reactor Decommissioning Industry Revenue (billion), by Capacity 2025 & 2033
- Figure 7: North America APAC Nuclear Power Reactor Decommissioning Industry Revenue Share (%), by Capacity 2025 & 2033
- Figure 8: North America APAC Nuclear Power Reactor Decommissioning Industry Revenue (billion), by Country 2025 & 2033
- Figure 9: North America APAC Nuclear Power Reactor Decommissioning Industry Revenue Share (%), by Country 2025 & 2033
- Figure 10: South America APAC Nuclear Power Reactor Decommissioning Industry Revenue (billion), by Reactor Type 2025 & 2033
- Figure 11: South America APAC Nuclear Power Reactor Decommissioning Industry Revenue Share (%), by Reactor Type 2025 & 2033
- Figure 12: South America APAC Nuclear Power Reactor Decommissioning Industry Revenue (billion), by Application 2025 & 2033
- Figure 13: South America APAC Nuclear Power Reactor Decommissioning Industry Revenue Share (%), by Application 2025 & 2033
- Figure 14: South America APAC Nuclear Power Reactor Decommissioning Industry Revenue (billion), by Capacity 2025 & 2033
- Figure 15: South America APAC Nuclear Power Reactor Decommissioning Industry Revenue Share (%), by Capacity 2025 & 2033
- Figure 16: South America APAC Nuclear Power Reactor Decommissioning Industry Revenue (billion), by Country 2025 & 2033
- Figure 17: South America APAC Nuclear Power Reactor Decommissioning Industry Revenue Share (%), by Country 2025 & 2033
- Figure 18: Europe APAC Nuclear Power Reactor Decommissioning Industry Revenue (billion), by Reactor Type 2025 & 2033
- Figure 19: Europe APAC Nuclear Power Reactor Decommissioning Industry Revenue Share (%), by Reactor Type 2025 & 2033
- Figure 20: Europe APAC Nuclear Power Reactor Decommissioning Industry Revenue (billion), by Application 2025 & 2033
- Figure 21: Europe APAC Nuclear Power Reactor Decommissioning Industry Revenue Share (%), by Application 2025 & 2033
- Figure 22: Europe APAC Nuclear Power Reactor Decommissioning Industry Revenue (billion), by Capacity 2025 & 2033
- Figure 23: Europe APAC Nuclear Power Reactor Decommissioning Industry Revenue Share (%), by Capacity 2025 & 2033
- Figure 24: Europe APAC Nuclear Power Reactor Decommissioning Industry Revenue (billion), by Country 2025 & 2033
- Figure 25: Europe APAC Nuclear Power Reactor Decommissioning Industry Revenue Share (%), by Country 2025 & 2033
- Figure 26: Middle East & Africa APAC Nuclear Power Reactor Decommissioning Industry Revenue (billion), by Reactor Type 2025 & 2033
- Figure 27: Middle East & Africa APAC Nuclear Power Reactor Decommissioning Industry Revenue Share (%), by Reactor Type 2025 & 2033
- Figure 28: Middle East & Africa APAC Nuclear Power Reactor Decommissioning Industry Revenue (billion), by Application 2025 & 2033
- Figure 29: Middle East & Africa APAC Nuclear Power Reactor Decommissioning Industry Revenue Share (%), by Application 2025 & 2033
- Figure 30: Middle East & Africa APAC Nuclear Power Reactor Decommissioning Industry Revenue (billion), by Capacity 2025 & 2033
- Figure 31: Middle East & Africa APAC Nuclear Power Reactor Decommissioning Industry Revenue Share (%), by Capacity 2025 & 2033
- Figure 32: Middle East & Africa APAC Nuclear Power Reactor Decommissioning Industry Revenue (billion), by Country 2025 & 2033
- Figure 33: Middle East & Africa APAC Nuclear Power Reactor Decommissioning Industry Revenue Share (%), by Country 2025 & 2033
- Figure 34: Asia Pacific APAC Nuclear Power Reactor Decommissioning Industry Revenue (billion), by Reactor Type 2025 & 2033
- Figure 35: Asia Pacific APAC Nuclear Power Reactor Decommissioning Industry Revenue Share (%), by Reactor Type 2025 & 2033
- Figure 36: Asia Pacific APAC Nuclear Power Reactor Decommissioning Industry Revenue (billion), by Application 2025 & 2033
- Figure 37: Asia Pacific APAC Nuclear Power Reactor Decommissioning Industry Revenue Share (%), by Application 2025 & 2033
- Figure 38: Asia Pacific APAC Nuclear Power Reactor Decommissioning Industry Revenue (billion), by Capacity 2025 & 2033
- Figure 39: Asia Pacific APAC Nuclear Power Reactor Decommissioning Industry Revenue Share (%), by Capacity 2025 & 2033
- Figure 40: Asia Pacific APAC Nuclear Power Reactor Decommissioning Industry Revenue (billion), by Country 2025 & 2033
- Figure 41: Asia Pacific APAC Nuclear Power Reactor Decommissioning Industry Revenue Share (%), by Country 2025 & 2033
List of Tables
- Table 1: Global APAC Nuclear Power Reactor Decommissioning Industry Revenue billion Forecast, by Reactor Type 2020 & 2033
- Table 2: Global APAC Nuclear Power Reactor Decommissioning Industry Revenue billion Forecast, by Application 2020 & 2033
- Table 3: Global APAC Nuclear Power Reactor Decommissioning Industry Revenue billion Forecast, by Capacity 2020 & 2033
- Table 4: Global APAC Nuclear Power Reactor Decommissioning Industry Revenue billion Forecast, by Region 2020 & 2033
- Table 5: Global APAC Nuclear Power Reactor Decommissioning Industry Revenue billion Forecast, by Reactor Type 2020 & 2033
- Table 6: Global APAC Nuclear Power Reactor Decommissioning Industry Revenue billion Forecast, by Application 2020 & 2033
- Table 7: Global APAC Nuclear Power Reactor Decommissioning Industry Revenue billion Forecast, by Capacity 2020 & 2033
- Table 8: Global APAC Nuclear Power Reactor Decommissioning Industry Revenue billion Forecast, by Country 2020 & 2033
- Table 9: United States APAC Nuclear Power Reactor Decommissioning Industry Revenue (billion) Forecast, by Application 2020 & 2033
- Table 10: Canada APAC Nuclear Power Reactor Decommissioning Industry Revenue (billion) Forecast, by Application 2020 & 2033
- Table 11: Mexico APAC Nuclear Power Reactor Decommissioning Industry Revenue (billion) Forecast, by Application 2020 & 2033
- Table 12: Global APAC Nuclear Power Reactor Decommissioning Industry Revenue billion Forecast, by Reactor Type 2020 & 2033
- Table 13: Global APAC Nuclear Power Reactor Decommissioning Industry Revenue billion Forecast, by Application 2020 & 2033
- Table 14: Global APAC Nuclear Power Reactor Decommissioning Industry Revenue billion Forecast, by Capacity 2020 & 2033
- Table 15: Global APAC Nuclear Power Reactor Decommissioning Industry Revenue billion Forecast, by Country 2020 & 2033
- Table 16: Brazil APAC Nuclear Power Reactor Decommissioning Industry Revenue (billion) Forecast, by Application 2020 & 2033
- Table 17: Argentina APAC Nuclear Power Reactor Decommissioning Industry Revenue (billion) Forecast, by Application 2020 & 2033
- Table 18: Rest of South America APAC Nuclear Power Reactor Decommissioning Industry Revenue (billion) Forecast, by Application 2020 & 2033
- Table 19: Global APAC Nuclear Power Reactor Decommissioning Industry Revenue billion Forecast, by Reactor Type 2020 & 2033
- Table 20: Global APAC Nuclear Power Reactor Decommissioning Industry Revenue billion Forecast, by Application 2020 & 2033
- Table 21: Global APAC Nuclear Power Reactor Decommissioning Industry Revenue billion Forecast, by Capacity 2020 & 2033
- Table 22: Global APAC Nuclear Power Reactor Decommissioning Industry Revenue billion Forecast, by Country 2020 & 2033
- Table 23: United Kingdom APAC Nuclear Power Reactor Decommissioning Industry Revenue (billion) Forecast, by Application 2020 & 2033
- Table 24: Germany APAC Nuclear Power Reactor Decommissioning Industry Revenue (billion) Forecast, by Application 2020 & 2033
- Table 25: France APAC Nuclear Power Reactor Decommissioning Industry Revenue (billion) Forecast, by Application 2020 & 2033
- Table 26: Italy APAC Nuclear Power Reactor Decommissioning Industry Revenue (billion) Forecast, by Application 2020 & 2033
- Table 27: Spain APAC Nuclear Power Reactor Decommissioning Industry Revenue (billion) Forecast, by Application 2020 & 2033
- Table 28: Russia APAC Nuclear Power Reactor Decommissioning Industry Revenue (billion) Forecast, by Application 2020 & 2033
- Table 29: Benelux APAC Nuclear Power Reactor Decommissioning Industry Revenue (billion) Forecast, by Application 2020 & 2033
- Table 30: Nordics APAC Nuclear Power Reactor Decommissioning Industry Revenue (billion) Forecast, by Application 2020 & 2033
- Table 31: Rest of Europe APAC Nuclear Power Reactor Decommissioning Industry Revenue (billion) Forecast, by Application 2020 & 2033
- Table 32: Global APAC Nuclear Power Reactor Decommissioning Industry Revenue billion Forecast, by Reactor Type 2020 & 2033
- Table 33: Global APAC Nuclear Power Reactor Decommissioning Industry Revenue billion Forecast, by Application 2020 & 2033
- Table 34: Global APAC Nuclear Power Reactor Decommissioning Industry Revenue billion Forecast, by Capacity 2020 & 2033
- Table 35: Global APAC Nuclear Power Reactor Decommissioning Industry Revenue billion Forecast, by Country 2020 & 2033
- Table 36: Turkey APAC Nuclear Power Reactor Decommissioning Industry Revenue (billion) Forecast, by Application 2020 & 2033
- Table 37: Israel APAC Nuclear Power Reactor Decommissioning Industry Revenue (billion) Forecast, by Application 2020 & 2033
- Table 38: GCC APAC Nuclear Power Reactor Decommissioning Industry Revenue (billion) Forecast, by Application 2020 & 2033
- Table 39: North Africa APAC Nuclear Power Reactor Decommissioning Industry Revenue (billion) Forecast, by Application 2020 & 2033
- Table 40: South Africa APAC Nuclear Power Reactor Decommissioning Industry Revenue (billion) Forecast, by Application 2020 & 2033
- Table 41: Rest of Middle East & Africa APAC Nuclear Power Reactor Decommissioning Industry Revenue (billion) Forecast, by Application 2020 & 2033
- Table 42: Global APAC Nuclear Power Reactor Decommissioning Industry Revenue billion Forecast, by Reactor Type 2020 & 2033
- Table 43: Global APAC Nuclear Power Reactor Decommissioning Industry Revenue billion Forecast, by Application 2020 & 2033
- Table 44: Global APAC Nuclear Power Reactor Decommissioning Industry Revenue billion Forecast, by Capacity 2020 & 2033
- Table 45: Global APAC Nuclear Power Reactor Decommissioning Industry Revenue billion Forecast, by Country 2020 & 2033
- Table 46: China APAC Nuclear Power Reactor Decommissioning Industry Revenue (billion) Forecast, by Application 2020 & 2033
- Table 47: India APAC Nuclear Power Reactor Decommissioning Industry Revenue (billion) Forecast, by Application 2020 & 2033
- Table 48: Japan APAC Nuclear Power Reactor Decommissioning Industry Revenue (billion) Forecast, by Application 2020 & 2033
- Table 49: South Korea APAC Nuclear Power Reactor Decommissioning Industry Revenue (billion) Forecast, by Application 2020 & 2033
- Table 50: ASEAN APAC Nuclear Power Reactor Decommissioning Industry Revenue (billion) Forecast, by Application 2020 & 2033
- Table 51: Oceania APAC Nuclear Power Reactor Decommissioning Industry Revenue (billion) Forecast, by Application 2020 & 2033
- Table 52: Rest of Asia Pacific APAC Nuclear Power Reactor Decommissioning Industry Revenue (billion) Forecast, by Application 2020 & 2033
Frequently Asked Questions
1. What is the projected Compound Annual Growth Rate (CAGR) of the APAC Nuclear Power Reactor Decommissioning Industry?
The projected CAGR is approximately 3.59%.
2. Which companies are prominent players in the APAC Nuclear Power Reactor Decommissioning Industry?
Key companies in the market include Toshiba Corp*List Not Exhaustive, Korea Hydro & Nuclear Power Co Ltd, Orano SA, TÜV Rheinland Group, Snc-Lavalin Group Inc (Atkins), The Japan Atomic Power Co, GE- Hitachi Nuclear Energy Ltd, Tokyo Electric Power Company Holdings Inc.
3. What are the main segments of the APAC Nuclear Power Reactor Decommissioning Industry?
The market segments include Reactor Type, Application, Capacity.
4. Can you provide details about the market size?
The market size is estimated to be USD 8.01 billion as of 2022.
5. What are some drivers contributing to market growth?
Rising Demand for Reliable Electricity; Increasing Government Support for Hydropower Generation.
6. What are the notable trends driving market growth?
Commercial Power Reactor Expected to Dominate the Market.
7. Are there any restraints impacting market growth?
Negative Environmental Consequences of Hydropower Projects.
8. Can you provide examples of recent developments in the market?
May 2022: USA-based engineering group Jacobs has been selected by Tokyo Electric Power Company (Tepco) to support decommissioning efforts at its damaged Fukushima Daiichi nuclear power plant in Japan.
9. What pricing options are available for accessing the report?
Pricing options include single-user, multi-user, and enterprise licenses priced at USD 4750, USD 5250, and USD 8750 respectively.
10. Is the market size provided in terms of value or volume?
The market size is provided in terms of value, measured in billion.
11. Are there any specific market keywords associated with the report?
Yes, the market keyword associated with the report is "APAC Nuclear Power Reactor Decommissioning Industry," which aids in identifying and referencing the specific market segment covered.
12. How do I determine which pricing option suits my needs best?
The pricing options vary based on user requirements and access needs. Individual users may opt for single-user licenses, while businesses requiring broader access may choose multi-user or enterprise licenses for cost-effective access to the report.
13. Are there any additional resources or data provided in the APAC Nuclear Power Reactor Decommissioning Industry report?
While the report offers comprehensive insights, it's advisable to review the specific contents or supplementary materials provided to ascertain if additional resources or data are available.
14. How can I stay updated on further developments or reports in the APAC Nuclear Power Reactor Decommissioning Industry?
To stay informed about further developments, trends, and reports in the APAC Nuclear Power Reactor Decommissioning Industry, consider subscribing to industry newsletters, following relevant companies and organizations, or regularly checking reputable industry news sources and publications.
Methodology
Step 1 - Identification of Relevant Samples Size from Population Database


Step 2 - Approaches for Defining Global Market Size (Value, Volume* & Price*)

Note*: In applicable scenarios
Step 3 - Data Sources
Primary Research
- Web Analytics
- Survey Reports
- Research Institute
- Latest Research Reports
- Opinion Leaders
Secondary Research
- Annual Reports
- White Paper
- Latest Press Release
- Industry Association
- Paid Database
- Investor Presentations

Step 4 - Data Triangulation
Involves using different sources of information in order to increase the validity of a study
These sources are likely to be stakeholders in a program - participants, other researchers, program staff, other community members, and so on.
Then we put all data in single framework & apply various statistical tools to find out the dynamic on the market.
During the analysis stage, feedback from the stakeholder groups would be compared to determine areas of agreement as well as areas of divergence