

Key Insights
The Middle East and Africa (MEA) Demand Response Management Systems (DRMS) market is experiencing robust growth, driven by increasing electricity demand, rising energy costs, and a growing focus on grid stability and sustainability. The region's commitment to diversifying its energy sources and integrating renewable energy into the grid necessitates sophisticated DRMS solutions to manage fluctuating power generation and consumption. Governments across the MEA are actively promoting energy efficiency initiatives and smart grid deployments, creating a favorable regulatory environment for DRMS adoption. Furthermore, the expanding industrial sector, particularly in countries like Saudi Arabia and the UAE, is fueling demand for advanced DRMS solutions to optimize energy consumption and reduce operational costs. The adoption of automated DRMS is expected to outpace conventional systems due to its superior efficiency and real-time control capabilities. Key players, including ABB, Siemens, and Schneider Electric, are strategically investing in the region, expanding their product portfolios and partnerships to cater to the growing demand. While the initial investment costs associated with DRMS implementation can be a restraint, the long-term cost savings and improved grid reliability are incentivizing adoption across various sectors, including residential, commercial, and industrial.
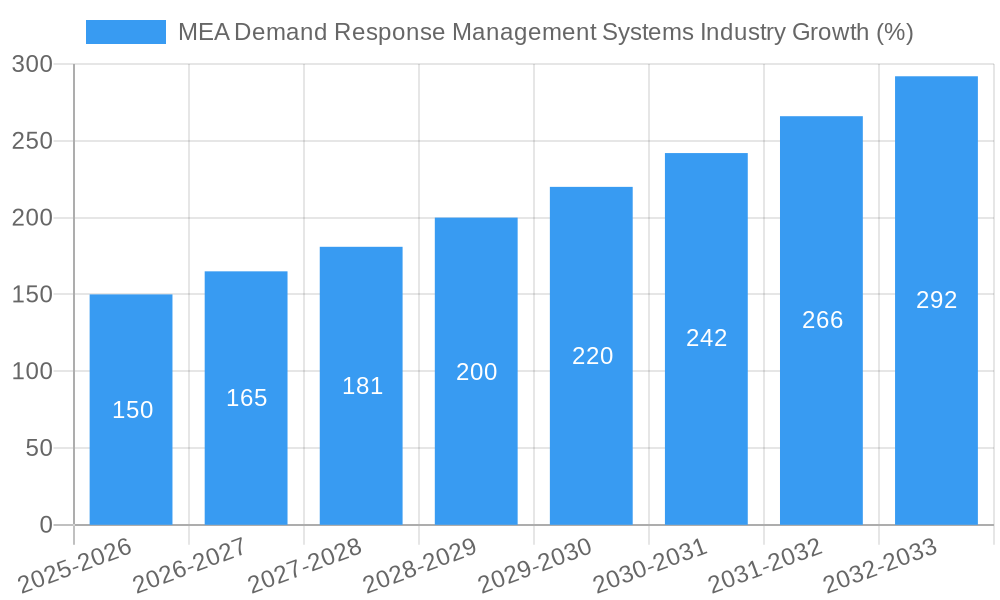
The forecast period of 2025-2033 promises continued expansion for the MEA DRMS market, with a projected CAGR exceeding 10%. This growth will be fueled by several factors including government incentives for renewable energy integration, increasing awareness about energy efficiency, and the deployment of smart city initiatives. The market segmentation will see significant growth in both conventional and automated demand response, with automated systems likely capturing a larger market share due to their enhanced capabilities. While challenges remain in terms of infrastructure development and digital literacy in certain parts of the region, overall market sentiment is positive, suggesting sustained growth and a wider adoption of DRMS across diverse sectors within the MEA region. The competitive landscape will remain dynamic, with existing players consolidating their market positions and new entrants exploring niche opportunities.
MEA Demand Response Management Systems Industry Market Report: 2019-2033
This comprehensive report provides an in-depth analysis of the Middle East and Africa (MEA) Demand Response Management Systems market, covering the period 2019-2033. It meticulously examines market dynamics, growth trends, dominant segments, key players, and emerging opportunities, offering invaluable insights for industry professionals, investors, and strategic decision-makers. The report segments the market by Type: Conventional Demand Response and Automated Demand Response, providing a granular understanding of each segment’s performance and future prospects. The total market size is projected to reach xx Million by 2033.
MEA Demand Response Management Systems Industry Market Dynamics & Structure
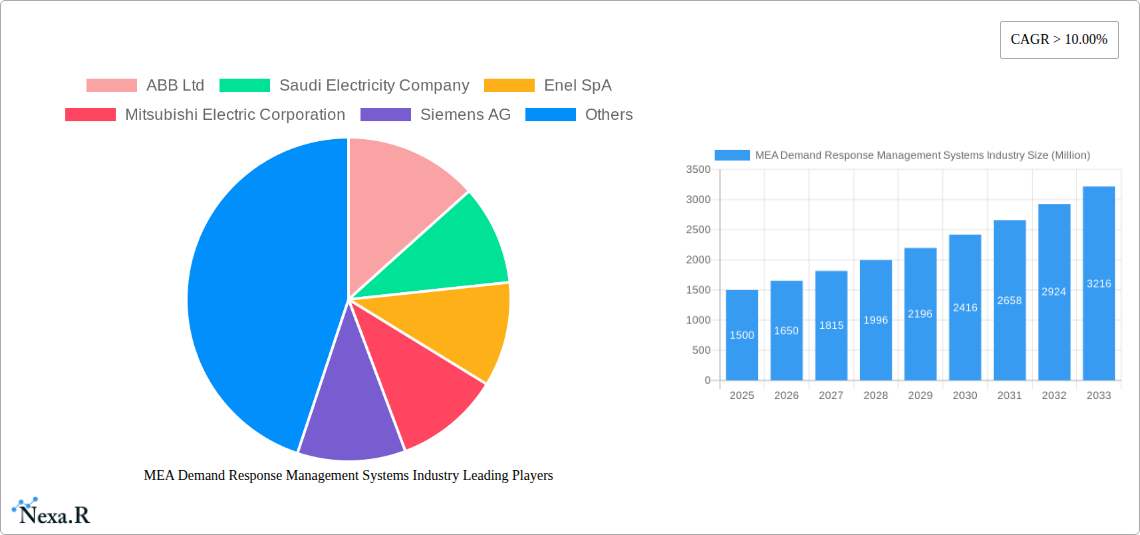
This section analyzes the MEA Demand Response Management Systems market's competitive landscape, technological advancements, regulatory environment, and market trends. The market is characterized by a moderate level of concentration, with key players such as ABB Ltd, Saudi Electricity Company, Enel SpA, Mitsubishi Electric Corporation, Siemens AG, Alstom SA, Eaton Corporation PLC, Schneider Electric, and General Electric Company holding significant market share. However, the emergence of innovative technologies and new entrants is fostering increased competition.
- Market Concentration: The market exhibits a moderately concentrated structure with the top 5 players holding approximately xx% of the market share in 2025.
- Technological Innovation: Advancements in AI, IoT, and cloud computing are driving the adoption of automated demand response systems, leading to increased efficiency and cost savings.
- Regulatory Framework: Government initiatives promoting energy efficiency and renewable energy integration are creating a favorable environment for demand response technologies. Examples include the UAE's National Water and Energy Demand Management Programme (NWEDMP) and ETIP 2.0 in Abu Dhabi.
- Competitive Substitutes: Energy storage solutions and distributed generation technologies pose some level of competition.
- End-User Demographics: The primary end-users include industrial facilities, commercial buildings, and utilities, with the industrial sector showing the fastest growth.
- M&A Trends: The number of M&A deals in the MEA region is expected to increase, driven by consolidation and the need for technological expertise. An estimated xx M&A deals are anticipated between 2025 and 2033.
MEA Demand Response Management Systems Industry Growth Trends & Insights
The MEA Demand Response Management Systems market is experiencing significant growth, driven by increasing energy demand, rising energy costs, and government initiatives promoting energy efficiency. The market size is projected to grow at a Compound Annual Growth Rate (CAGR) of xx% during the forecast period (2025-2033), reaching xx Million by 2033 from xx Million in 2025. This growth is fueled by factors such as the increasing adoption of smart grids, rising awareness of energy conservation, and the growing penetration of renewable energy sources. Technological disruptions like the adoption of AI and machine learning algorithms for optimized load management and the implementation of advanced metering infrastructure (AMI) also contribute to this growth. Consumer behavior is shifting towards more energy-efficient practices and environmentally conscious solutions, fostering greater demand for demand response systems. Market penetration is expected to reach xx% by 2033.
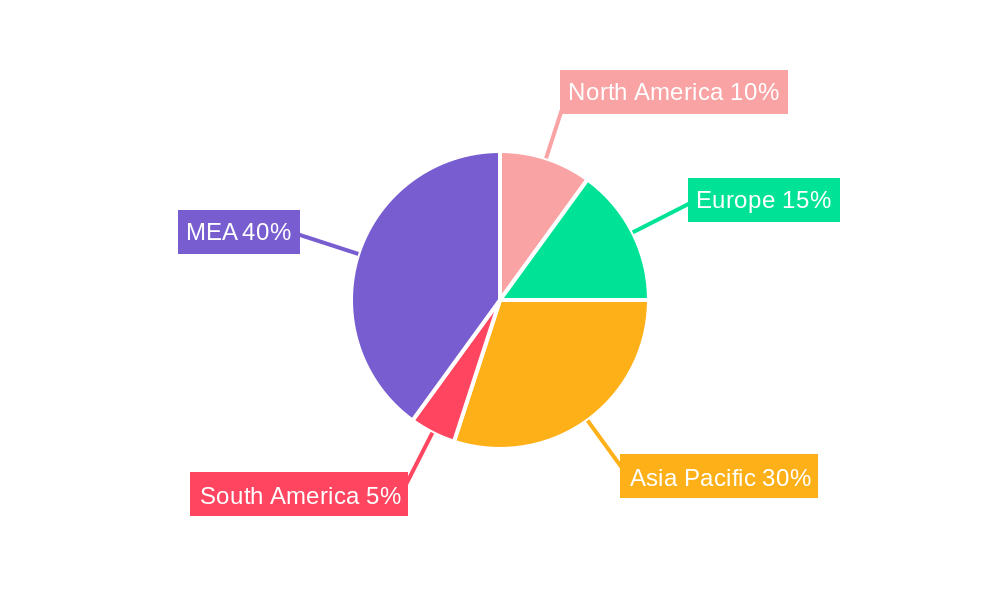
Dominant Regions, Countries, or Segments in MEA Demand Response Management Systems Industry
The UAE and Saudi Arabia are currently the leading markets for demand response management systems in the MEA region, driven by robust government support, significant investments in infrastructure development, and increasing energy consumption in these rapidly growing economies. The industrial sector is the fastest-growing segment for both Conventional and Automated Demand Response Systems, primarily due to their potential for significant energy cost savings.
- Key Drivers in UAE & Saudi Arabia:
- Government initiatives like the NWEDMP and ETIP 2.0
- High energy consumption and costs
- Investments in smart grid infrastructure
- Stringent regulations and incentives for energy efficiency.
- Conventional Demand Response: This segment is characterized by higher adoption rates in the industrial sector due to the significant potential for cost reduction and improvement of power quality.
- Automated Demand Response: Rapidly gaining traction, especially in the commercial and industrial sector as the technology matures and becomes more cost-effective.
MEA Demand Response Management Systems Industry Product Landscape
The MEA demand response management systems market offers a range of products, from basic conventional systems to sophisticated automated platforms integrated with advanced analytics and machine learning capabilities. These systems provide utilities and end-users with tools to optimize energy consumption, reduce peak demand, and improve grid stability. The key differentiators lie in the level of automation, integration capabilities with existing infrastructure, and the advanced analytics utilized for optimized energy management. Technological advancements include the deployment of AI-driven forecasting models and real-time energy management platforms that ensure optimal energy efficiency across diverse environments.
Key Drivers, Barriers & Challenges in MEA Demand Response Management Systems Industry
Key Drivers:
- Rising energy costs and increasing demand drive the need for efficient energy management.
- Government regulations and incentives supporting energy efficiency are strong motivators.
- Technological advancements in AI, IoT, and cloud computing offer improved system capabilities.
Challenges:
- High initial investment costs can be a barrier to adoption, particularly for smaller businesses.
- Lack of awareness and understanding about the benefits of demand response systems among consumers.
- Integration challenges with existing legacy infrastructure and varying grid architectures across different countries in the MEA region.
Emerging Opportunities in MEA Demand Response Management Systems Industry
The market presents several growth opportunities:
- Expansion into untapped markets within the MEA region, particularly in rapidly developing economies with growing energy needs.
- Development of tailored solutions for specific industry verticals, such as data centers and manufacturing facilities.
- Integration of demand response systems with renewable energy sources to maximize efficiency and grid stability.
Growth Accelerators in the MEA Demand Response Management Systems Industry
Long-term growth will be driven by several factors:
Technological advancements in AI and machine learning will enhance system efficiency and responsiveness. Strategic partnerships between utilities, technology providers, and end-users will accelerate market adoption. Expansion into new markets and diversification into related services will unlock additional growth opportunities.
Key Players Shaping the MEA Demand Response Management Systems Market
- ABB Ltd
- Saudi Electricity Company
- Enel SpA
- Mitsubishi Electric Corporation
- Siemens AG
- Alstom SA
- Eaton Corporation PLC
- Schneider Electric
- General Electric Company
Notable Milestones in MEA Demand Response Management Systems Industry Sector
- November 2022: The Abu Dhabi Department of Economic Development (ADDED) launched ETIP 2.0, offering preferential energy rates to incentivize energy efficiency among industrial players. This significantly boosted the demand for DRS in the industrial sector.
- April 2022: The UAE Ministry of Energy and Infrastructure launched a database to monitor energy and water consumption in government buildings. This initiative underscores the government’s commitment to improving energy efficiency and paves the way for wider adoption of DRS in public infrastructure.
In-Depth MEA Demand Response Management Systems Industry Market Outlook
The MEA Demand Response Management Systems market is poised for strong growth over the next decade, driven by a confluence of factors including increasing energy demand, rising energy costs, government support for energy efficiency initiatives, and technological advancements. Strategic partnerships and investments in research and development will be key to unlocking further market potential. The focus will be on developing more sophisticated and integrated systems that leverage AI and machine learning for enhanced energy optimization. The market presents significant opportunities for players who can offer innovative, cost-effective, and easily scalable solutions to address the diverse energy challenges across the MEA region.
MEA Demand Response Management Systems Industry Segmentation
-
1. Type
- 1.1. Conventional Demand Response
- 1.2. Automated Demand Response
-
2. Geography
- 2.1. United Arab Emirates
- 2.2. Saudi Arabian
- 2.3. South Africa
- 2.4. Res of Middle-East and Africa
MEA Demand Response Management Systems Industry Segmentation By Geography
- 1. United Arab Emirates
- 2. Saudi Arabian
- 3. South Africa
- 4. Res of Middle East and Africa
MEA Demand Response Management Systems Industry REPORT HIGHLIGHTS
| Aspects | Details |
|---|---|
| Study Period | 2019-2033 |
| Base Year | 2024 |
| Estimated Year | 2025 |
| Forecast Period | 2025-2033 |
| Historical Period | 2019-2024 |
| Growth Rate | CAGR of > 10.00% from 2019-2033 |
| Segmentation |
|
Table of Contents
- 1. Introduction
- 1.1. Research Scope
- 1.2. Market Segmentation
- 1.3. Research Methodology
- 1.4. Definitions and Assumptions
- 2. Executive Summary
- 2.1. Introduction
- 3. Market Dynamics
- 3.1. Introduction
- 3.2. Market Drivers
- 3.2.1. 4.; Need for Efficient Energy Management Systems4.; Growing Penetration of Renewable Energy Sources
- 3.3. Market Restrains
- 3.3.1. 4.; Privacy Concerns on the Industrial Demand Response Management Systems
- 3.4. Market Trends
- 3.4.1. Automated Demand Response System to Grow at the Fastest Rate
- 4. Market Factor Analysis
- 4.1. Porters Five Forces
- 4.2. Supply/Value Chain
- 4.3. PESTEL analysis
- 4.4. Market Entropy
- 4.5. Patent/Trademark Analysis
- 5. Global MEA Demand Response Management Systems Industry Analysis, Insights and Forecast, 2019-2031
- 5.1. Market Analysis, Insights and Forecast - by Type
- 5.1.1. Conventional Demand Response
- 5.1.2. Automated Demand Response
- 5.2. Market Analysis, Insights and Forecast - by Geography
- 5.2.1. United Arab Emirates
- 5.2.2. Saudi Arabian
- 5.2.3. South Africa
- 5.2.4. Res of Middle-East and Africa
- 5.3. Market Analysis, Insights and Forecast - by Region
- 5.3.1. United Arab Emirates
- 5.3.2. Saudi Arabian
- 5.3.3. South Africa
- 5.3.4. Res of Middle East and Africa
- 5.1. Market Analysis, Insights and Forecast - by Type
- 6. United Arab Emirates MEA Demand Response Management Systems Industry Analysis, Insights and Forecast, 2019-2031
- 6.1. Market Analysis, Insights and Forecast - by Type
- 6.1.1. Conventional Demand Response
- 6.1.2. Automated Demand Response
- 6.2. Market Analysis, Insights and Forecast - by Geography
- 6.2.1. United Arab Emirates
- 6.2.2. Saudi Arabian
- 6.2.3. South Africa
- 6.2.4. Res of Middle-East and Africa
- 6.1. Market Analysis, Insights and Forecast - by Type
- 7. Saudi Arabian MEA Demand Response Management Systems Industry Analysis, Insights and Forecast, 2019-2031
- 7.1. Market Analysis, Insights and Forecast - by Type
- 7.1.1. Conventional Demand Response
- 7.1.2. Automated Demand Response
- 7.2. Market Analysis, Insights and Forecast - by Geography
- 7.2.1. United Arab Emirates
- 7.2.2. Saudi Arabian
- 7.2.3. South Africa
- 7.2.4. Res of Middle-East and Africa
- 7.1. Market Analysis, Insights and Forecast - by Type
- 8. South Africa MEA Demand Response Management Systems Industry Analysis, Insights and Forecast, 2019-2031
- 8.1. Market Analysis, Insights and Forecast - by Type
- 8.1.1. Conventional Demand Response
- 8.1.2. Automated Demand Response
- 8.2. Market Analysis, Insights and Forecast - by Geography
- 8.2.1. United Arab Emirates
- 8.2.2. Saudi Arabian
- 8.2.3. South Africa
- 8.2.4. Res of Middle-East and Africa
- 8.1. Market Analysis, Insights and Forecast - by Type
- 9. Res of Middle East and Africa MEA Demand Response Management Systems Industry Analysis, Insights and Forecast, 2019-2031
- 9.1. Market Analysis, Insights and Forecast - by Type
- 9.1.1. Conventional Demand Response
- 9.1.2. Automated Demand Response
- 9.2. Market Analysis, Insights and Forecast - by Geography
- 9.2.1. United Arab Emirates
- 9.2.2. Saudi Arabian
- 9.2.3. South Africa
- 9.2.4. Res of Middle-East and Africa
- 9.1. Market Analysis, Insights and Forecast - by Type
- 10. North America MEA Demand Response Management Systems Industry Analysis, Insights and Forecast, 2019-2031
- 10.1. Market Analysis, Insights and Forecast - By Country/Sub-region
- 10.1.1 United States
- 10.1.2 Canada
- 10.1.3 Mexico
- 11. Europe MEA Demand Response Management Systems Industry Analysis, Insights and Forecast, 2019-2031
- 11.1. Market Analysis, Insights and Forecast - By Country/Sub-region
- 11.1.1 Germany
- 11.1.2 United Kingdom
- 11.1.3 France
- 11.1.4 Spain
- 11.1.5 Italy
- 11.1.6 Spain
- 11.1.7 Belgium
- 11.1.8 Netherland
- 11.1.9 Nordics
- 11.1.10 Rest of Europe
- 12. Asia Pacific MEA Demand Response Management Systems Industry Analysis, Insights and Forecast, 2019-2031
- 12.1. Market Analysis, Insights and Forecast - By Country/Sub-region
- 12.1.1 China
- 12.1.2 Japan
- 12.1.3 India
- 12.1.4 South Korea
- 12.1.5 Southeast Asia
- 12.1.6 Australia
- 12.1.7 Indonesia
- 12.1.8 Phillipes
- 12.1.9 Singapore
- 12.1.10 Thailandc
- 12.1.11 Rest of Asia Pacific
- 13. South America MEA Demand Response Management Systems Industry Analysis, Insights and Forecast, 2019-2031
- 13.1. Market Analysis, Insights and Forecast - By Country/Sub-region
- 13.1.1 Brazil
- 13.1.2 Argentina
- 13.1.3 Peru
- 13.1.4 Chile
- 13.1.5 Colombia
- 13.1.6 Ecuador
- 13.1.7 Venezuela
- 13.1.8 Rest of South America
- 14. MEA MEA Demand Response Management Systems Industry Analysis, Insights and Forecast, 2019-2031
- 14.1. Market Analysis, Insights and Forecast - By Country/Sub-region
- 14.1.1 United Arab Emirates
- 14.1.2 Saudi Arabia
- 14.1.3 South Africa
- 14.1.4 Rest of Middle East and Africa
- 15. Competitive Analysis
- 15.1. Global Market Share Analysis 2024
- 15.2. Company Profiles
- 15.2.1 ABB Ltd
- 15.2.1.1. Overview
- 15.2.1.2. Products
- 15.2.1.3. SWOT Analysis
- 15.2.1.4. Recent Developments
- 15.2.1.5. Financials (Based on Availability)
- 15.2.2 Saudi Electricity Company
- 15.2.2.1. Overview
- 15.2.2.2. Products
- 15.2.2.3. SWOT Analysis
- 15.2.2.4. Recent Developments
- 15.2.2.5. Financials (Based on Availability)
- 15.2.3 Enel SpA
- 15.2.3.1. Overview
- 15.2.3.2. Products
- 15.2.3.3. SWOT Analysis
- 15.2.3.4. Recent Developments
- 15.2.3.5. Financials (Based on Availability)
- 15.2.4 Mitsubishi Electric Corporation
- 15.2.4.1. Overview
- 15.2.4.2. Products
- 15.2.4.3. SWOT Analysis
- 15.2.4.4. Recent Developments
- 15.2.4.5. Financials (Based on Availability)
- 15.2.5 Siemens AG
- 15.2.5.1. Overview
- 15.2.5.2. Products
- 15.2.5.3. SWOT Analysis
- 15.2.5.4. Recent Developments
- 15.2.5.5. Financials (Based on Availability)
- 15.2.6 Alstom SA
- 15.2.6.1. Overview
- 15.2.6.2. Products
- 15.2.6.3. SWOT Analysis
- 15.2.6.4. Recent Developments
- 15.2.6.5. Financials (Based on Availability)
- 15.2.7 Eaton Corporation PLC
- 15.2.7.1. Overview
- 15.2.7.2. Products
- 15.2.7.3. SWOT Analysis
- 15.2.7.4. Recent Developments
- 15.2.7.5. Financials (Based on Availability)
- 15.2.8 Schneider Electric
- 15.2.8.1. Overview
- 15.2.8.2. Products
- 15.2.8.3. SWOT Analysis
- 15.2.8.4. Recent Developments
- 15.2.8.5. Financials (Based on Availability)
- 15.2.9 General Electric Company
- 15.2.9.1. Overview
- 15.2.9.2. Products
- 15.2.9.3. SWOT Analysis
- 15.2.9.4. Recent Developments
- 15.2.9.5. Financials (Based on Availability)
- 15.2.1 ABB Ltd
List of Figures
- Figure 1: Global MEA Demand Response Management Systems Industry Revenue Breakdown (Million, %) by Region 2024 & 2032
- Figure 2: North America MEA Demand Response Management Systems Industry Revenue (Million), by Country 2024 & 2032
- Figure 3: North America MEA Demand Response Management Systems Industry Revenue Share (%), by Country 2024 & 2032
- Figure 4: Europe MEA Demand Response Management Systems Industry Revenue (Million), by Country 2024 & 2032
- Figure 5: Europe MEA Demand Response Management Systems Industry Revenue Share (%), by Country 2024 & 2032
- Figure 6: Asia Pacific MEA Demand Response Management Systems Industry Revenue (Million), by Country 2024 & 2032
- Figure 7: Asia Pacific MEA Demand Response Management Systems Industry Revenue Share (%), by Country 2024 & 2032
- Figure 8: South America MEA Demand Response Management Systems Industry Revenue (Million), by Country 2024 & 2032
- Figure 9: South America MEA Demand Response Management Systems Industry Revenue Share (%), by Country 2024 & 2032
- Figure 10: MEA MEA Demand Response Management Systems Industry Revenue (Million), by Country 2024 & 2032
- Figure 11: MEA MEA Demand Response Management Systems Industry Revenue Share (%), by Country 2024 & 2032
- Figure 12: United Arab Emirates MEA Demand Response Management Systems Industry Revenue (Million), by Type 2024 & 2032
- Figure 13: United Arab Emirates MEA Demand Response Management Systems Industry Revenue Share (%), by Type 2024 & 2032
- Figure 14: United Arab Emirates MEA Demand Response Management Systems Industry Revenue (Million), by Geography 2024 & 2032
- Figure 15: United Arab Emirates MEA Demand Response Management Systems Industry Revenue Share (%), by Geography 2024 & 2032
- Figure 16: United Arab Emirates MEA Demand Response Management Systems Industry Revenue (Million), by Country 2024 & 2032
- Figure 17: United Arab Emirates MEA Demand Response Management Systems Industry Revenue Share (%), by Country 2024 & 2032
- Figure 18: Saudi Arabian MEA Demand Response Management Systems Industry Revenue (Million), by Type 2024 & 2032
- Figure 19: Saudi Arabian MEA Demand Response Management Systems Industry Revenue Share (%), by Type 2024 & 2032
- Figure 20: Saudi Arabian MEA Demand Response Management Systems Industry Revenue (Million), by Geography 2024 & 2032
- Figure 21: Saudi Arabian MEA Demand Response Management Systems Industry Revenue Share (%), by Geography 2024 & 2032
- Figure 22: Saudi Arabian MEA Demand Response Management Systems Industry Revenue (Million), by Country 2024 & 2032
- Figure 23: Saudi Arabian MEA Demand Response Management Systems Industry Revenue Share (%), by Country 2024 & 2032
- Figure 24: South Africa MEA Demand Response Management Systems Industry Revenue (Million), by Type 2024 & 2032
- Figure 25: South Africa MEA Demand Response Management Systems Industry Revenue Share (%), by Type 2024 & 2032
- Figure 26: South Africa MEA Demand Response Management Systems Industry Revenue (Million), by Geography 2024 & 2032
- Figure 27: South Africa MEA Demand Response Management Systems Industry Revenue Share (%), by Geography 2024 & 2032
- Figure 28: South Africa MEA Demand Response Management Systems Industry Revenue (Million), by Country 2024 & 2032
- Figure 29: South Africa MEA Demand Response Management Systems Industry Revenue Share (%), by Country 2024 & 2032
- Figure 30: Res of Middle East and Africa MEA Demand Response Management Systems Industry Revenue (Million), by Type 2024 & 2032
- Figure 31: Res of Middle East and Africa MEA Demand Response Management Systems Industry Revenue Share (%), by Type 2024 & 2032
- Figure 32: Res of Middle East and Africa MEA Demand Response Management Systems Industry Revenue (Million), by Geography 2024 & 2032
- Figure 33: Res of Middle East and Africa MEA Demand Response Management Systems Industry Revenue Share (%), by Geography 2024 & 2032
- Figure 34: Res of Middle East and Africa MEA Demand Response Management Systems Industry Revenue (Million), by Country 2024 & 2032
- Figure 35: Res of Middle East and Africa MEA Demand Response Management Systems Industry Revenue Share (%), by Country 2024 & 2032
List of Tables
- Table 1: Global MEA Demand Response Management Systems Industry Revenue Million Forecast, by Region 2019 & 2032
- Table 2: Global MEA Demand Response Management Systems Industry Revenue Million Forecast, by Type 2019 & 2032
- Table 3: Global MEA Demand Response Management Systems Industry Revenue Million Forecast, by Geography 2019 & 2032
- Table 4: Global MEA Demand Response Management Systems Industry Revenue Million Forecast, by Region 2019 & 2032
- Table 5: Global MEA Demand Response Management Systems Industry Revenue Million Forecast, by Country 2019 & 2032
- Table 6: United States MEA Demand Response Management Systems Industry Revenue (Million) Forecast, by Application 2019 & 2032
- Table 7: Canada MEA Demand Response Management Systems Industry Revenue (Million) Forecast, by Application 2019 & 2032
- Table 8: Mexico MEA Demand Response Management Systems Industry Revenue (Million) Forecast, by Application 2019 & 2032
- Table 9: Global MEA Demand Response Management Systems Industry Revenue Million Forecast, by Country 2019 & 2032
- Table 10: Germany MEA Demand Response Management Systems Industry Revenue (Million) Forecast, by Application 2019 & 2032
- Table 11: United Kingdom MEA Demand Response Management Systems Industry Revenue (Million) Forecast, by Application 2019 & 2032
- Table 12: France MEA Demand Response Management Systems Industry Revenue (Million) Forecast, by Application 2019 & 2032
- Table 13: Spain MEA Demand Response Management Systems Industry Revenue (Million) Forecast, by Application 2019 & 2032
- Table 14: Italy MEA Demand Response Management Systems Industry Revenue (Million) Forecast, by Application 2019 & 2032
- Table 15: Spain MEA Demand Response Management Systems Industry Revenue (Million) Forecast, by Application 2019 & 2032
- Table 16: Belgium MEA Demand Response Management Systems Industry Revenue (Million) Forecast, by Application 2019 & 2032
- Table 17: Netherland MEA Demand Response Management Systems Industry Revenue (Million) Forecast, by Application 2019 & 2032
- Table 18: Nordics MEA Demand Response Management Systems Industry Revenue (Million) Forecast, by Application 2019 & 2032
- Table 19: Rest of Europe MEA Demand Response Management Systems Industry Revenue (Million) Forecast, by Application 2019 & 2032
- Table 20: Global MEA Demand Response Management Systems Industry Revenue Million Forecast, by Country 2019 & 2032
- Table 21: China MEA Demand Response Management Systems Industry Revenue (Million) Forecast, by Application 2019 & 2032
- Table 22: Japan MEA Demand Response Management Systems Industry Revenue (Million) Forecast, by Application 2019 & 2032
- Table 23: India MEA Demand Response Management Systems Industry Revenue (Million) Forecast, by Application 2019 & 2032
- Table 24: South Korea MEA Demand Response Management Systems Industry Revenue (Million) Forecast, by Application 2019 & 2032
- Table 25: Southeast Asia MEA Demand Response Management Systems Industry Revenue (Million) Forecast, by Application 2019 & 2032
- Table 26: Australia MEA Demand Response Management Systems Industry Revenue (Million) Forecast, by Application 2019 & 2032
- Table 27: Indonesia MEA Demand Response Management Systems Industry Revenue (Million) Forecast, by Application 2019 & 2032
- Table 28: Phillipes MEA Demand Response Management Systems Industry Revenue (Million) Forecast, by Application 2019 & 2032
- Table 29: Singapore MEA Demand Response Management Systems Industry Revenue (Million) Forecast, by Application 2019 & 2032
- Table 30: Thailandc MEA Demand Response Management Systems Industry Revenue (Million) Forecast, by Application 2019 & 2032
- Table 31: Rest of Asia Pacific MEA Demand Response Management Systems Industry Revenue (Million) Forecast, by Application 2019 & 2032
- Table 32: Global MEA Demand Response Management Systems Industry Revenue Million Forecast, by Country 2019 & 2032
- Table 33: Brazil MEA Demand Response Management Systems Industry Revenue (Million) Forecast, by Application 2019 & 2032
- Table 34: Argentina MEA Demand Response Management Systems Industry Revenue (Million) Forecast, by Application 2019 & 2032
- Table 35: Peru MEA Demand Response Management Systems Industry Revenue (Million) Forecast, by Application 2019 & 2032
- Table 36: Chile MEA Demand Response Management Systems Industry Revenue (Million) Forecast, by Application 2019 & 2032
- Table 37: Colombia MEA Demand Response Management Systems Industry Revenue (Million) Forecast, by Application 2019 & 2032
- Table 38: Ecuador MEA Demand Response Management Systems Industry Revenue (Million) Forecast, by Application 2019 & 2032
- Table 39: Venezuela MEA Demand Response Management Systems Industry Revenue (Million) Forecast, by Application 2019 & 2032
- Table 40: Rest of South America MEA Demand Response Management Systems Industry Revenue (Million) Forecast, by Application 2019 & 2032
- Table 41: Global MEA Demand Response Management Systems Industry Revenue Million Forecast, by Country 2019 & 2032
- Table 42: United Arab Emirates MEA Demand Response Management Systems Industry Revenue (Million) Forecast, by Application 2019 & 2032
- Table 43: Saudi Arabia MEA Demand Response Management Systems Industry Revenue (Million) Forecast, by Application 2019 & 2032
- Table 44: South Africa MEA Demand Response Management Systems Industry Revenue (Million) Forecast, by Application 2019 & 2032
- Table 45: Rest of Middle East and Africa MEA Demand Response Management Systems Industry Revenue (Million) Forecast, by Application 2019 & 2032
- Table 46: Global MEA Demand Response Management Systems Industry Revenue Million Forecast, by Type 2019 & 2032
- Table 47: Global MEA Demand Response Management Systems Industry Revenue Million Forecast, by Geography 2019 & 2032
- Table 48: Global MEA Demand Response Management Systems Industry Revenue Million Forecast, by Country 2019 & 2032
- Table 49: Global MEA Demand Response Management Systems Industry Revenue Million Forecast, by Type 2019 & 2032
- Table 50: Global MEA Demand Response Management Systems Industry Revenue Million Forecast, by Geography 2019 & 2032
- Table 51: Global MEA Demand Response Management Systems Industry Revenue Million Forecast, by Country 2019 & 2032
- Table 52: Global MEA Demand Response Management Systems Industry Revenue Million Forecast, by Type 2019 & 2032
- Table 53: Global MEA Demand Response Management Systems Industry Revenue Million Forecast, by Geography 2019 & 2032
- Table 54: Global MEA Demand Response Management Systems Industry Revenue Million Forecast, by Country 2019 & 2032
- Table 55: Global MEA Demand Response Management Systems Industry Revenue Million Forecast, by Type 2019 & 2032
- Table 56: Global MEA Demand Response Management Systems Industry Revenue Million Forecast, by Geography 2019 & 2032
- Table 57: Global MEA Demand Response Management Systems Industry Revenue Million Forecast, by Country 2019 & 2032
Frequently Asked Questions
1. What is the projected Compound Annual Growth Rate (CAGR) of the MEA Demand Response Management Systems Industry?
The projected CAGR is approximately > 10.00%.
2. Which companies are prominent players in the MEA Demand Response Management Systems Industry?
Key companies in the market include ABB Ltd, Saudi Electricity Company, Enel SpA, Mitsubishi Electric Corporation, Siemens AG, Alstom SA, Eaton Corporation PLC, Schneider Electric, General Electric Company.
3. What are the main segments of the MEA Demand Response Management Systems Industry?
The market segments include Type, Geography.
4. Can you provide details about the market size?
The market size is estimated to be USD XX Million as of 2022.
5. What are some drivers contributing to market growth?
4.; Need for Efficient Energy Management Systems4.; Growing Penetration of Renewable Energy Sources.
6. What are the notable trends driving market growth?
Automated Demand Response System to Grow at the Fastest Rate.
7. Are there any restraints impacting market growth?
4.; Privacy Concerns on the Industrial Demand Response Management Systems.
8. Can you provide examples of recent developments in the market?
Nov 2022: The Abu Dhabi Department of Economic Development (ADDED) expanded the Energy Tariff Incentive Programme (ETIP 2.0) by offering preferential rates for gas and electricity to the industrial sector based on eligibility criteria that include economic impact, Emiratisation rate, and energy management efficiency.
9. What pricing options are available for accessing the report?
Pricing options include single-user, multi-user, and enterprise licenses priced at USD 4750, USD 5250, and USD 8750 respectively.
10. Is the market size provided in terms of value or volume?
The market size is provided in terms of value, measured in Million.
11. Are there any specific market keywords associated with the report?
Yes, the market keyword associated with the report is "MEA Demand Response Management Systems Industry," which aids in identifying and referencing the specific market segment covered.
12. How do I determine which pricing option suits my needs best?
The pricing options vary based on user requirements and access needs. Individual users may opt for single-user licenses, while businesses requiring broader access may choose multi-user or enterprise licenses for cost-effective access to the report.
13. Are there any additional resources or data provided in the MEA Demand Response Management Systems Industry report?
While the report offers comprehensive insights, it's advisable to review the specific contents or supplementary materials provided to ascertain if additional resources or data are available.
14. How can I stay updated on further developments or reports in the MEA Demand Response Management Systems Industry?
To stay informed about further developments, trends, and reports in the MEA Demand Response Management Systems Industry, consider subscribing to industry newsletters, following relevant companies and organizations, or regularly checking reputable industry news sources and publications.
Methodology
Step 1 - Identification of Relevant Samples Size from Population Database


Step 2 - Approaches for Defining Global Market Size (Value, Volume* & Price*)

Note*: In applicable scenarios
Step 3 - Data Sources
Primary Research
- Web Analytics
- Survey Reports
- Research Institute
- Latest Research Reports
- Opinion Leaders
Secondary Research
- Annual Reports
- White Paper
- Latest Press Release
- Industry Association
- Paid Database
- Investor Presentations

Step 4 - Data Triangulation
Involves using different sources of information in order to increase the validity of a study
These sources are likely to be stakeholders in a program - participants, other researchers, program staff, other community members, and so on.
Then we put all data in single framework & apply various statistical tools to find out the dynamic on the market.
During the analysis stage, feedback from the stakeholder groups would be compared to determine areas of agreement as well as areas of divergence
