

Key Insights
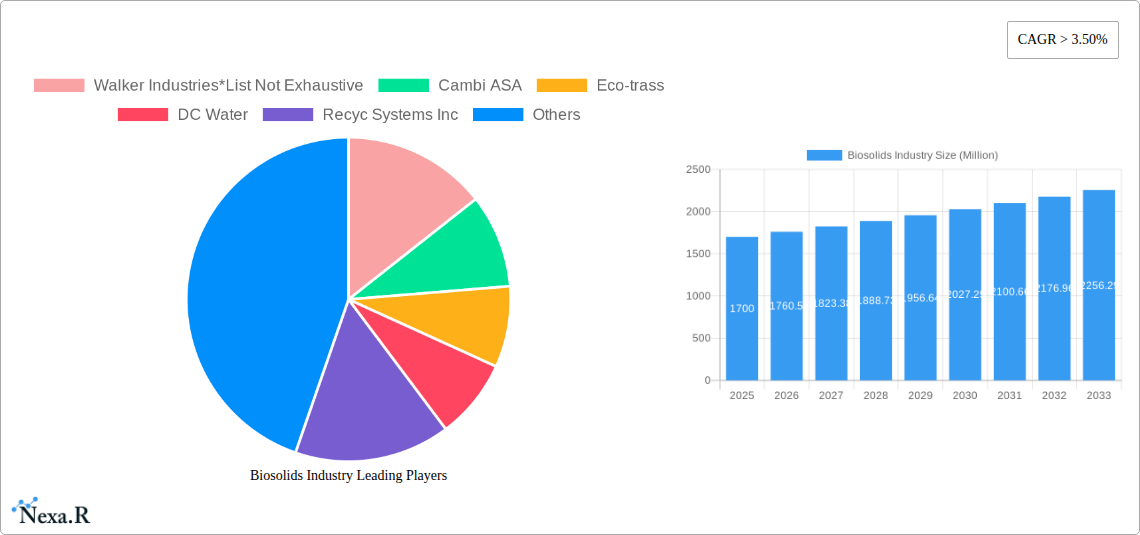
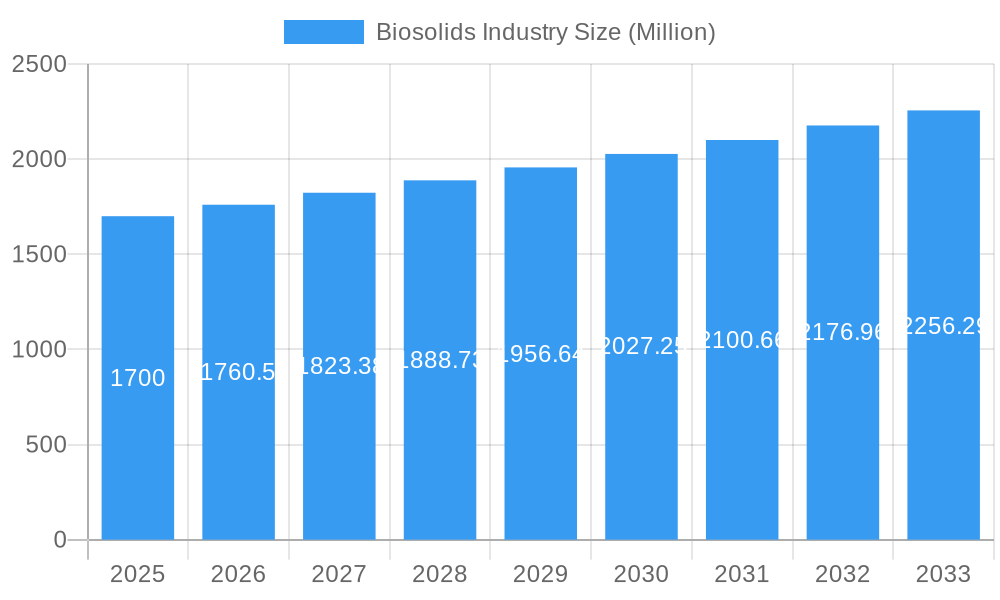
The biosolids market, valued at $1700 million in 2025, is projected to experience robust growth, exhibiting a compound annual growth rate (CAGR) exceeding 3.5% from 2025 to 2033. This growth is driven by several factors. Increasing environmental regulations regarding wastewater treatment and disposal are pushing municipalities and industries to adopt sustainable biosolids management practices. The rising demand for organic fertilizers in agriculture, particularly in regions with intensive farming, fuels the utilization of biosolids as a cost-effective and environmentally friendly alternative to synthetic fertilizers. Furthermore, advancements in biosolids processing technologies, leading to higher-quality products with enhanced nutrient content and reduced pathogens, are broadening the application spectrum and driving market expansion. The market segmentation reveals significant opportunities across various forms (cakes, liquid, pellets) and applications (agriculture, landscaping, energy recovery). The dominance of Class A and Class A EQ biosolids underscores the increasing focus on producing high-quality, safe products.
Biosolids Industry Market Size (In Billion)
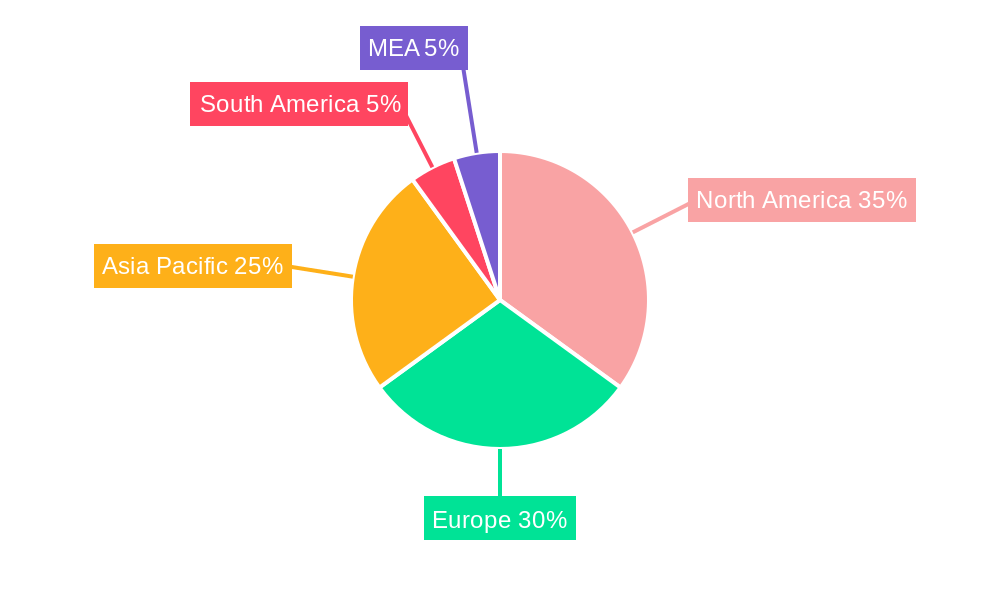
Competitive dynamics within the biosolids market are characterized by a mix of large multinational corporations and smaller regional players. Key players like Walker Industries, Cambi ASA, and Eco-trass are actively involved in developing and implementing innovative technologies, while regional companies cater to specific geographical needs and local regulations. Geographical analysis indicates strong market penetration in North America and Europe, owing to established infrastructure and stringent environmental regulations. However, substantial growth potential exists in the Asia-Pacific region, driven by increasing urbanization and industrialization, leading to a growing need for efficient wastewater treatment and sustainable biosolids management solutions. The market's future trajectory hinges on further technological advancements, evolving regulatory landscapes, and the ongoing shift towards circular economy practices, fostering the sustainable utilization of biosolids as a valuable resource.
Biosolids Industry Company Market Share
Biosolids Industry Market Report: 2019-2033
This comprehensive report provides a detailed analysis of the Biosolids industry, encompassing market dynamics, growth trends, regional insights, product landscape, and key players. With a study period spanning 2019-2033, a base year of 2025, and a forecast period of 2025-2033, this report is an invaluable resource for industry professionals, investors, and stakeholders seeking to understand and capitalize on opportunities within this evolving market. The report segments the market by form (Cakes, Liquid, Pellet), application (Agriculture land Application, Fertilizer for Animal Crop Production - Pastures, Non-agricultural Land Application, Landscaping, Recreational Fields, and Domestic Use, Energy Recovery Energy Production), and type (Class A, Class A EQ, Class B).
Biosolids Industry Market Dynamics & Structure
The global biosolids market is characterized by a dynamic and evolving structure, featuring a blend of established large-scale operators and a robust network of smaller, regional specialists. This moderate concentration fosters both competition and collaboration, driving innovation across the sector. A significant catalyst for market evolution is the continuous advancement in treatment technologies, with thermal hydrolysis and anaerobic digestion at the forefront. These innovations are not only enhancing operational efficiency but also broadening the spectrum of valuable applications for treated biosolids. The market's trajectory is profoundly shaped by a complex and often stringent environmental regulatory framework, which varies considerably by geographical location. These regulations are instrumental in mandating and promoting the adoption of cutting-edge biosolids treatment solutions, ensuring public health and environmental protection. While alternative fertilizers and soil amendments are present, they face limitations in matching the inherent cost-effectiveness and comprehensive environmental benefits offered by biosolids, particularly in soil conditioning and nutrient provision. The primary end-user base for biosolids comprises a vital mix of agricultural entities, sophisticated landscaping companies, and forward-thinking municipal authorities, all seeking sustainable and efficient resource management. The industry also witnesses consistent Mergers & Acquisitions (M&A) activity, with leading companies strategically pursuing geographical expansion and the integration of diverse service offerings to solidify their market position.
- Market Concentration: Moderately concentrated, with a few dominant players holding an estimated xx% market share (2024), alongside a significant number of regional and specialized operators.
- Technological Innovation: The industry is heavily invested in advancements in thermal hydrolysis, anaerobic digestion, enhanced dewatering techniques, and nutrient recovery. Key innovation barriers include substantial capital investment requirements and navigating complex regulatory landscapes.
- Regulatory Framework: A critical influencing factor, with regulations varying widely across jurisdictions. These differences impact treatment standards, product quality requirements, and permissible application practices, creating a complex operational environment.
- Competitive Substitutes: While chemical fertilizers represent the primary competitive threat, biosolids offer distinct advantages in soil health improvement, nutrient cycling, and carbon sequestration, making them a compelling and often more sustainable alternative for specific applications.
- End-User Demographics: The market is predominantly served by agricultural businesses (estimated xx Million units), professional landscaping firms (estimated xx Million units), and progressive municipalities (estimated xx Million units) (2024), all recognizing the value of biosolids as a resource.
- M&A Trends: The sector experiences a healthy level of M&A activity, primarily driven by strategic imperatives such as expanding market reach, acquiring new technologies, and consolidating service portfolios. Approximately xx deals were recorded in 2024.
Biosolids Industry Growth Trends & Insights
The biosolids market is demonstrating robust and consistent growth, fueled by a confluence of factors including escalating urbanization, increasingly stringent environmental mandates, and a growing global imperative for sustainable agricultural practices. Projections indicate the market size is expected to reach xx Million units by 2025, with a projected Compound Annual Growth Rate (CAGR) of xx% during the forecast period (2025-2033). Adoption rates are significantly influenced by supportive government incentives, the pace of technological advancements, and evolving public perception regarding the safety and benefits of biosolids. Emerging technological disruptions, such as highly efficient dewatering technologies and advanced bioenergy recovery methods, are pivotal in driving operational efficiencies and facilitating market expansion. Furthermore, a discernible shift in consumer and business behavior towards more environmentally conscious products and services is acting as a significant tailwind for the market's continued growth.
Dominant Regions, Countries, or Segments in Biosolids Industry
North America and Europe currently dominate the biosolids market, driven by stringent environmental regulations and robust wastewater treatment infrastructure. Within these regions, the agricultural land application segment holds the largest market share, followed by non-agricultural land application and energy recovery. Key drivers include:
- North America: Stringent environmental regulations, well-established wastewater infrastructure, and significant agricultural sector.
- Europe: High population density, advanced wastewater treatment technologies, and growing focus on sustainable agriculture.
- Asia-Pacific: Rapid urbanization and industrialization are driving market growth, though at a slower pace compared to North America and Europe.
The Class A and Class A EQ biosolids segments demonstrate higher growth potential due to their wider range of applications and increased regulatory acceptance.
Biosolids Industry Product Landscape
The biosolids product spectrum is primarily categorized into distinct forms: cakes, liquids, and pellets. Each of these forms is engineered to meet specific application requirements, handling capabilities, and logistical considerations. Contemporary innovations are intensely focused on enhancing the inherent nutrient content of biosolids, mitigating odor concerns, and further improving pathogen inactivation processes to meet the highest safety standards. Advancements in drying, pelletization, and various stabilization methodologies are instrumental in elevating product quality and market appeal. The compelling unique selling propositions of biosolids products include their significant cost-effectiveness when juxtaposed with conventional synthetic fertilizers, and their substantial environmental advantages, such as profound soil improvement properties and a notable contribution to carbon sequestration.
Key Drivers, Barriers & Challenges in Biosolids Industry
Key Drivers:
- Stringent environmental regulations promoting resource recovery.
- Growing demand for sustainable agricultural practices.
- Advancements in biosolids treatment technologies.
- Increasing public awareness of environmental sustainability.
Key Challenges and Restraints:
- Public perception issues related to odor and potential health concerns.
- High capital costs associated with advanced treatment technologies.
- Supply chain complexities and logistical challenges in distribution.
- Regulatory hurdles and variations across different regions. These hurdles impact xx% of projects annually.
Emerging Opportunities in Biosolids Industry
- Expanding applications of biosolids in bioenergy production and bio-based materials.
- Development of value-added bioproducts from biosolids, such as biochar or biostimulants.
- Increasing use of biosolids in mine reclamation and land restoration projects.
- Targeting niche markets, such as golf courses and urban landscaping.
Growth Accelerators in the Biosolids Industry
Technological breakthroughs in biosolids treatment and processing are significantly accelerating market growth. Strategic partnerships between wastewater treatment plants, agricultural businesses, and technology providers are facilitating market expansion. Furthermore, government incentives and supportive policies promoting sustainable waste management are crucial catalysts for long-term growth.
Key Players Shaping the Biosolids Industry Market
- Walker Industries
- Cambi ASA
- Eco-trass
- DC Water
- Recyc Systems Inc
- BCR Environmental
- Aguas Andinas SA
- Cleanaway
- SYLVIS
- Casella Waste Systems Inc
- Englobe
- Agrivert Ltd
- Saur
- Alan Srl
- Lystek International
- REMONDIS SE & Co KG
- FCC Group
- Synagro Technologies
- C R E - Centro di Ricerche Ecologiche
- Parker Ag Services LLC
- Terrapure BR Ltd
- Merrell Bros Inc
- Allevi Srl
Notable Milestones in Biosolids Industry Sector
- November 2022: The San Francisco Public Utilities Commission (SFPUC) and Cambi announced a monumental partnership for a USD 3 billion Biosolids Digester Facilities Project. This landmark collaboration underscores significant investment in and commitment to advanced treatment technologies.
- January 2023: Synagro Technologies bolstered its operational capabilities through the strategic acquisition of Burch Hydro Inc. This move significantly expands Synagro's footprint and expertise in biosolids and residuals management.
In-Depth Biosolids Industry Market Outlook
The biosolids market is poised for sustained growth, driven by technological innovation, stringent environmental regulations, and increasing demand for sustainable solutions. Strategic investments in advanced treatment technologies, coupled with collaborative partnerships across the value chain, present significant opportunities for market expansion and value creation. The focus on circular economy principles and the potential for biosolids to contribute to climate change mitigation will further fuel market growth in the coming years.
Biosolids Industry Segmentation
-
1. Type
- 1.1. Class A
- 1.2. Class A EQ (Exceptional Quality)
- 1.3. Class B
-
2. Form
- 2.1. Cakes
- 2.2. Liquid
- 2.3. Pellet
-
3. Application
-
3.1. Agriculture land Application
- 3.1.1. Fertiliz
- 3.1.2. Fertilizer for Animal Crop Production - Pastures
-
3.2. Non-agricultural Land Application
- 3.2.1. Forest Crops (Land Restoration and Forestry)
- 3.2.2. Land Reclamation (Roads and Urban Wetlands)
- 3.2.3. Reclaiming Mining Sites
- 3.2.4. Landscaping, Recreational Fields, and Domestic Use
-
3.3. Energy Recovery Energy Production
- 3.3.1. Heat Generation, Incineration, and Gasification
- 3.3.2. Oil and Cement Production
- 3.3.3. Commercial Uses
-
3.1. Agriculture land Application
Biosolids Industry Segmentation By Geography
-
1. Asia Pacific
- 1.1. China
- 1.2. India
- 1.3. Japan
- 1.4. South Korea
- 1.5. Malaysia
- 1.6. Thailand
- 1.7. Indonesia
- 1.8. Vietnam
- 1.9. Rest of Asia Pacific
-
2. North America
- 2.1. United States
- 2.2. Canada
- 2.3. Mexico
-
3. Europe
- 3.1. Germany
- 3.2. United Kingdom
- 3.3. Italy
- 3.4. France
- 3.5. Spain
- 3.6. NORDIC
- 3.7. Turkey
- 3.8. Russia
- 3.9. Rest of Europe
-
4. South America
- 4.1. Brazil
- 4.2. Argentina
- 4.3. Colombia
- 4.4. Rest of South America
-
5. Middle East and Africa
- 5.1. Saudi Arabia
- 5.2. South Africa
- 5.3. Nigeria
- 5.4. Qatar
- 5.5. Egypt
- 5.6. United Arab Emirates
- 5.7. Rest of Middle East and Africa
Biosolids Industry Regional Market Share
Geographic Coverage of Biosolids Industry
Biosolids Industry REPORT HIGHLIGHTS
| Aspects | Details |
|---|---|
| Study Period | 2020-2034 |
| Base Year | 2025 |
| Estimated Year | 2026 |
| Forecast Period | 2026-2034 |
| Historical Period | 2020-2025 |
| Growth Rate | CAGR of > 3.50% from 2020-2034 |
| Segmentation |
|
Table of Contents
- 1. Introduction
- 1.1. Research Scope
- 1.2. Market Segmentation
- 1.3. Research Objective
- 1.4. Definitions and Assumptions
- 2. Executive Summary
- 2.1. Market Snapshot
- 3. Market Dynamics
- 3.1. Market Drivers
- 3.2. Market Restrains
- 3.3. Market Trends
- 3.4. Market Opportunities
- 4. Market Factor Analysis
- 4.1. Porters Five Forces
- 4.1.1. Bargaining Power of Suppliers
- 4.1.2. Bargaining Power of Buyers
- 4.1.3. Threat of New Entrants
- 4.1.4. Threat of Substitutes
- 4.1.5. Competitive Rivalry
- 4.2. PESTEL analysis
- 4.3. BCG Analysis
- 4.3.1. Stars (High Growth, High Market Share)
- 4.3.2. Cash Cows (Low Growth, High Market Share)
- 4.3.3. Question Mark (High Growth, Low Market Share)
- 4.3.4. Dogs (Low Growth, Low Market Share)
- 4.4. Ansoff Matrix Analysis
- 4.5. Supply Chain Analysis
- 4.6. Regulatory Landscape
- 4.7. Current Market Potential and Opportunity Assessment (TAM–SAM–SOM Framework)
- 4.8. NRP Analyst Note
- 4.1. Porters Five Forces
- 5. Market Analysis, Insights and Forecast 2021-2033
- 5.1. Market Analysis, Insights and Forecast - by Type
- 5.1.1. Class A
- 5.1.2. Class A EQ (Exceptional Quality)
- 5.1.3. Class B
- 5.2. Market Analysis, Insights and Forecast - by Form
- 5.2.1. Cakes
- 5.2.2. Liquid
- 5.2.3. Pellet
- 5.3. Market Analysis, Insights and Forecast - by Application
- 5.3.1. Agriculture land Application
- 5.3.1.1. Fertiliz
- 5.3.1.2. Fertilizer for Animal Crop Production - Pastures
- 5.3.2. Non-agricultural Land Application
- 5.3.2.1. Forest Crops (Land Restoration and Forestry)
- 5.3.2.2. Land Reclamation (Roads and Urban Wetlands)
- 5.3.2.3. Reclaiming Mining Sites
- 5.3.2.4. Landscaping, Recreational Fields, and Domestic Use
- 5.3.3. Energy Recovery Energy Production
- 5.3.3.1. Heat Generation, Incineration, and Gasification
- 5.3.3.2. Oil and Cement Production
- 5.3.3.3. Commercial Uses
- 5.3.1. Agriculture land Application
- 5.4. Market Analysis, Insights and Forecast - by Region
- 5.4.1. Asia Pacific
- 5.4.2. North America
- 5.4.3. Europe
- 5.4.4. South America
- 5.4.5. Middle East and Africa
- 5.1. Market Analysis, Insights and Forecast - by Type
- 6. Global Biosolids Industry Analysis, Insights and Forecast, 2021-2033
- 6.1. Market Analysis, Insights and Forecast - by Type
- 6.1.1. Class A
- 6.1.2. Class A EQ (Exceptional Quality)
- 6.1.3. Class B
- 6.2. Market Analysis, Insights and Forecast - by Form
- 6.2.1. Cakes
- 6.2.2. Liquid
- 6.2.3. Pellet
- 6.3. Market Analysis, Insights and Forecast - by Application
- 6.3.1. Agriculture land Application
- 6.3.1.1. Fertiliz
- 6.3.1.2. Fertilizer for Animal Crop Production - Pastures
- 6.3.2. Non-agricultural Land Application
- 6.3.2.1. Forest Crops (Land Restoration and Forestry)
- 6.3.2.2. Land Reclamation (Roads and Urban Wetlands)
- 6.3.2.3. Reclaiming Mining Sites
- 6.3.2.4. Landscaping, Recreational Fields, and Domestic Use
- 6.3.3. Energy Recovery Energy Production
- 6.3.3.1. Heat Generation, Incineration, and Gasification
- 6.3.3.2. Oil and Cement Production
- 6.3.3.3. Commercial Uses
- 6.3.1. Agriculture land Application
- 6.1. Market Analysis, Insights and Forecast - by Type
- 7. Asia Pacific Biosolids Industry Analysis, Insights and Forecast, 2020-2032
- 7.1. Market Analysis, Insights and Forecast - by Type
- 7.1.1. Class A
- 7.1.2. Class A EQ (Exceptional Quality)
- 7.1.3. Class B
- 7.2. Market Analysis, Insights and Forecast - by Form
- 7.2.1. Cakes
- 7.2.2. Liquid
- 7.2.3. Pellet
- 7.3. Market Analysis, Insights and Forecast - by Application
- 7.3.1. Agriculture land Application
- 7.3.1.1. Fertiliz
- 7.3.1.2. Fertilizer for Animal Crop Production - Pastures
- 7.3.2. Non-agricultural Land Application
- 7.3.2.1. Forest Crops (Land Restoration and Forestry)
- 7.3.2.2. Land Reclamation (Roads and Urban Wetlands)
- 7.3.2.3. Reclaiming Mining Sites
- 7.3.2.4. Landscaping, Recreational Fields, and Domestic Use
- 7.3.3. Energy Recovery Energy Production
- 7.3.3.1. Heat Generation, Incineration, and Gasification
- 7.3.3.2. Oil and Cement Production
- 7.3.3.3. Commercial Uses
- 7.3.1. Agriculture land Application
- 7.1. Market Analysis, Insights and Forecast - by Type
- 8. North America Biosolids Industry Analysis, Insights and Forecast, 2020-2032
- 8.1. Market Analysis, Insights and Forecast - by Type
- 8.1.1. Class A
- 8.1.2. Class A EQ (Exceptional Quality)
- 8.1.3. Class B
- 8.2. Market Analysis, Insights and Forecast - by Form
- 8.2.1. Cakes
- 8.2.2. Liquid
- 8.2.3. Pellet
- 8.3. Market Analysis, Insights and Forecast - by Application
- 8.3.1. Agriculture land Application
- 8.3.1.1. Fertiliz
- 8.3.1.2. Fertilizer for Animal Crop Production - Pastures
- 8.3.2. Non-agricultural Land Application
- 8.3.2.1. Forest Crops (Land Restoration and Forestry)
- 8.3.2.2. Land Reclamation (Roads and Urban Wetlands)
- 8.3.2.3. Reclaiming Mining Sites
- 8.3.2.4. Landscaping, Recreational Fields, and Domestic Use
- 8.3.3. Energy Recovery Energy Production
- 8.3.3.1. Heat Generation, Incineration, and Gasification
- 8.3.3.2. Oil and Cement Production
- 8.3.3.3. Commercial Uses
- 8.3.1. Agriculture land Application
- 8.1. Market Analysis, Insights and Forecast - by Type
- 9. Europe Biosolids Industry Analysis, Insights and Forecast, 2020-2032
- 9.1. Market Analysis, Insights and Forecast - by Type
- 9.1.1. Class A
- 9.1.2. Class A EQ (Exceptional Quality)
- 9.1.3. Class B
- 9.2. Market Analysis, Insights and Forecast - by Form
- 9.2.1. Cakes
- 9.2.2. Liquid
- 9.2.3. Pellet
- 9.3. Market Analysis, Insights and Forecast - by Application
- 9.3.1. Agriculture land Application
- 9.3.1.1. Fertiliz
- 9.3.1.2. Fertilizer for Animal Crop Production - Pastures
- 9.3.2. Non-agricultural Land Application
- 9.3.2.1. Forest Crops (Land Restoration and Forestry)
- 9.3.2.2. Land Reclamation (Roads and Urban Wetlands)
- 9.3.2.3. Reclaiming Mining Sites
- 9.3.2.4. Landscaping, Recreational Fields, and Domestic Use
- 9.3.3. Energy Recovery Energy Production
- 9.3.3.1. Heat Generation, Incineration, and Gasification
- 9.3.3.2. Oil and Cement Production
- 9.3.3.3. Commercial Uses
- 9.3.1. Agriculture land Application
- 9.1. Market Analysis, Insights and Forecast - by Type
- 10. South America Biosolids Industry Analysis, Insights and Forecast, 2020-2032
- 10.1. Market Analysis, Insights and Forecast - by Type
- 10.1.1. Class A
- 10.1.2. Class A EQ (Exceptional Quality)
- 10.1.3. Class B
- 10.2. Market Analysis, Insights and Forecast - by Form
- 10.2.1. Cakes
- 10.2.2. Liquid
- 10.2.3. Pellet
- 10.3. Market Analysis, Insights and Forecast - by Application
- 10.3.1. Agriculture land Application
- 10.3.1.1. Fertiliz
- 10.3.1.2. Fertilizer for Animal Crop Production - Pastures
- 10.3.2. Non-agricultural Land Application
- 10.3.2.1. Forest Crops (Land Restoration and Forestry)
- 10.3.2.2. Land Reclamation (Roads and Urban Wetlands)
- 10.3.2.3. Reclaiming Mining Sites
- 10.3.2.4. Landscaping, Recreational Fields, and Domestic Use
- 10.3.3. Energy Recovery Energy Production
- 10.3.3.1. Heat Generation, Incineration, and Gasification
- 10.3.3.2. Oil and Cement Production
- 10.3.3.3. Commercial Uses
- 10.3.1. Agriculture land Application
- 10.1. Market Analysis, Insights and Forecast - by Type
- 11. Middle East and Africa Biosolids Industry Analysis, Insights and Forecast, 2020-2032
- 11.1. Market Analysis, Insights and Forecast - by Type
- 11.1.1. Class A
- 11.1.2. Class A EQ (Exceptional Quality)
- 11.1.3. Class B
- 11.2. Market Analysis, Insights and Forecast - by Form
- 11.2.1. Cakes
- 11.2.2. Liquid
- 11.2.3. Pellet
- 11.3. Market Analysis, Insights and Forecast - by Application
- 11.3.1. Agriculture land Application
- 11.3.1.1. Fertiliz
- 11.3.1.2. Fertilizer for Animal Crop Production - Pastures
- 11.3.2. Non-agricultural Land Application
- 11.3.2.1. Forest Crops (Land Restoration and Forestry)
- 11.3.2.2. Land Reclamation (Roads and Urban Wetlands)
- 11.3.2.3. Reclaiming Mining Sites
- 11.3.2.4. Landscaping, Recreational Fields, and Domestic Use
- 11.3.3. Energy Recovery Energy Production
- 11.3.3.1. Heat Generation, Incineration, and Gasification
- 11.3.3.2. Oil and Cement Production
- 11.3.3.3. Commercial Uses
- 11.3.1. Agriculture land Application
- 11.1. Market Analysis, Insights and Forecast - by Type
- 12. Competitive Analysis
- 12.1. Company Profiles
- 12.1.1 Walker Industries*List Not Exhaustive
- 12.1.1.1. Company Overview
- 12.1.1.2. Products
- 12.1.1.3. Company Financials
- 12.1.1.4. SWOT Analysis
- 12.1.2 Cambi ASA
- 12.1.2.1. Company Overview
- 12.1.2.2. Products
- 12.1.2.3. Company Financials
- 12.1.2.4. SWOT Analysis
- 12.1.3 Eco-trass
- 12.1.3.1. Company Overview
- 12.1.3.2. Products
- 12.1.3.3. Company Financials
- 12.1.3.4. SWOT Analysis
- 12.1.4 DC Water
- 12.1.4.1. Company Overview
- 12.1.4.2. Products
- 12.1.4.3. Company Financials
- 12.1.4.4. SWOT Analysis
- 12.1.5 Recyc Systems Inc
- 12.1.5.1. Company Overview
- 12.1.5.2. Products
- 12.1.5.3. Company Financials
- 12.1.5.4. SWOT Analysis
- 12.1.6 BCR Environmental
- 12.1.6.1. Company Overview
- 12.1.6.2. Products
- 12.1.6.3. Company Financials
- 12.1.6.4. SWOT Analysis
- 12.1.7 Aguas Andinas SA
- 12.1.7.1. Company Overview
- 12.1.7.2. Products
- 12.1.7.3. Company Financials
- 12.1.7.4. SWOT Analysis
- 12.1.8 Cleanaway
- 12.1.8.1. Company Overview
- 12.1.8.2. Products
- 12.1.8.3. Company Financials
- 12.1.8.4. SWOT Analysis
- 12.1.9 SYLVIS
- 12.1.9.1. Company Overview
- 12.1.9.2. Products
- 12.1.9.3. Company Financials
- 12.1.9.4. SWOT Analysis
- 12.1.10 Casella Waste Systems Inc
- 12.1.10.1. Company Overview
- 12.1.10.2. Products
- 12.1.10.3. Company Financials
- 12.1.10.4. SWOT Analysis
- 12.1.11 Englobe
- 12.1.11.1. Company Overview
- 12.1.11.2. Products
- 12.1.11.3. Company Financials
- 12.1.11.4. SWOT Analysis
- 12.1.12 Agrivert Ltd
- 12.1.12.1. Company Overview
- 12.1.12.2. Products
- 12.1.12.3. Company Financials
- 12.1.12.4. SWOT Analysis
- 12.1.13 Saur
- 12.1.13.1. Company Overview
- 12.1.13.2. Products
- 12.1.13.3. Company Financials
- 12.1.13.4. SWOT Analysis
- 12.1.14 Alan Srl
- 12.1.14.1. Company Overview
- 12.1.14.2. Products
- 12.1.14.3. Company Financials
- 12.1.14.4. SWOT Analysis
- 12.1.15 Lystek International
- 12.1.15.1. Company Overview
- 12.1.15.2. Products
- 12.1.15.3. Company Financials
- 12.1.15.4. SWOT Analysis
- 12.1.16 REMONDIS SE & Co KG
- 12.1.16.1. Company Overview
- 12.1.16.2. Products
- 12.1.16.3. Company Financials
- 12.1.16.4. SWOT Analysis
- 12.1.17 FCC Group
- 12.1.17.1. Company Overview
- 12.1.17.2. Products
- 12.1.17.3. Company Financials
- 12.1.17.4. SWOT Analysis
- 12.1.18 Synagro Technologies
- 12.1.18.1. Company Overview
- 12.1.18.2. Products
- 12.1.18.3. Company Financials
- 12.1.18.4. SWOT Analysis
- 12.1.19 C R E - Centro di Ricerche Ecologiche
- 12.1.19.1. Company Overview
- 12.1.19.2. Products
- 12.1.19.3. Company Financials
- 12.1.19.4. SWOT Analysis
- 12.1.20 Parker Ag Services LLC
- 12.1.20.1. Company Overview
- 12.1.20.2. Products
- 12.1.20.3. Company Financials
- 12.1.20.4. SWOT Analysis
- 12.1.21 Terrapure BR Ltd
- 12.1.21.1. Company Overview
- 12.1.21.2. Products
- 12.1.21.3. Company Financials
- 12.1.21.4. SWOT Analysis
- 12.1.22 Merrell Bros Inc
- 12.1.22.1. Company Overview
- 12.1.22.2. Products
- 12.1.22.3. Company Financials
- 12.1.22.4. SWOT Analysis
- 12.1.23 Allevi Srl
- 12.1.23.1. Company Overview
- 12.1.23.2. Products
- 12.1.23.3. Company Financials
- 12.1.23.4. SWOT Analysis
- 12.1.1 Walker Industries*List Not Exhaustive
- 12.2. Market Entropy
- 12.2.1 Company's Key Areas Served
- 12.2.2 Recent Developments
- 12.3. Company Market Share Analysis 2025
- 12.3.1 Top 5 Companies Market Share Analysis
- 12.3.2 Top 3 Companies Market Share Analysis
- 12.4. List of Potential Customers
- 13. Research Methodology
List of Figures
- Figure 1: Global Biosolids Industry Revenue Breakdown (Million, %) by Region 2025 & 2033
- Figure 2: Global Biosolids Industry Volume Breakdown (liter , %) by Region 2025 & 2033
- Figure 3: Asia Pacific Biosolids Industry Revenue (Million), by Type 2025 & 2033
- Figure 4: Asia Pacific Biosolids Industry Volume (liter ), by Type 2025 & 2033
- Figure 5: Asia Pacific Biosolids Industry Revenue Share (%), by Type 2025 & 2033
- Figure 6: Asia Pacific Biosolids Industry Volume Share (%), by Type 2025 & 2033
- Figure 7: Asia Pacific Biosolids Industry Revenue (Million), by Form 2025 & 2033
- Figure 8: Asia Pacific Biosolids Industry Volume (liter ), by Form 2025 & 2033
- Figure 9: Asia Pacific Biosolids Industry Revenue Share (%), by Form 2025 & 2033
- Figure 10: Asia Pacific Biosolids Industry Volume Share (%), by Form 2025 & 2033
- Figure 11: Asia Pacific Biosolids Industry Revenue (Million), by Application 2025 & 2033
- Figure 12: Asia Pacific Biosolids Industry Volume (liter ), by Application 2025 & 2033
- Figure 13: Asia Pacific Biosolids Industry Revenue Share (%), by Application 2025 & 2033
- Figure 14: Asia Pacific Biosolids Industry Volume Share (%), by Application 2025 & 2033
- Figure 15: Asia Pacific Biosolids Industry Revenue (Million), by Country 2025 & 2033
- Figure 16: Asia Pacific Biosolids Industry Volume (liter ), by Country 2025 & 2033
- Figure 17: Asia Pacific Biosolids Industry Revenue Share (%), by Country 2025 & 2033
- Figure 18: Asia Pacific Biosolids Industry Volume Share (%), by Country 2025 & 2033
- Figure 19: North America Biosolids Industry Revenue (Million), by Type 2025 & 2033
- Figure 20: North America Biosolids Industry Volume (liter ), by Type 2025 & 2033
- Figure 21: North America Biosolids Industry Revenue Share (%), by Type 2025 & 2033
- Figure 22: North America Biosolids Industry Volume Share (%), by Type 2025 & 2033
- Figure 23: North America Biosolids Industry Revenue (Million), by Form 2025 & 2033
- Figure 24: North America Biosolids Industry Volume (liter ), by Form 2025 & 2033
- Figure 25: North America Biosolids Industry Revenue Share (%), by Form 2025 & 2033
- Figure 26: North America Biosolids Industry Volume Share (%), by Form 2025 & 2033
- Figure 27: North America Biosolids Industry Revenue (Million), by Application 2025 & 2033
- Figure 28: North America Biosolids Industry Volume (liter ), by Application 2025 & 2033
- Figure 29: North America Biosolids Industry Revenue Share (%), by Application 2025 & 2033
- Figure 30: North America Biosolids Industry Volume Share (%), by Application 2025 & 2033
- Figure 31: North America Biosolids Industry Revenue (Million), by Country 2025 & 2033
- Figure 32: North America Biosolids Industry Volume (liter ), by Country 2025 & 2033
- Figure 33: North America Biosolids Industry Revenue Share (%), by Country 2025 & 2033
- Figure 34: North America Biosolids Industry Volume Share (%), by Country 2025 & 2033
- Figure 35: Europe Biosolids Industry Revenue (Million), by Type 2025 & 2033
- Figure 36: Europe Biosolids Industry Volume (liter ), by Type 2025 & 2033
- Figure 37: Europe Biosolids Industry Revenue Share (%), by Type 2025 & 2033
- Figure 38: Europe Biosolids Industry Volume Share (%), by Type 2025 & 2033
- Figure 39: Europe Biosolids Industry Revenue (Million), by Form 2025 & 2033
- Figure 40: Europe Biosolids Industry Volume (liter ), by Form 2025 & 2033
- Figure 41: Europe Biosolids Industry Revenue Share (%), by Form 2025 & 2033
- Figure 42: Europe Biosolids Industry Volume Share (%), by Form 2025 & 2033
- Figure 43: Europe Biosolids Industry Revenue (Million), by Application 2025 & 2033
- Figure 44: Europe Biosolids Industry Volume (liter ), by Application 2025 & 2033
- Figure 45: Europe Biosolids Industry Revenue Share (%), by Application 2025 & 2033
- Figure 46: Europe Biosolids Industry Volume Share (%), by Application 2025 & 2033
- Figure 47: Europe Biosolids Industry Revenue (Million), by Country 2025 & 2033
- Figure 48: Europe Biosolids Industry Volume (liter ), by Country 2025 & 2033
- Figure 49: Europe Biosolids Industry Revenue Share (%), by Country 2025 & 2033
- Figure 50: Europe Biosolids Industry Volume Share (%), by Country 2025 & 2033
- Figure 51: South America Biosolids Industry Revenue (Million), by Type 2025 & 2033
- Figure 52: South America Biosolids Industry Volume (liter ), by Type 2025 & 2033
- Figure 53: South America Biosolids Industry Revenue Share (%), by Type 2025 & 2033
- Figure 54: South America Biosolids Industry Volume Share (%), by Type 2025 & 2033
- Figure 55: South America Biosolids Industry Revenue (Million), by Form 2025 & 2033
- Figure 56: South America Biosolids Industry Volume (liter ), by Form 2025 & 2033
- Figure 57: South America Biosolids Industry Revenue Share (%), by Form 2025 & 2033
- Figure 58: South America Biosolids Industry Volume Share (%), by Form 2025 & 2033
- Figure 59: South America Biosolids Industry Revenue (Million), by Application 2025 & 2033
- Figure 60: South America Biosolids Industry Volume (liter ), by Application 2025 & 2033
- Figure 61: South America Biosolids Industry Revenue Share (%), by Application 2025 & 2033
- Figure 62: South America Biosolids Industry Volume Share (%), by Application 2025 & 2033
- Figure 63: South America Biosolids Industry Revenue (Million), by Country 2025 & 2033
- Figure 64: South America Biosolids Industry Volume (liter ), by Country 2025 & 2033
- Figure 65: South America Biosolids Industry Revenue Share (%), by Country 2025 & 2033
- Figure 66: South America Biosolids Industry Volume Share (%), by Country 2025 & 2033
- Figure 67: Middle East and Africa Biosolids Industry Revenue (Million), by Type 2025 & 2033
- Figure 68: Middle East and Africa Biosolids Industry Volume (liter ), by Type 2025 & 2033
- Figure 69: Middle East and Africa Biosolids Industry Revenue Share (%), by Type 2025 & 2033
- Figure 70: Middle East and Africa Biosolids Industry Volume Share (%), by Type 2025 & 2033
- Figure 71: Middle East and Africa Biosolids Industry Revenue (Million), by Form 2025 & 2033
- Figure 72: Middle East and Africa Biosolids Industry Volume (liter ), by Form 2025 & 2033
- Figure 73: Middle East and Africa Biosolids Industry Revenue Share (%), by Form 2025 & 2033
- Figure 74: Middle East and Africa Biosolids Industry Volume Share (%), by Form 2025 & 2033
- Figure 75: Middle East and Africa Biosolids Industry Revenue (Million), by Application 2025 & 2033
- Figure 76: Middle East and Africa Biosolids Industry Volume (liter ), by Application 2025 & 2033
- Figure 77: Middle East and Africa Biosolids Industry Revenue Share (%), by Application 2025 & 2033
- Figure 78: Middle East and Africa Biosolids Industry Volume Share (%), by Application 2025 & 2033
- Figure 79: Middle East and Africa Biosolids Industry Revenue (Million), by Country 2025 & 2033
- Figure 80: Middle East and Africa Biosolids Industry Volume (liter ), by Country 2025 & 2033
- Figure 81: Middle East and Africa Biosolids Industry Revenue Share (%), by Country 2025 & 2033
- Figure 82: Middle East and Africa Biosolids Industry Volume Share (%), by Country 2025 & 2033
List of Tables
- Table 1: Global Biosolids Industry Revenue Million Forecast, by Type 2020 & 2033
- Table 2: Global Biosolids Industry Volume liter Forecast, by Type 2020 & 2033
- Table 3: Global Biosolids Industry Revenue Million Forecast, by Form 2020 & 2033
- Table 4: Global Biosolids Industry Volume liter Forecast, by Form 2020 & 2033
- Table 5: Global Biosolids Industry Revenue Million Forecast, by Application 2020 & 2033
- Table 6: Global Biosolids Industry Volume liter Forecast, by Application 2020 & 2033
- Table 7: Global Biosolids Industry Revenue Million Forecast, by Region 2020 & 2033
- Table 8: Global Biosolids Industry Volume liter Forecast, by Region 2020 & 2033
- Table 9: Global Biosolids Industry Revenue Million Forecast, by Type 2020 & 2033
- Table 10: Global Biosolids Industry Volume liter Forecast, by Type 2020 & 2033
- Table 11: Global Biosolids Industry Revenue Million Forecast, by Form 2020 & 2033
- Table 12: Global Biosolids Industry Volume liter Forecast, by Form 2020 & 2033
- Table 13: Global Biosolids Industry Revenue Million Forecast, by Application 2020 & 2033
- Table 14: Global Biosolids Industry Volume liter Forecast, by Application 2020 & 2033
- Table 15: Global Biosolids Industry Revenue Million Forecast, by Country 2020 & 2033
- Table 16: Global Biosolids Industry Volume liter Forecast, by Country 2020 & 2033
- Table 17: China Biosolids Industry Revenue (Million) Forecast, by Application 2020 & 2033
- Table 18: China Biosolids Industry Volume (liter ) Forecast, by Application 2020 & 2033
- Table 19: India Biosolids Industry Revenue (Million) Forecast, by Application 2020 & 2033
- Table 20: India Biosolids Industry Volume (liter ) Forecast, by Application 2020 & 2033
- Table 21: Japan Biosolids Industry Revenue (Million) Forecast, by Application 2020 & 2033
- Table 22: Japan Biosolids Industry Volume (liter ) Forecast, by Application 2020 & 2033
- Table 23: South Korea Biosolids Industry Revenue (Million) Forecast, by Application 2020 & 2033
- Table 24: South Korea Biosolids Industry Volume (liter ) Forecast, by Application 2020 & 2033
- Table 25: Malaysia Biosolids Industry Revenue (Million) Forecast, by Application 2020 & 2033
- Table 26: Malaysia Biosolids Industry Volume (liter ) Forecast, by Application 2020 & 2033
- Table 27: Thailand Biosolids Industry Revenue (Million) Forecast, by Application 2020 & 2033
- Table 28: Thailand Biosolids Industry Volume (liter ) Forecast, by Application 2020 & 2033
- Table 29: Indonesia Biosolids Industry Revenue (Million) Forecast, by Application 2020 & 2033
- Table 30: Indonesia Biosolids Industry Volume (liter ) Forecast, by Application 2020 & 2033
- Table 31: Vietnam Biosolids Industry Revenue (Million) Forecast, by Application 2020 & 2033
- Table 32: Vietnam Biosolids Industry Volume (liter ) Forecast, by Application 2020 & 2033
- Table 33: Rest of Asia Pacific Biosolids Industry Revenue (Million) Forecast, by Application 2020 & 2033
- Table 34: Rest of Asia Pacific Biosolids Industry Volume (liter ) Forecast, by Application 2020 & 2033
- Table 35: Global Biosolids Industry Revenue Million Forecast, by Type 2020 & 2033
- Table 36: Global Biosolids Industry Volume liter Forecast, by Type 2020 & 2033
- Table 37: Global Biosolids Industry Revenue Million Forecast, by Form 2020 & 2033
- Table 38: Global Biosolids Industry Volume liter Forecast, by Form 2020 & 2033
- Table 39: Global Biosolids Industry Revenue Million Forecast, by Application 2020 & 2033
- Table 40: Global Biosolids Industry Volume liter Forecast, by Application 2020 & 2033
- Table 41: Global Biosolids Industry Revenue Million Forecast, by Country 2020 & 2033
- Table 42: Global Biosolids Industry Volume liter Forecast, by Country 2020 & 2033
- Table 43: United States Biosolids Industry Revenue (Million) Forecast, by Application 2020 & 2033
- Table 44: United States Biosolids Industry Volume (liter ) Forecast, by Application 2020 & 2033
- Table 45: Canada Biosolids Industry Revenue (Million) Forecast, by Application 2020 & 2033
- Table 46: Canada Biosolids Industry Volume (liter ) Forecast, by Application 2020 & 2033
- Table 47: Mexico Biosolids Industry Revenue (Million) Forecast, by Application 2020 & 2033
- Table 48: Mexico Biosolids Industry Volume (liter ) Forecast, by Application 2020 & 2033
- Table 49: Global Biosolids Industry Revenue Million Forecast, by Type 2020 & 2033
- Table 50: Global Biosolids Industry Volume liter Forecast, by Type 2020 & 2033
- Table 51: Global Biosolids Industry Revenue Million Forecast, by Form 2020 & 2033
- Table 52: Global Biosolids Industry Volume liter Forecast, by Form 2020 & 2033
- Table 53: Global Biosolids Industry Revenue Million Forecast, by Application 2020 & 2033
- Table 54: Global Biosolids Industry Volume liter Forecast, by Application 2020 & 2033
- Table 55: Global Biosolids Industry Revenue Million Forecast, by Country 2020 & 2033
- Table 56: Global Biosolids Industry Volume liter Forecast, by Country 2020 & 2033
- Table 57: Germany Biosolids Industry Revenue (Million) Forecast, by Application 2020 & 2033
- Table 58: Germany Biosolids Industry Volume (liter ) Forecast, by Application 2020 & 2033
- Table 59: United Kingdom Biosolids Industry Revenue (Million) Forecast, by Application 2020 & 2033
- Table 60: United Kingdom Biosolids Industry Volume (liter ) Forecast, by Application 2020 & 2033
- Table 61: Italy Biosolids Industry Revenue (Million) Forecast, by Application 2020 & 2033
- Table 62: Italy Biosolids Industry Volume (liter ) Forecast, by Application 2020 & 2033
- Table 63: France Biosolids Industry Revenue (Million) Forecast, by Application 2020 & 2033
- Table 64: France Biosolids Industry Volume (liter ) Forecast, by Application 2020 & 2033
- Table 65: Spain Biosolids Industry Revenue (Million) Forecast, by Application 2020 & 2033
- Table 66: Spain Biosolids Industry Volume (liter ) Forecast, by Application 2020 & 2033
- Table 67: NORDIC Biosolids Industry Revenue (Million) Forecast, by Application 2020 & 2033
- Table 68: NORDIC Biosolids Industry Volume (liter ) Forecast, by Application 2020 & 2033
- Table 69: Turkey Biosolids Industry Revenue (Million) Forecast, by Application 2020 & 2033
- Table 70: Turkey Biosolids Industry Volume (liter ) Forecast, by Application 2020 & 2033
- Table 71: Russia Biosolids Industry Revenue (Million) Forecast, by Application 2020 & 2033
- Table 72: Russia Biosolids Industry Volume (liter ) Forecast, by Application 2020 & 2033
- Table 73: Rest of Europe Biosolids Industry Revenue (Million) Forecast, by Application 2020 & 2033
- Table 74: Rest of Europe Biosolids Industry Volume (liter ) Forecast, by Application 2020 & 2033
- Table 75: Global Biosolids Industry Revenue Million Forecast, by Type 2020 & 2033
- Table 76: Global Biosolids Industry Volume liter Forecast, by Type 2020 & 2033
- Table 77: Global Biosolids Industry Revenue Million Forecast, by Form 2020 & 2033
- Table 78: Global Biosolids Industry Volume liter Forecast, by Form 2020 & 2033
- Table 79: Global Biosolids Industry Revenue Million Forecast, by Application 2020 & 2033
- Table 80: Global Biosolids Industry Volume liter Forecast, by Application 2020 & 2033
- Table 81: Global Biosolids Industry Revenue Million Forecast, by Country 2020 & 2033
- Table 82: Global Biosolids Industry Volume liter Forecast, by Country 2020 & 2033
- Table 83: Brazil Biosolids Industry Revenue (Million) Forecast, by Application 2020 & 2033
- Table 84: Brazil Biosolids Industry Volume (liter ) Forecast, by Application 2020 & 2033
- Table 85: Argentina Biosolids Industry Revenue (Million) Forecast, by Application 2020 & 2033
- Table 86: Argentina Biosolids Industry Volume (liter ) Forecast, by Application 2020 & 2033
- Table 87: Colombia Biosolids Industry Revenue (Million) Forecast, by Application 2020 & 2033
- Table 88: Colombia Biosolids Industry Volume (liter ) Forecast, by Application 2020 & 2033
- Table 89: Rest of South America Biosolids Industry Revenue (Million) Forecast, by Application 2020 & 2033
- Table 90: Rest of South America Biosolids Industry Volume (liter ) Forecast, by Application 2020 & 2033
- Table 91: Global Biosolids Industry Revenue Million Forecast, by Type 2020 & 2033
- Table 92: Global Biosolids Industry Volume liter Forecast, by Type 2020 & 2033
- Table 93: Global Biosolids Industry Revenue Million Forecast, by Form 2020 & 2033
- Table 94: Global Biosolids Industry Volume liter Forecast, by Form 2020 & 2033
- Table 95: Global Biosolids Industry Revenue Million Forecast, by Application 2020 & 2033
- Table 96: Global Biosolids Industry Volume liter Forecast, by Application 2020 & 2033
- Table 97: Global Biosolids Industry Revenue Million Forecast, by Country 2020 & 2033
- Table 98: Global Biosolids Industry Volume liter Forecast, by Country 2020 & 2033
- Table 99: Saudi Arabia Biosolids Industry Revenue (Million) Forecast, by Application 2020 & 2033
- Table 100: Saudi Arabia Biosolids Industry Volume (liter ) Forecast, by Application 2020 & 2033
- Table 101: South Africa Biosolids Industry Revenue (Million) Forecast, by Application 2020 & 2033
- Table 102: South Africa Biosolids Industry Volume (liter ) Forecast, by Application 2020 & 2033
- Table 103: Nigeria Biosolids Industry Revenue (Million) Forecast, by Application 2020 & 2033
- Table 104: Nigeria Biosolids Industry Volume (liter ) Forecast, by Application 2020 & 2033
- Table 105: Qatar Biosolids Industry Revenue (Million) Forecast, by Application 2020 & 2033
- Table 106: Qatar Biosolids Industry Volume (liter ) Forecast, by Application 2020 & 2033
- Table 107: Egypt Biosolids Industry Revenue (Million) Forecast, by Application 2020 & 2033
- Table 108: Egypt Biosolids Industry Volume (liter ) Forecast, by Application 2020 & 2033
- Table 109: United Arab Emirates Biosolids Industry Revenue (Million) Forecast, by Application 2020 & 2033
- Table 110: United Arab Emirates Biosolids Industry Volume (liter ) Forecast, by Application 2020 & 2033
- Table 111: Rest of Middle East and Africa Biosolids Industry Revenue (Million) Forecast, by Application 2020 & 2033
- Table 112: Rest of Middle East and Africa Biosolids Industry Volume (liter ) Forecast, by Application 2020 & 2033
Frequently Asked Questions
1. What is the projected Compound Annual Growth Rate (CAGR) of the Biosolids Industry?
The projected CAGR is approximately > 3.50%.
2. Which companies are prominent players in the Biosolids Industry?
Key companies in the market include Walker Industries*List Not Exhaustive, Cambi ASA, Eco-trass, DC Water, Recyc Systems Inc, BCR Environmental, Aguas Andinas SA, Cleanaway, SYLVIS, Casella Waste Systems Inc, Englobe, Agrivert Ltd, Saur, Alan Srl, Lystek International, REMONDIS SE & Co KG, FCC Group, Synagro Technologies, C R E - Centro di Ricerche Ecologiche, Parker Ag Services LLC, Terrapure BR Ltd, Merrell Bros Inc, Allevi Srl.
3. What are the main segments of the Biosolids Industry?
The market segments include Type, Form, Application.
4. Can you provide details about the market size?
The market size is estimated to be USD 1700 Million as of 2022.
5. What are some drivers contributing to market growth?
Replacing Hazardous Chemical Fertilizers in North America; Stringent Government Emission Laws; Other Drivers.
6. What are the notable trends driving market growth?
Agricultural Land Application to Dominate the Market.
7. Are there any restraints impacting market growth?
Lack of Proper Knowledge and Awareness on Biosolids; Other Restraints.
8. Can you provide examples of recent developments in the market?
January 2023: Synagro Technologies Inc., a provider of biosolids and residual solutions, acquired Burch Hydro Inc., an Ohio-based premier provider of biosolids and lime-residuals management and land application.
9. What pricing options are available for accessing the report?
Pricing options include single-user, multi-user, and enterprise licenses priced at USD 4750, USD 5250, and USD 8750 respectively.
10. Is the market size provided in terms of value or volume?
The market size is provided in terms of value, measured in Million and volume, measured in liter .
11. Are there any specific market keywords associated with the report?
Yes, the market keyword associated with the report is "Biosolids Industry," which aids in identifying and referencing the specific market segment covered.
12. How do I determine which pricing option suits my needs best?
The pricing options vary based on user requirements and access needs. Individual users may opt for single-user licenses, while businesses requiring broader access may choose multi-user or enterprise licenses for cost-effective access to the report.
13. Are there any additional resources or data provided in the Biosolids Industry report?
While the report offers comprehensive insights, it's advisable to review the specific contents or supplementary materials provided to ascertain if additional resources or data are available.
14. How can I stay updated on further developments or reports in the Biosolids Industry?
To stay informed about further developments, trends, and reports in the Biosolids Industry, consider subscribing to industry newsletters, following relevant companies and organizations, or regularly checking reputable industry news sources and publications.
Methodology
Step 1 - Identification of Relevant Samples Size from Population Database


Step 2 - Approaches for Defining Global Market Size (Value, Volume* & Price*)

Note*: In applicable scenarios
Step 3 - Data Sources
Primary Research
- Web Analytics
- Survey Reports
- Research Institute
- Latest Research Reports
- Opinion Leaders
Secondary Research
- Annual Reports
- White Paper
- Latest Press Release
- Industry Association
- Paid Database
- Investor Presentations

Step 4 - Data Triangulation
Involves using different sources of information in order to increase the validity of a study
These sources are likely to be stakeholders in a program - participants, other researchers, program staff, other community members, and so on.
Then we put all data in single framework & apply various statistical tools to find out the dynamic on the market.
During the analysis stage, feedback from the stakeholder groups would be compared to determine areas of agreement as well as areas of divergence