

Key Insights
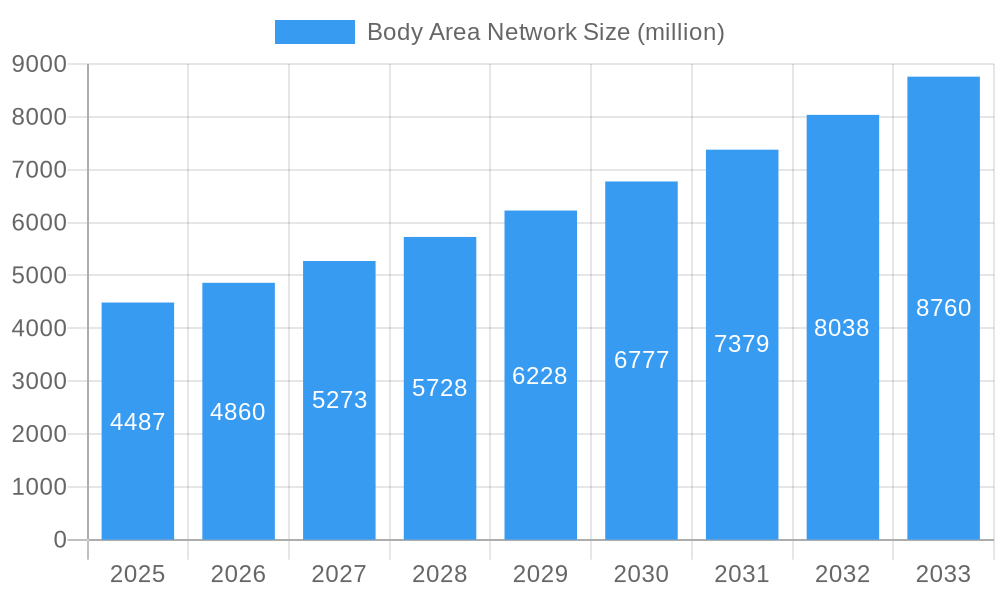
The Body Area Network (BAN) market, currently valued at approximately $4.49 billion in 2025, is projected to experience robust growth, with a compound annual growth rate (CAGR) of 8.3% from 2025 to 2033. This expansion is driven by several key factors. The increasing prevalence of chronic diseases necessitates continuous health monitoring, fueling demand for wearable BAN devices. Advancements in miniaturized sensors, low-power communication technologies like Bluetooth Low Energy (BLE), and improved data analytics capabilities are enabling more sophisticated and user-friendly BAN applications. Furthermore, the rising adoption of telehealth and remote patient monitoring solutions is significantly contributing to market growth, as BANs facilitate seamless data transmission for timely interventions. The integration of BANs with smartphones and cloud platforms enhances data accessibility and facilitates better healthcare management. Major players like Fujitsu, Intel, and Renesas are investing heavily in research and development, further accelerating market expansion.
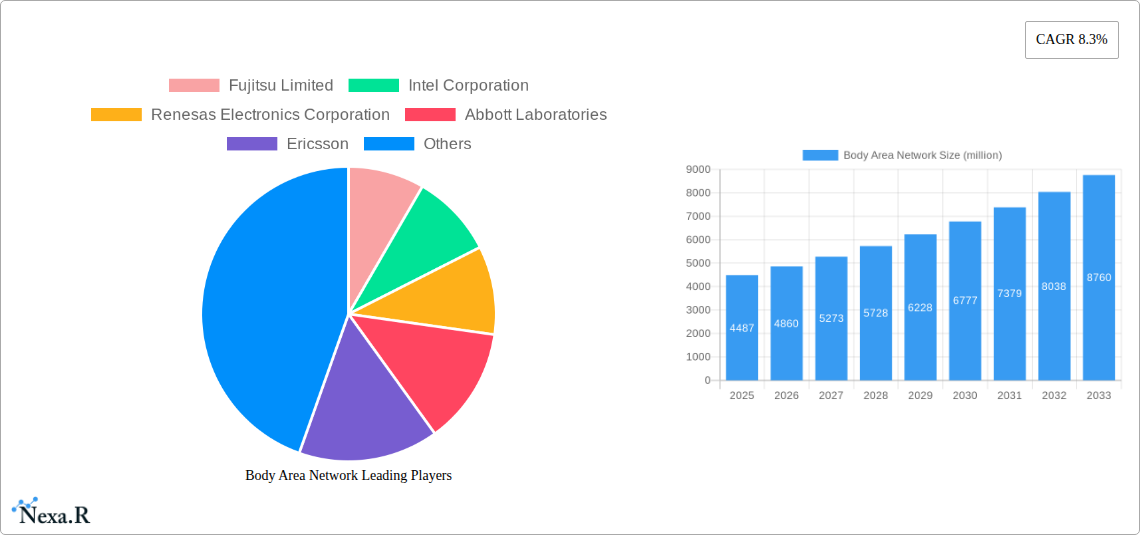
Body Area Network Market Size (In Billion)
However, challenges remain. Concerns regarding data privacy and security are paramount, particularly given the sensitive nature of health information transmitted via BANs. High initial investment costs for deploying sophisticated BAN infrastructure and the need for robust regulatory frameworks to ensure data protection could potentially restrain market growth. Nevertheless, ongoing technological improvements, coupled with increasing awareness of the benefits of continuous health monitoring, are expected to outweigh these challenges, propelling the BAN market towards significant expansion throughout the forecast period. The segmentation of the market (while not explicitly provided) likely encompasses various device types (e.g., implantable sensors, wearable patches), application areas (e.g., cardiac monitoring, diabetes management, neurological monitoring), and communication protocols. This diversification is expected to drive further specialization and innovation within the BAN ecosystem.
Body Area Network Company Market Share
Body Area Network (BAN) Market Report: 2019-2033
This comprehensive report provides an in-depth analysis of the Body Area Network (BAN) market, encompassing market dynamics, growth trends, regional segmentation, product landscape, key players, and future outlook. The report covers the historical period (2019-2024), base year (2025), and forecast period (2025-2033), offering valuable insights for industry professionals, investors, and strategic decision-makers in the healthcare, consumer electronics, and telecommunications sectors (parent markets) and wearable technology, medical devices, and smart home automation (child markets). The global BAN market is projected to reach xx million units by 2033.
Body Area Network Market Dynamics & Structure
This section analyzes the BAN market's structure, identifying key trends driving growth and challenges hindering expansion. We examine market concentration, technological advancements, regulatory landscapes, competitive substitutions, end-user demographics, and mergers & acquisitions (M&A) activities.
- Market Concentration: The market exhibits a moderately concentrated structure, with a few major players holding significant market share. We estimate that the top 5 players hold approximately xx% of the market share in 2025.
- Technological Innovation: Advancements in low-power wide-area networks (LPWAN), miniaturization of sensors, and improved data processing capabilities are significant drivers. The development of advanced materials for flexible and implantable sensors is also crucial.
- Regulatory Frameworks: Stringent regulations regarding data privacy and security in healthcare applications significantly impact market growth. Compliance with HIPAA and GDPR standards is paramount.
- Competitive Substitutes: The emergence of alternative technologies such as IoT devices with similar functionalities presents a competitive challenge to the growth of BANs.
- End-User Demographics: The growing aging population and rising prevalence of chronic diseases are boosting demand for BAN-based healthcare solutions.
- M&A Trends: The BAN market has witnessed a moderate number of M&A deals in recent years (approximately xx deals between 2019-2024), driven by the need for technological expansion and market consolidation.
The integration of BAN technologies into other wearable devices is expected to be a key growth driver. However, concerns around battery life, data security, and interoperability remain key barriers to widespread adoption. Further, the high initial investment costs for developing BAN solutions can pose a significant challenge for smaller companies.
Body Area Network Growth Trends & Insights
The BAN market demonstrates substantial growth potential, driven by technological advancements and increasing demand across diverse applications. Utilizing various analytical methodologies, our report projects a Compound Annual Growth Rate (CAGR) of xx% during the forecast period (2025-2033), resulting in a market size of xx million units by 2033. Market penetration is expected to increase from xx% in 2025 to xx% by 2033. This growth is fueled by increasing adoption in healthcare monitoring, sports and fitness tracking, and industrial applications. Technological disruptions like the development of energy-harvesting devices and improved sensor integration are significantly boosting market expansion. Changing consumer behavior towards health and wellness, coupled with increased access to healthcare information, also contributes to this growth.
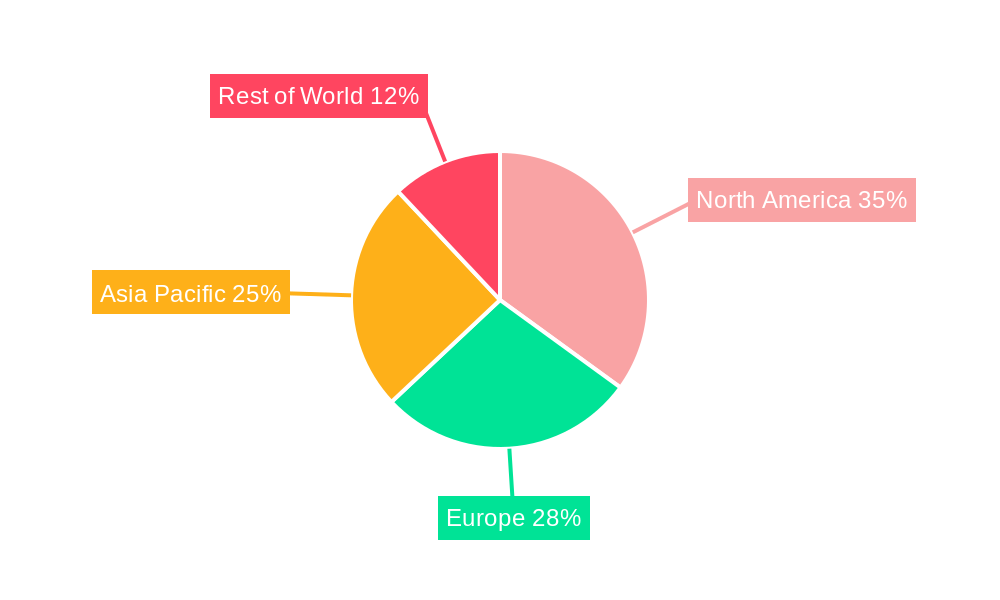
Dominant Regions, Countries, or Segments in Body Area Network
North America currently holds the largest market share in the BAN market, driven by the high adoption rate of advanced medical devices and strong regulatory support. However, Asia-Pacific is expected to witness the fastest growth rate during the forecast period, primarily due to rising disposable incomes, improving healthcare infrastructure, and increasing awareness of health and wellness.
- North America: Strong regulatory framework, advanced healthcare infrastructure, and early adoption of new technologies contribute to market dominance.
- Europe: Growing demand for remote patient monitoring and increasing investment in healthcare technologies fuel market growth.
- Asia-Pacific: Rapid economic growth, rising disposable incomes, and increasing prevalence of chronic diseases are key growth drivers.
Body Area Network Product Landscape
The BAN market encompasses a variety of products, including implantable sensors, wearable devices, and data processing units. Recent product innovations focus on miniaturization, enhanced battery life, and improved data security. Key performance metrics include data transmission rate, power consumption, and sensor accuracy. Unique selling propositions often revolve around improved comfort, enhanced data analytics, and seamless integration with other healthcare systems. Technological advancements such as the utilization of AI and machine learning for data analysis are further driving product innovation.
Key Drivers, Barriers & Challenges in Body Area Network
Key Drivers:
- Advancements in sensor technology, enabling smaller, more efficient devices.
- Growing demand for remote patient monitoring and telehealth solutions.
- Increasing investment in the development of new BAN applications.
- Growing awareness of the benefits of continuous health monitoring.
Key Barriers & Challenges:
- High initial investment costs for developing and deploying BAN solutions.
- Concerns over data privacy and security, especially in sensitive healthcare applications.
- Interoperability issues between different BAN devices and systems.
- Regulatory hurdles and compliance requirements in different regions. These regulatory hurdles are estimated to cost the industry xx million units in lost revenue annually.
Emerging Opportunities in Body Area Network
The BAN market offers significant opportunities in untapped markets, such as developing countries with limited healthcare access. Innovative applications, such as integrating BAN technology into smart clothing and assistive devices, present further potential. Evolving consumer preferences towards personalized health monitoring and convenient access to healthcare information further fuels these opportunities.
Growth Accelerators in the Body Area Network Industry
Technological breakthroughs in low-power consumption chips and advanced materials are key catalysts. Strategic partnerships between technology providers, healthcare providers, and insurance companies accelerate market growth. Expansion into new geographical markets, particularly developing economies, presents substantial growth opportunities.
Key Players Shaping the Body Area Network Market
Notable Milestones in Body Area Network Sector
- 2020, Q4: Abbott Laboratories launches a new continuous glucose monitoring system integrating BAN technology.
- 2021, Q2: Intel Corporation announces a new low-power chip designed specifically for BAN applications.
- 2022, Q3: A significant merger between two key players in the BAN market expands market share and capabilities.
- 2023, Q1: Bluetooth SIG releases new specifications enhancing the interoperability of BAN devices.
In-Depth Body Area Network Market Outlook
The BAN market is poised for substantial growth over the coming decade, driven by technological innovation, increasing demand for remote healthcare solutions, and expansion into new applications. Strategic partnerships and investments in research and development will further accelerate this growth. Companies focusing on developing energy-efficient devices, enhanced data security features, and seamless integration with existing healthcare systems will be well-positioned to capitalize on emerging market opportunities. The market is expected to continue its robust expansion, creating significant value for stakeholders in the years to come.
Body Area Network Segmentation
-
1. Application
- 1.1. Healthcare
- 1.2. Sports
- 1.3. Others
-
2. Type
- 2.1. Wearable Devices
- 2.2. Implant Devices
Body Area Network Segmentation By Geography
-
1. North America
- 1.1. United States
- 1.2. Canada
- 1.3. Mexico
-
2. South America
- 2.1. Brazil
- 2.2. Argentina
- 2.3. Rest of South America
-
3. Europe
- 3.1. United Kingdom
- 3.2. Germany
- 3.3. France
- 3.4. Italy
- 3.5. Spain
- 3.6. Russia
- 3.7. Benelux
- 3.8. Nordics
- 3.9. Rest of Europe
-
4. Middle East & Africa
- 4.1. Turkey
- 4.2. Israel
- 4.3. GCC
- 4.4. North Africa
- 4.5. South Africa
- 4.6. Rest of Middle East & Africa
-
5. Asia Pacific
- 5.1. China
- 5.2. India
- 5.3. Japan
- 5.4. South Korea
- 5.5. ASEAN
- 5.6. Oceania
- 5.7. Rest of Asia Pacific
Body Area Network Regional Market Share
Geographic Coverage of Body Area Network
Body Area Network REPORT HIGHLIGHTS
| Aspects | Details |
|---|---|
| Study Period | 2020-2034 |
| Base Year | 2025 |
| Estimated Year | 2026 |
| Forecast Period | 2026-2034 |
| Historical Period | 2020-2025 |
| Growth Rate | CAGR of 11.59% from 2020-2034 |
| Segmentation |
|
Table of Contents
- 1. Introduction
- 1.1. Research Scope
- 1.2. Market Segmentation
- 1.3. Research Methodology
- 1.4. Definitions and Assumptions
- 2. Executive Summary
- 2.1. Introduction
- 3. Market Dynamics
- 3.1. Introduction
- 3.2. Market Drivers
- 3.3. Market Restrains
- 3.4. Market Trends
- 4. Market Factor Analysis
- 4.1. Porters Five Forces
- 4.2. Supply/Value Chain
- 4.3. PESTEL analysis
- 4.4. Market Entropy
- 4.5. Patent/Trademark Analysis
- 5. Global Body Area Network Analysis, Insights and Forecast, 2020-2032
- 5.1. Market Analysis, Insights and Forecast - by Application
- 5.1.1. Healthcare
- 5.1.2. Sports
- 5.1.3. Others
- 5.2. Market Analysis, Insights and Forecast - by Type
- 5.2.1. Wearable Devices
- 5.2.2. Implant Devices
- 5.3. Market Analysis, Insights and Forecast - by Region
- 5.3.1. North America
- 5.3.2. South America
- 5.3.3. Europe
- 5.3.4. Middle East & Africa
- 5.3.5. Asia Pacific
- 5.1. Market Analysis, Insights and Forecast - by Application
- 6. North America Body Area Network Analysis, Insights and Forecast, 2020-2032
- 6.1. Market Analysis, Insights and Forecast - by Application
- 6.1.1. Healthcare
- 6.1.2. Sports
- 6.1.3. Others
- 6.2. Market Analysis, Insights and Forecast - by Type
- 6.2.1. Wearable Devices
- 6.2.2. Implant Devices
- 6.1. Market Analysis, Insights and Forecast - by Application
- 7. South America Body Area Network Analysis, Insights and Forecast, 2020-2032
- 7.1. Market Analysis, Insights and Forecast - by Application
- 7.1.1. Healthcare
- 7.1.2. Sports
- 7.1.3. Others
- 7.2. Market Analysis, Insights and Forecast - by Type
- 7.2.1. Wearable Devices
- 7.2.2. Implant Devices
- 7.1. Market Analysis, Insights and Forecast - by Application
- 8. Europe Body Area Network Analysis, Insights and Forecast, 2020-2032
- 8.1. Market Analysis, Insights and Forecast - by Application
- 8.1.1. Healthcare
- 8.1.2. Sports
- 8.1.3. Others
- 8.2. Market Analysis, Insights and Forecast - by Type
- 8.2.1. Wearable Devices
- 8.2.2. Implant Devices
- 8.1. Market Analysis, Insights and Forecast - by Application
- 9. Middle East & Africa Body Area Network Analysis, Insights and Forecast, 2020-2032
- 9.1. Market Analysis, Insights and Forecast - by Application
- 9.1.1. Healthcare
- 9.1.2. Sports
- 9.1.3. Others
- 9.2. Market Analysis, Insights and Forecast - by Type
- 9.2.1. Wearable Devices
- 9.2.2. Implant Devices
- 9.1. Market Analysis, Insights and Forecast - by Application
- 10. Asia Pacific Body Area Network Analysis, Insights and Forecast, 2020-2032
- 10.1. Market Analysis, Insights and Forecast - by Application
- 10.1.1. Healthcare
- 10.1.2. Sports
- 10.1.3. Others
- 10.2. Market Analysis, Insights and Forecast - by Type
- 10.2.1. Wearable Devices
- 10.2.2. Implant Devices
- 10.1. Market Analysis, Insights and Forecast - by Application
- 11. Competitive Analysis
- 11.1. Global Market Share Analysis 2025
- 11.2. Company Profiles
- 11.2.1 Fujitsu Limited
- 11.2.1.1. Overview
- 11.2.1.2. Products
- 11.2.1.3. SWOT Analysis
- 11.2.1.4. Recent Developments
- 11.2.1.5. Financials (Based on Availability)
- 11.2.2 Intel Corporation
- 11.2.2.1. Overview
- 11.2.2.2. Products
- 11.2.2.3. SWOT Analysis
- 11.2.2.4. Recent Developments
- 11.2.2.5. Financials (Based on Availability)
- 11.2.3 Renesas Electronics Corporation
- 11.2.3.1. Overview
- 11.2.3.2. Products
- 11.2.3.3. SWOT Analysis
- 11.2.3.4. Recent Developments
- 11.2.3.5. Financials (Based on Availability)
- 11.2.4 Abbott Laboratories
- 11.2.4.1. Overview
- 11.2.4.2. Products
- 11.2.4.3. SWOT Analysis
- 11.2.4.4. Recent Developments
- 11.2.4.5. Financials (Based on Availability)
- 11.2.5 Ericsson
- 11.2.5.1. Overview
- 11.2.5.2. Products
- 11.2.5.3. SWOT Analysis
- 11.2.5.4. Recent Developments
- 11.2.5.5. Financials (Based on Availability)
- 11.2.6 Telefonica
- 11.2.6.1. Overview
- 11.2.6.2. Products
- 11.2.6.3. SWOT Analysis
- 11.2.6.4. Recent Developments
- 11.2.6.5. Financials (Based on Availability)
- 11.2.7 IBM Corporation
- 11.2.7.1. Overview
- 11.2.7.2. Products
- 11.2.7.3. SWOT Analysis
- 11.2.7.4. Recent Developments
- 11.2.7.5. Financials (Based on Availability)
- 11.2.8 Jawbone
- 11.2.8.1. Overview
- 11.2.8.2. Products
- 11.2.8.3. SWOT Analysis
- 11.2.8.4. Recent Developments
- 11.2.8.5. Financials (Based on Availability)
- 11.2.9 Bluetooth SIG
- 11.2.9.1. Overview
- 11.2.9.2. Products
- 11.2.9.3. SWOT Analysis
- 11.2.9.4. Recent Developments
- 11.2.9.5. Financials (Based on Availability)
- 11.2.10 General Electric
- 11.2.10.1. Overview
- 11.2.10.2. Products
- 11.2.10.3. SWOT Analysis
- 11.2.10.4. Recent Developments
- 11.2.10.5. Financials (Based on Availability)
- 11.2.11 ST Microelectronics.
- 11.2.11.1. Overview
- 11.2.11.2. Products
- 11.2.11.3. SWOT Analysis
- 11.2.11.4. Recent Developments
- 11.2.11.5. Financials (Based on Availability)
- 11.2.1 Fujitsu Limited
List of Figures
- Figure 1: Global Body Area Network Revenue Breakdown (undefined, %) by Region 2025 & 2033
- Figure 2: North America Body Area Network Revenue (undefined), by Application 2025 & 2033
- Figure 3: North America Body Area Network Revenue Share (%), by Application 2025 & 2033
- Figure 4: North America Body Area Network Revenue (undefined), by Type 2025 & 2033
- Figure 5: North America Body Area Network Revenue Share (%), by Type 2025 & 2033
- Figure 6: North America Body Area Network Revenue (undefined), by Country 2025 & 2033
- Figure 7: North America Body Area Network Revenue Share (%), by Country 2025 & 2033
- Figure 8: South America Body Area Network Revenue (undefined), by Application 2025 & 2033
- Figure 9: South America Body Area Network Revenue Share (%), by Application 2025 & 2033
- Figure 10: South America Body Area Network Revenue (undefined), by Type 2025 & 2033
- Figure 11: South America Body Area Network Revenue Share (%), by Type 2025 & 2033
- Figure 12: South America Body Area Network Revenue (undefined), by Country 2025 & 2033
- Figure 13: South America Body Area Network Revenue Share (%), by Country 2025 & 2033
- Figure 14: Europe Body Area Network Revenue (undefined), by Application 2025 & 2033
- Figure 15: Europe Body Area Network Revenue Share (%), by Application 2025 & 2033
- Figure 16: Europe Body Area Network Revenue (undefined), by Type 2025 & 2033
- Figure 17: Europe Body Area Network Revenue Share (%), by Type 2025 & 2033
- Figure 18: Europe Body Area Network Revenue (undefined), by Country 2025 & 2033
- Figure 19: Europe Body Area Network Revenue Share (%), by Country 2025 & 2033
- Figure 20: Middle East & Africa Body Area Network Revenue (undefined), by Application 2025 & 2033
- Figure 21: Middle East & Africa Body Area Network Revenue Share (%), by Application 2025 & 2033
- Figure 22: Middle East & Africa Body Area Network Revenue (undefined), by Type 2025 & 2033
- Figure 23: Middle East & Africa Body Area Network Revenue Share (%), by Type 2025 & 2033
- Figure 24: Middle East & Africa Body Area Network Revenue (undefined), by Country 2025 & 2033
- Figure 25: Middle East & Africa Body Area Network Revenue Share (%), by Country 2025 & 2033
- Figure 26: Asia Pacific Body Area Network Revenue (undefined), by Application 2025 & 2033
- Figure 27: Asia Pacific Body Area Network Revenue Share (%), by Application 2025 & 2033
- Figure 28: Asia Pacific Body Area Network Revenue (undefined), by Type 2025 & 2033
- Figure 29: Asia Pacific Body Area Network Revenue Share (%), by Type 2025 & 2033
- Figure 30: Asia Pacific Body Area Network Revenue (undefined), by Country 2025 & 2033
- Figure 31: Asia Pacific Body Area Network Revenue Share (%), by Country 2025 & 2033
List of Tables
- Table 1: Global Body Area Network Revenue undefined Forecast, by Application 2020 & 2033
- Table 2: Global Body Area Network Revenue undefined Forecast, by Type 2020 & 2033
- Table 3: Global Body Area Network Revenue undefined Forecast, by Region 2020 & 2033
- Table 4: Global Body Area Network Revenue undefined Forecast, by Application 2020 & 2033
- Table 5: Global Body Area Network Revenue undefined Forecast, by Type 2020 & 2033
- Table 6: Global Body Area Network Revenue undefined Forecast, by Country 2020 & 2033
- Table 7: United States Body Area Network Revenue (undefined) Forecast, by Application 2020 & 2033
- Table 8: Canada Body Area Network Revenue (undefined) Forecast, by Application 2020 & 2033
- Table 9: Mexico Body Area Network Revenue (undefined) Forecast, by Application 2020 & 2033
- Table 10: Global Body Area Network Revenue undefined Forecast, by Application 2020 & 2033
- Table 11: Global Body Area Network Revenue undefined Forecast, by Type 2020 & 2033
- Table 12: Global Body Area Network Revenue undefined Forecast, by Country 2020 & 2033
- Table 13: Brazil Body Area Network Revenue (undefined) Forecast, by Application 2020 & 2033
- Table 14: Argentina Body Area Network Revenue (undefined) Forecast, by Application 2020 & 2033
- Table 15: Rest of South America Body Area Network Revenue (undefined) Forecast, by Application 2020 & 2033
- Table 16: Global Body Area Network Revenue undefined Forecast, by Application 2020 & 2033
- Table 17: Global Body Area Network Revenue undefined Forecast, by Type 2020 & 2033
- Table 18: Global Body Area Network Revenue undefined Forecast, by Country 2020 & 2033
- Table 19: United Kingdom Body Area Network Revenue (undefined) Forecast, by Application 2020 & 2033
- Table 20: Germany Body Area Network Revenue (undefined) Forecast, by Application 2020 & 2033
- Table 21: France Body Area Network Revenue (undefined) Forecast, by Application 2020 & 2033
- Table 22: Italy Body Area Network Revenue (undefined) Forecast, by Application 2020 & 2033
- Table 23: Spain Body Area Network Revenue (undefined) Forecast, by Application 2020 & 2033
- Table 24: Russia Body Area Network Revenue (undefined) Forecast, by Application 2020 & 2033
- Table 25: Benelux Body Area Network Revenue (undefined) Forecast, by Application 2020 & 2033
- Table 26: Nordics Body Area Network Revenue (undefined) Forecast, by Application 2020 & 2033
- Table 27: Rest of Europe Body Area Network Revenue (undefined) Forecast, by Application 2020 & 2033
- Table 28: Global Body Area Network Revenue undefined Forecast, by Application 2020 & 2033
- Table 29: Global Body Area Network Revenue undefined Forecast, by Type 2020 & 2033
- Table 30: Global Body Area Network Revenue undefined Forecast, by Country 2020 & 2033
- Table 31: Turkey Body Area Network Revenue (undefined) Forecast, by Application 2020 & 2033
- Table 32: Israel Body Area Network Revenue (undefined) Forecast, by Application 2020 & 2033
- Table 33: GCC Body Area Network Revenue (undefined) Forecast, by Application 2020 & 2033
- Table 34: North Africa Body Area Network Revenue (undefined) Forecast, by Application 2020 & 2033
- Table 35: South Africa Body Area Network Revenue (undefined) Forecast, by Application 2020 & 2033
- Table 36: Rest of Middle East & Africa Body Area Network Revenue (undefined) Forecast, by Application 2020 & 2033
- Table 37: Global Body Area Network Revenue undefined Forecast, by Application 2020 & 2033
- Table 38: Global Body Area Network Revenue undefined Forecast, by Type 2020 & 2033
- Table 39: Global Body Area Network Revenue undefined Forecast, by Country 2020 & 2033
- Table 40: China Body Area Network Revenue (undefined) Forecast, by Application 2020 & 2033
- Table 41: India Body Area Network Revenue (undefined) Forecast, by Application 2020 & 2033
- Table 42: Japan Body Area Network Revenue (undefined) Forecast, by Application 2020 & 2033
- Table 43: South Korea Body Area Network Revenue (undefined) Forecast, by Application 2020 & 2033
- Table 44: ASEAN Body Area Network Revenue (undefined) Forecast, by Application 2020 & 2033
- Table 45: Oceania Body Area Network Revenue (undefined) Forecast, by Application 2020 & 2033
- Table 46: Rest of Asia Pacific Body Area Network Revenue (undefined) Forecast, by Application 2020 & 2033
Frequently Asked Questions
1. What is the projected Compound Annual Growth Rate (CAGR) of the Body Area Network?
The projected CAGR is approximately 11.59%.
2. Which companies are prominent players in the Body Area Network?
Key companies in the market include Fujitsu Limited, Intel Corporation, Renesas Electronics Corporation, Abbott Laboratories, Ericsson, Telefonica, IBM Corporation, Jawbone, Bluetooth SIG, General Electric, ST Microelectronics..
3. What are the main segments of the Body Area Network?
The market segments include Application, Type.
4. Can you provide details about the market size?
The market size is estimated to be USD XXX N/A as of 2022.
5. What are some drivers contributing to market growth?
N/A
6. What are the notable trends driving market growth?
N/A
7. Are there any restraints impacting market growth?
N/A
8. Can you provide examples of recent developments in the market?
N/A
9. What pricing options are available for accessing the report?
Pricing options include single-user, multi-user, and enterprise licenses priced at USD 2900.00, USD 4350.00, and USD 5800.00 respectively.
10. Is the market size provided in terms of value or volume?
The market size is provided in terms of value, measured in N/A.
11. Are there any specific market keywords associated with the report?
Yes, the market keyword associated with the report is "Body Area Network," which aids in identifying and referencing the specific market segment covered.
12. How do I determine which pricing option suits my needs best?
The pricing options vary based on user requirements and access needs. Individual users may opt for single-user licenses, while businesses requiring broader access may choose multi-user or enterprise licenses for cost-effective access to the report.
13. Are there any additional resources or data provided in the Body Area Network report?
While the report offers comprehensive insights, it's advisable to review the specific contents or supplementary materials provided to ascertain if additional resources or data are available.
14. How can I stay updated on further developments or reports in the Body Area Network?
To stay informed about further developments, trends, and reports in the Body Area Network, consider subscribing to industry newsletters, following relevant companies and organizations, or regularly checking reputable industry news sources and publications.
Methodology
Step 1 - Identification of Relevant Samples Size from Population Database


Step 2 - Approaches for Defining Global Market Size (Value, Volume* & Price*)

Note*: In applicable scenarios
Step 3 - Data Sources
Primary Research
- Web Analytics
- Survey Reports
- Research Institute
- Latest Research Reports
- Opinion Leaders
Secondary Research
- Annual Reports
- White Paper
- Latest Press Release
- Industry Association
- Paid Database
- Investor Presentations

Step 4 - Data Triangulation
Involves using different sources of information in order to increase the validity of a study
These sources are likely to be stakeholders in a program - participants, other researchers, program staff, other community members, and so on.
Then we put all data in single framework & apply various statistical tools to find out the dynamic on the market.
During the analysis stage, feedback from the stakeholder groups would be compared to determine areas of agreement as well as areas of divergence