

Key Insights
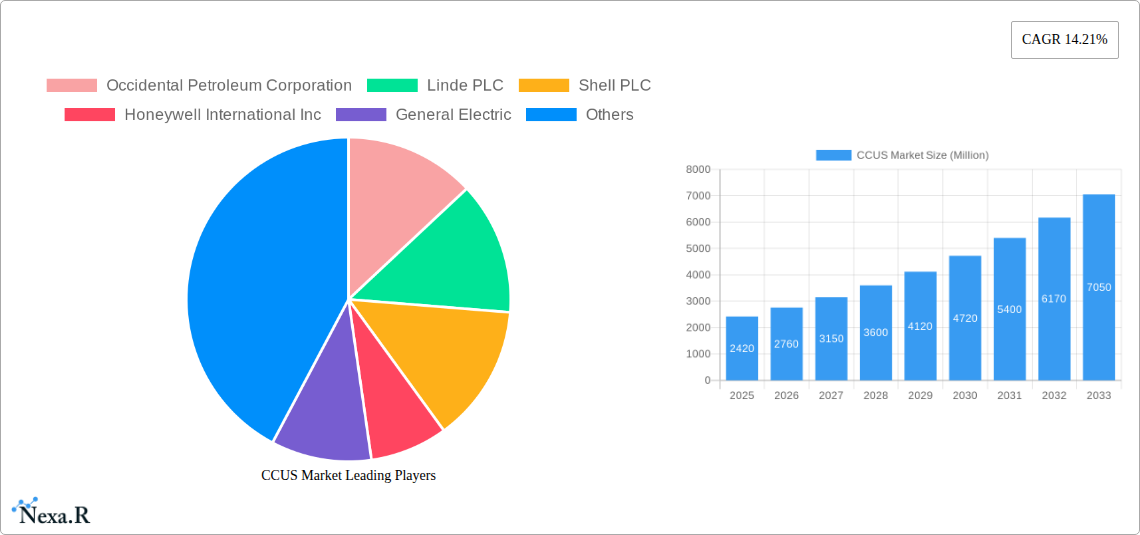
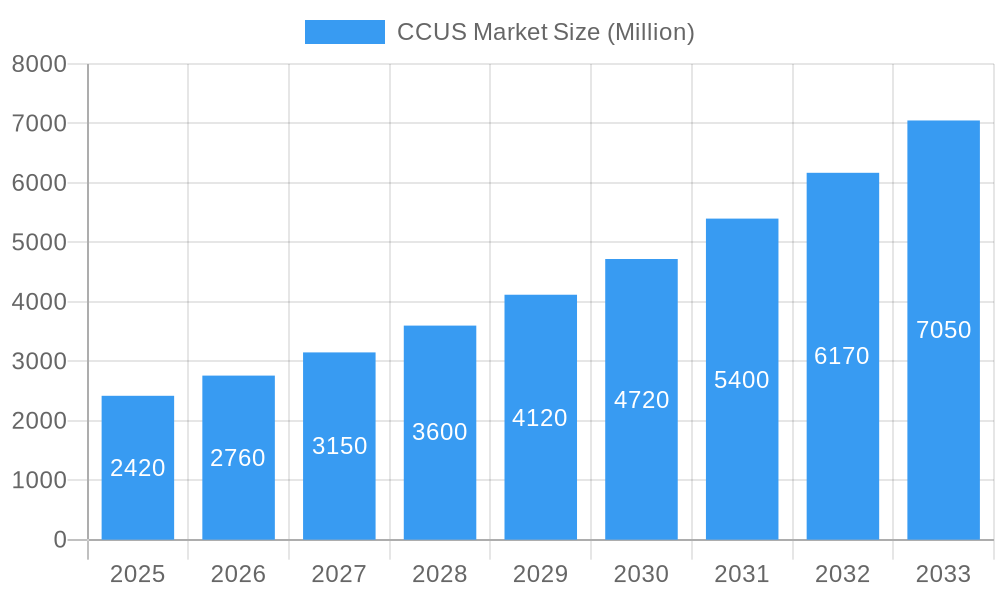
The Carbon Capture, Utilization, and Storage (CCUS) market is experiencing robust growth, projected to reach \$2.42 billion in 2025 and exhibiting a Compound Annual Growth Rate (CAGR) of 14.21% from 2025 to 2033. This expansion is driven by increasing global efforts to mitigate climate change and stringent environmental regulations aimed at reducing greenhouse gas emissions. The energy sector, specifically oil and gas, coal and biomass power plants, and industrial processes like iron and steel and cement manufacturing, are key drivers, as these industries face significant pressure to decarbonize. Technological advancements in pre-combustion, oxy-fuel combustion, and post-combustion capture methods are further fueling market growth, offering more efficient and cost-effective solutions for carbon capture. North America, particularly the United States, is expected to hold a significant market share due to robust government initiatives and a large concentration of energy-intensive industries. However, high initial capital investment costs and the technical complexities associated with CCUS deployment remain significant restraints. The market's future trajectory will depend significantly on the continued development of supportive policies, technological innovation reducing operational costs, and the increasing economic viability of carbon utilization projects.
CCUS Market Market Size (In Billion)
The competitive landscape is characterized by a mix of established oil and gas companies, engineering firms, and specialized technology providers. Major players like Occidental Petroleum, Linde PLC, Shell PLC, and Honeywell are actively investing in CCUS technologies and projects, demonstrating the significant long-term potential. The geographic distribution of market activity is expected to diversify over the forecast period, with Europe and Asia-Pacific regions witnessing increasing adoption driven by their ambitious climate targets. Ongoing research and development efforts focused on improving capture efficiency, reducing energy consumption, and exploring diverse carbon utilization pathways will be pivotal in shaping the future growth and sustainability of the CCUS market. Furthermore, the successful commercialization of carbon capture and utilization technologies beyond simple storage, creating valuable products and generating revenue streams, will be crucial in accelerating market penetration and achieving wider industry adoption.
CCUS Market Company Market Share
CCUS Market Report: A Comprehensive Analysis (2019-2033)
This comprehensive report provides an in-depth analysis of the Carbon Capture, Utilization, and Storage (CCUS) market, encompassing market dynamics, growth trends, regional landscapes, and key player strategies. With a study period spanning 2019-2033, a base year of 2025, and a forecast period of 2025-2033, this report is an essential resource for industry professionals, investors, and policymakers seeking to understand and capitalize on the burgeoning CCUS market. The report is valued at xx Million units.
CCUS Market Dynamics & Structure
The CCUS market is characterized by a moderately concentrated structure, with major players like Occidental Petroleum Corporation, Linde PLC, Shell PLC, and Honeywell International Inc. holding significant market share. However, the market is witnessing increased participation from smaller companies and startups, driving innovation and competition. The market size in 2025 is estimated at xx Million units.
- Technological Innovation: Continuous advancements in capture technologies (pre-combustion, post-combustion, oxy-fuel), transportation infrastructure, and storage solutions are key drivers. Innovation barriers include high capital costs and the need for efficient, scalable technologies.
- Regulatory Frameworks: Stringent emission reduction targets and supportive government policies (e.g., carbon pricing, tax credits) are significantly boosting market growth. However, inconsistencies in regulatory frameworks across different regions pose a challenge.
- Competitive Product Substitutes: While CCUS is currently the leading technology for large-scale CO2 emission reduction, alternative technologies like direct air capture (DAC) and renewable energy sources represent competitive pressures.
- End-User Demographics: The oil and gas sector is currently the largest end-user, but growing demand from power generation (coal and biomass), cement, chemical, and iron and steel industries is expanding the market.
- M&A Trends: The last five years have witnessed a significant increase in M&A activity, with xx deals valued at approximately xx Million units, primarily focused on technology acquisition, geographical expansion, and securing access to CO2 storage resources.
CCUS Market Growth Trends & Insights
The global CCUS market is experiencing robust growth, driven by increasing awareness of climate change, tightening environmental regulations, and technological advancements. The market size is projected to reach xx Million units by 2033, exhibiting a Compound Annual Growth Rate (CAGR) of xx% during the forecast period. This growth is fueled by several factors, including:
- Rising adoption rates across various end-user industries, particularly in regions with stringent emission reduction targets. Market penetration is expected to increase from xx% in 2025 to xx% by 2033.
- Technological advancements, particularly in improving the efficiency and cost-effectiveness of CCUS technologies. Significant cost reductions in capture and transportation are driving wider adoption.
- Shifts in consumer behavior, with growing demand for environmentally friendly products and services, influencing corporate sustainability strategies and investments in CCUS solutions.
Dominant Regions, Countries, or Segments in CCUS Market
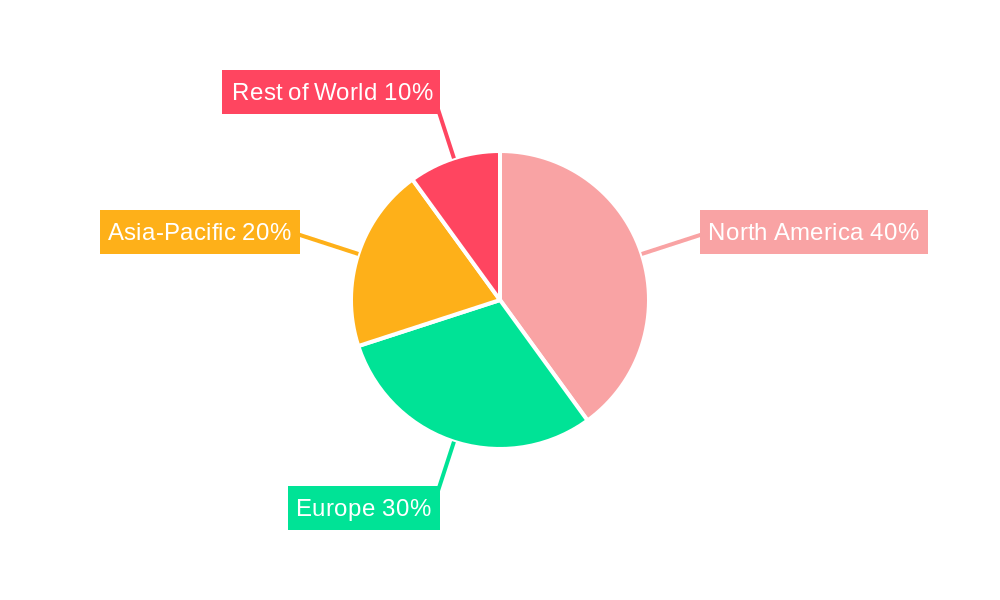
North America and Europe currently dominate the CCUS market, driven by supportive government policies, established infrastructure, and significant investments in large-scale projects. However, Asia-Pacific is poised for rapid growth, fueled by increasing industrialization and government initiatives to mitigate climate change.
By End-user Industry:
- Oil and Gas: Remains the largest segment, driven by enhanced oil recovery (EOR) applications and regulations targeting methane emissions.
- Power Generation (Coal & Biomass): Significant growth is anticipated as coal-fired power plants seek to reduce their environmental footprint.
- Other Industries (Iron & Steel, Cement, Chemical): These sectors are increasingly adopting CCUS to meet emission reduction targets and enhance their sustainability profiles.
By Technology:
- Post-combustion Capture: Currently holds the largest market share due to its adaptability to existing power plants and industrial facilities.
- Pre-combustion Capture: Expected to experience substantial growth driven by its higher capture efficiency compared to post-combustion.
- Oxy-fuel Combustion Capture: While less widely deployed, this technology offers the potential for high capture rates and is gaining traction in specific industrial applications.
CCUS Market Product Landscape
The Carbon Capture, Utilization, and Storage (CCUS) market presents a dynamic and expanding ecosystem of products and services designed to address industrial emissions. This landscape encompasses a broad spectrum of technologies and solutions, including advanced CO2 capture methods such as innovative solvent-based systems, highly selective membrane technologies, and efficient solid sorbent adsorption processes. Complementing capture are robust compression and transportation infrastructure, featuring dedicated pipeline networks and advanced maritime solutions for large-scale CO2 movement. Crucially, the market offers diverse storage solutions, leveraging the proven security of geological formations, particularly deep saline aquifers, and other secure subsurface reservoirs. Recent advancements are relentlessly pushing the boundaries, focusing on significant improvements in capture efficiency, substantial reductions in the energy penalty associated with capture, and the continuous enhancement of the safety, environmental integrity, and long-term reliability of CO2 storage sites. Companies are actively differentiating themselves by developing proprietary technologies that offer superior performance, compelling cost-effectiveness, and seamless integration capabilities with existing industrial facilities, making CCUS a more accessible and attractive solution for a wider range of industries.
Key Drivers, Barriers & Challenges in CCUS Market
Key Drivers:
- The global push towards decarbonization is creating an increasingly stringent regulatory environment, with carbon pricing mechanisms and emissions standards becoming more prevalent. These policy interventions are powerful catalysts for the adoption of CCUS technologies across various industrial sectors.
- There is a heightened global awareness and urgency surrounding climate change, driving the demand for effective and scalable emission reduction strategies. CCUS is recognized as a vital tool in achieving these ambitious climate goals.
- Governments worldwide are recognizing the strategic importance of CCUS and are providing substantial incentives, grants, and financial support to de-risk projects and stimulate market growth. This public sector backing is crucial for accelerating deployment.
- The growing focus on a circular economy and the potential for CO2 utilization in valuable products (e.g., chemicals, fuels, building materials) is transforming CCUS from purely a mitigation strategy to one with economic value creation potential.
- The increasing corporate commitment to Environmental, Social, and Governance (ESG) principles is compelling businesses to actively seek solutions for reducing their carbon footprint, with CCUS emerging as a leading option for hard-to-abate emissions.
Key Challenges:
- The significant upfront capital expenditure required for the development and implementation of CCUS projects remains a primary barrier to widespread adoption. This high initial investment can be particularly prohibitive for smaller enterprises and projects with uncertain long-term revenue streams.
- Despite ongoing innovation, achieving consistently high capture efficiencies while simultaneously minimizing energy consumption remains a critical technological hurdle. Further R&D is needed to make these processes more economical and energy-efficient.
- Navigating complex and evolving regulatory frameworks, obtaining necessary permits for CO2 transport and geological storage, and ensuring long-term monitoring and verification requirements can lead to project delays and increase overall development costs.
- Public perception and the need for robust community engagement are essential for securing social license to operate for CCUS projects, especially concerning CO2 storage. Addressing concerns about safety and environmental impact is paramount.
- The establishment of a comprehensive and efficient CO2 transportation and storage infrastructure, particularly in regions with dispersed emission sources, requires significant investment and coordinated planning.
Emerging Opportunities in CCUS Market
- CCUS in developing economies: As many developing nations experience rapid industrialization and economic growth, their emission levels are also escalating. These regions present substantial untapped potential for CCUS deployment, offering a chance to leapfrog traditional carbon-intensive development pathways. Early strategic investments in CCUS infrastructure and technology transfer can position these economies for sustainable industrialization.
- Integration with other decarbonization technologies: The true power of CCUS lies in its synergistic potential. Emerging opportunities involve integrating CCUS with renewable energy sources (e.g., green hydrogen production coupled with CCS), advanced energy storage systems, and bioenergy with carbon capture and storage (BECCS) to create hybrid solutions that deliver net-negative emissions and enhanced energy system resilience.
- CCUS for direct air capture (DAC): The development of innovative direct air capture technologies, which can extract CO2 directly from the atmosphere, is opening up entirely new market possibilities. This technology is crucial for addressing historical emissions and achieving ambitious climate targets, offering a pathway to carbon removal and potential for negative emissions.
- CO2 utilization for high-value products: Beyond storage, the utilization of captured CO2 as a feedstock for producing chemicals, advanced materials, synthetic fuels, and even concrete presents a significant economic opportunity. This "CCU" aspect can offset capture costs and create new revenue streams, fostering a more circular carbon economy.
- Decarbonization of hard-to-abate sectors: CCUS is becoming indispensable for decarbonizing heavy industries like cement, steel, chemicals, and refining, where emissions are inherent to the industrial process. Tailored CCUS solutions for these sectors are a major growth area.
Growth Accelerators in the CCUS Market Industry
The CCUS market is poised for significant acceleration, driven by a confluence of factors. Breakthrough technological advancements in developing more efficient, scalable, and cost-effective capture and storage solutions are fundamental to unlocking broader market adoption. Innovations in materials science for sorbents, advanced membrane designs, and optimized geological modeling are key. Equally critical are strategic partnerships and collaborations. When energy companies, leading technology providers, industrial emitters, and government agencies join forces, they can de-risk projects, share expertise, and accelerate the pace of project development and deployment. Furthermore, the expansion into new geographical markets, particularly in developing economies with substantial industrial emissions and growing climate commitments, presents considerable long-term growth potential. Facilitating this expansion requires robust policy support, knowledge transfer, and the development of localized CCUS ecosystems.
Key Players Shaping the CCUS Market Market
- Occidental Petroleum Corporation
- Linde PLC
- Shell PLC
- Honeywell International Inc
- General Electric
- Exxon Mobil Corporation
- Japan CCS Co Ltd
- SLB
- Fluor Corporation
- Baker Hughes Company
- Halliburton
- Aker Solutions
- Dakota Gasification Company
- JX Nippon Oil & Gas Exploration Corporation
- Siemens Energy
- Air Liquide
- Mitsubishi Heavy Industries Ltd
Notable Milestones in CCUS Market Sector
- March 2024: JX Nippon Oil & Gas Exploration Corporation and Chevron New Energies took a significant step towards global CO2 management by signing a memorandum of understanding (MOU). This agreement aims to assess the feasibility of CO2 export from Japan to emerging Carbon Capture and Storage (CCS) initiatives across the Asia-Pacific region, signifying an expansion of regional CCS collaboration and market opportunities.
- March 2024: Shell and ONGC (Oil and Natural Gas Corporation) deepened their commitment to CCUS in India through a collaborative storage study and Enhanced Oil Recovery (EOR) assessment. This partnership highlights the dual benefits of CCUS as both a crucial emissions mitigation tool and a method to optimize existing oil production, promoting its adoption in a key energy market.
- February 2024: Fluor Corporation and Chevron New Energies solidified their technological partnership with a license agreement for Fluor's proprietary Econamine FG PlusSM technology. This agreement is set to be implemented at Chevron's Eastridge Cogeneration facility, demonstrating a clear trend towards the increasing adoption and deployment of proven, commercially available CCUS technologies by major energy players.
- January 2024: The United States Department of Energy (DOE) announced significant funding allocations for multiple CCUS demonstration projects, underscoring government commitment to advancing the technology from pilot to commercial scale. This injection of capital is expected to accelerate the development and deployment of diverse CCUS solutions across various industrial sectors.
- December 2023: A consortium of industrial players and research institutions launched a large-scale CCUS hub initiative in Europe, aiming to capture CO2 from multiple sources and transport it for offshore geological storage. This coordinated effort exemplifies the growing trend towards developing integrated CCUS infrastructure to achieve significant emissions reductions at a regional level.
In-Depth CCUS Market Market Outlook
The CCUS market is poised for substantial long-term growth, driven by accelerating climate action, technological advancements, and supportive policy frameworks. Strategic opportunities lie in developing innovative technologies, securing access to large-scale CO2 storage resources, and expanding into emerging markets. The focus on reducing costs, improving efficiency, and simplifying the deployment process will shape the future of this rapidly evolving sector.
CCUS Market Segmentation
-
1. Technology
- 1.1. Pre-combustion Capture
- 1.2. Oxy-fuel Combustion Capture
- 1.3. Post-combustion Capture
-
2. End-user Industry
- 2.1. Oil and Gas
- 2.2. Coal and Biomass Power Plant
- 2.3. Iron and Steel
- 2.4. Chemical
- 2.5. Cement
CCUS Market Segmentation By Geography
-
1. Asia Pacific
- 1.1. China
- 1.2. India
- 1.3. Japan
- 1.4. Australia
- 1.5. Rest of Asia Pacific
-
2. North America
- 2.1. United States
- 2.2. Canada
- 2.3. Mexico
-
3. Europe
- 3.1. Germany
- 3.2. United Kingdom
- 3.3. France
- 3.4. Norway
- 3.5. Netherlands
- 3.6. Rest of Europe
- 4. Rest of the World
CCUS Market Regional Market Share
Geographic Coverage of CCUS Market
CCUS Market REPORT HIGHLIGHTS
| Aspects | Details |
|---|---|
| Study Period | 2020-2034 |
| Base Year | 2025 |
| Estimated Year | 2026 |
| Forecast Period | 2026-2034 |
| Historical Period | 2020-2025 |
| Growth Rate | CAGR of 14.21% from 2020-2034 |
| Segmentation |
|
Table of Contents
- 1. Introduction
- 1.1. Research Scope
- 1.2. Market Segmentation
- 1.3. Research Objective
- 1.4. Definitions and Assumptions
- 2. Executive Summary
- 2.1. Market Snapshot
- 3. Market Dynamics
- 3.1. Market Drivers
- 3.2. Market Restrains
- 3.3. Market Trends
- 3.4. Market Opportunities
- 4. Market Factor Analysis
- 4.1. Porters Five Forces
- 4.1.1. Bargaining Power of Suppliers
- 4.1.2. Bargaining Power of Buyers
- 4.1.3. Threat of New Entrants
- 4.1.4. Threat of Substitutes
- 4.1.5. Competitive Rivalry
- 4.2. PESTEL analysis
- 4.3. BCG Analysis
- 4.3.1. Stars (High Growth, High Market Share)
- 4.3.2. Cash Cows (Low Growth, High Market Share)
- 4.3.3. Question Mark (High Growth, Low Market Share)
- 4.3.4. Dogs (Low Growth, Low Market Share)
- 4.4. Ansoff Matrix Analysis
- 4.5. Supply Chain Analysis
- 4.6. Regulatory Landscape
- 4.7. Current Market Potential and Opportunity Assessment (TAM–SAM–SOM Framework)
- 4.8. NRP Analyst Note
- 4.1. Porters Five Forces
- 5. Market Analysis, Insights and Forecast 2021-2033
- 5.1. Market Analysis, Insights and Forecast - by Technology
- 5.1.1. Pre-combustion Capture
- 5.1.2. Oxy-fuel Combustion Capture
- 5.1.3. Post-combustion Capture
- 5.2. Market Analysis, Insights and Forecast - by End-user Industry
- 5.2.1. Oil and Gas
- 5.2.2. Coal and Biomass Power Plant
- 5.2.3. Iron and Steel
- 5.2.4. Chemical
- 5.2.5. Cement
- 5.3. Market Analysis, Insights and Forecast - by Region
- 5.3.1. Asia Pacific
- 5.3.2. North America
- 5.3.3. Europe
- 5.3.4. Rest of the World
- 5.1. Market Analysis, Insights and Forecast - by Technology
- 6. CCUS Market Analysis, Insights and Forecast, 2021-2033
- 6.1. Market Analysis, Insights and Forecast - by Technology
- 6.1.1. Pre-combustion Capture
- 6.1.2. Oxy-fuel Combustion Capture
- 6.1.3. Post-combustion Capture
- 6.2. Market Analysis, Insights and Forecast - by End-user Industry
- 6.2.1. Oil and Gas
- 6.2.2. Coal and Biomass Power Plant
- 6.2.3. Iron and Steel
- 6.2.4. Chemical
- 6.2.5. Cement
- 6.1. Market Analysis, Insights and Forecast - by Technology
- 7. Asia Pacific CCUS Market Analysis, Insights and Forecast, 2020-2032
- 7.1. Market Analysis, Insights and Forecast - by Technology
- 7.1.1. Pre-combustion Capture
- 7.1.2. Oxy-fuel Combustion Capture
- 7.1.3. Post-combustion Capture
- 7.2. Market Analysis, Insights and Forecast - by End-user Industry
- 7.2.1. Oil and Gas
- 7.2.2. Coal and Biomass Power Plant
- 7.2.3. Iron and Steel
- 7.2.4. Chemical
- 7.2.5. Cement
- 7.1. Market Analysis, Insights and Forecast - by Technology
- 8. North America CCUS Market Analysis, Insights and Forecast, 2020-2032
- 8.1. Market Analysis, Insights and Forecast - by Technology
- 8.1.1. Pre-combustion Capture
- 8.1.2. Oxy-fuel Combustion Capture
- 8.1.3. Post-combustion Capture
- 8.2. Market Analysis, Insights and Forecast - by End-user Industry
- 8.2.1. Oil and Gas
- 8.2.2. Coal and Biomass Power Plant
- 8.2.3. Iron and Steel
- 8.2.4. Chemical
- 8.2.5. Cement
- 8.1. Market Analysis, Insights and Forecast - by Technology
- 9. Europe CCUS Market Analysis, Insights and Forecast, 2020-2032
- 9.1. Market Analysis, Insights and Forecast - by Technology
- 9.1.1. Pre-combustion Capture
- 9.1.2. Oxy-fuel Combustion Capture
- 9.1.3. Post-combustion Capture
- 9.2. Market Analysis, Insights and Forecast - by End-user Industry
- 9.2.1. Oil and Gas
- 9.2.2. Coal and Biomass Power Plant
- 9.2.3. Iron and Steel
- 9.2.4. Chemical
- 9.2.5. Cement
- 9.1. Market Analysis, Insights and Forecast - by Technology
- 10. Rest of the World CCUS Market Analysis, Insights and Forecast, 2020-2032
- 10.1. Market Analysis, Insights and Forecast - by Technology
- 10.1.1. Pre-combustion Capture
- 10.1.2. Oxy-fuel Combustion Capture
- 10.1.3. Post-combustion Capture
- 10.2. Market Analysis, Insights and Forecast - by End-user Industry
- 10.2.1. Oil and Gas
- 10.2.2. Coal and Biomass Power Plant
- 10.2.3. Iron and Steel
- 10.2.4. Chemical
- 10.2.5. Cement
- 10.1. Market Analysis, Insights and Forecast - by Technology
- 11. Competitive Analysis
- 11.1. Company Profiles
- 11.1.1 Occidental Petroleum Corporation
- 11.1.1.1. Company Overview
- 11.1.1.2. Products
- 11.1.1.3. Company Financials
- 11.1.1.4. SWOT Analysis
- 11.1.2 Linde PLC
- 11.1.2.1. Company Overview
- 11.1.2.2. Products
- 11.1.2.3. Company Financials
- 11.1.2.4. SWOT Analysis
- 11.1.3 Shell PLC
- 11.1.3.1. Company Overview
- 11.1.3.2. Products
- 11.1.3.3. Company Financials
- 11.1.3.4. SWOT Analysis
- 11.1.4 Honeywell International Inc
- 11.1.4.1. Company Overview
- 11.1.4.2. Products
- 11.1.4.3. Company Financials
- 11.1.4.4. SWOT Analysis
- 11.1.5 General Electric
- 11.1.5.1. Company Overview
- 11.1.5.2. Products
- 11.1.5.3. Company Financials
- 11.1.5.4. SWOT Analysis
- 11.1.6 Exxon Mobil Corporation
- 11.1.6.1. Company Overview
- 11.1.6.2. Products
- 11.1.6.3. Company Financials
- 11.1.6.4. SWOT Analysis
- 11.1.7 Japan CCS Co Ltd
- 11.1.7.1. Company Overview
- 11.1.7.2. Products
- 11.1.7.3. Company Financials
- 11.1.7.4. SWOT Analysis
- 11.1.8 SLB*List Not Exhaustive
- 11.1.8.1. Company Overview
- 11.1.8.2. Products
- 11.1.8.3. Company Financials
- 11.1.8.4. SWOT Analysis
- 11.1.9 Fluor Corporation
- 11.1.9.1. Company Overview
- 11.1.9.2. Products
- 11.1.9.3. Company Financials
- 11.1.9.4. SWOT Analysis
- 11.1.10 Baker Hughes Company
- 11.1.10.1. Company Overview
- 11.1.10.2. Products
- 11.1.10.3. Company Financials
- 11.1.10.4. SWOT Analysis
- 11.1.11 Halliburton
- 11.1.11.1. Company Overview
- 11.1.11.2. Products
- 11.1.11.3. Company Financials
- 11.1.11.4. SWOT Analysis
- 11.1.12 Aker Solutions
- 11.1.12.1. Company Overview
- 11.1.12.2. Products
- 11.1.12.3. Company Financials
- 11.1.12.4. SWOT Analysis
- 11.1.13 Dakota Gasification Company
- 11.1.13.1. Company Overview
- 11.1.13.2. Products
- 11.1.13.3. Company Financials
- 11.1.13.4. SWOT Analysis
- 11.1.14 JX Nippon Oil & Gas Exploration Corporation
- 11.1.14.1. Company Overview
- 11.1.14.2. Products
- 11.1.14.3. Company Financials
- 11.1.14.4. SWOT Analysis
- 11.1.15 Siemens Energy
- 11.1.15.1. Company Overview
- 11.1.15.2. Products
- 11.1.15.3. Company Financials
- 11.1.15.4. SWOT Analysis
- 11.1.16 Air Liquide
- 11.1.16.1. Company Overview
- 11.1.16.2. Products
- 11.1.16.3. Company Financials
- 11.1.16.4. SWOT Analysis
- 11.1.17 Mitsubishi Heavy Industries Ltd
- 11.1.17.1. Company Overview
- 11.1.17.2. Products
- 11.1.17.3. Company Financials
- 11.1.17.4. SWOT Analysis
- 11.1.1 Occidental Petroleum Corporation
- 11.2. Market Entropy
- 11.2.1 Company's Key Areas Served
- 11.2.2 Recent Developments
- 11.3. Company Market Share Analysis 2025
- 11.3.1 Top 5 Companies Market Share Analysis
- 11.3.2 Top 3 Companies Market Share Analysis
- 11.4. List of Potential Customers
- 12. Research Methodology
List of Figures
- Figure 1: CCUS Market Revenue Breakdown (Million, %) by Product 2025 & 2033
- Figure 2: CCUS Market Share (%) by Company 2025
List of Tables
- Table 1: CCUS Market Revenue Million Forecast, by Technology 2020 & 2033
- Table 2: CCUS Market Volume K Tons Forecast, by Technology 2020 & 2033
- Table 3: CCUS Market Revenue Million Forecast, by End-user Industry 2020 & 2033
- Table 4: CCUS Market Volume K Tons Forecast, by End-user Industry 2020 & 2033
- Table 5: CCUS Market Revenue Million Forecast, by Region 2020 & 2033
- Table 6: CCUS Market Volume K Tons Forecast, by Region 2020 & 2033
- Table 7: CCUS Market Revenue Million Forecast, by Technology 2020 & 2033
- Table 8: CCUS Market Volume K Tons Forecast, by Technology 2020 & 2033
- Table 9: CCUS Market Revenue Million Forecast, by End-user Industry 2020 & 2033
- Table 10: CCUS Market Volume K Tons Forecast, by End-user Industry 2020 & 2033
- Table 11: CCUS Market Revenue Million Forecast, by Country 2020 & 2033
- Table 12: CCUS Market Volume K Tons Forecast, by Country 2020 & 2033
- Table 13: China CCUS Market Revenue (Million) Forecast, by Application 2020 & 2033
- Table 14: China CCUS Market Volume (K Tons) Forecast, by Application 2020 & 2033
- Table 15: India CCUS Market Revenue (Million) Forecast, by Application 2020 & 2033
- Table 16: India CCUS Market Volume (K Tons) Forecast, by Application 2020 & 2033
- Table 17: Japan CCUS Market Revenue (Million) Forecast, by Application 2020 & 2033
- Table 18: Japan CCUS Market Volume (K Tons) Forecast, by Application 2020 & 2033
- Table 19: Australia CCUS Market Revenue (Million) Forecast, by Application 2020 & 2033
- Table 20: Australia CCUS Market Volume (K Tons) Forecast, by Application 2020 & 2033
- Table 21: Rest of Asia Pacific CCUS Market Revenue (Million) Forecast, by Application 2020 & 2033
- Table 22: Rest of Asia Pacific CCUS Market Volume (K Tons) Forecast, by Application 2020 & 2033
- Table 23: CCUS Market Revenue Million Forecast, by Technology 2020 & 2033
- Table 24: CCUS Market Volume K Tons Forecast, by Technology 2020 & 2033
- Table 25: CCUS Market Revenue Million Forecast, by End-user Industry 2020 & 2033
- Table 26: CCUS Market Volume K Tons Forecast, by End-user Industry 2020 & 2033
- Table 27: CCUS Market Revenue Million Forecast, by Country 2020 & 2033
- Table 28: CCUS Market Volume K Tons Forecast, by Country 2020 & 2033
- Table 29: United States CCUS Market Revenue (Million) Forecast, by Application 2020 & 2033
- Table 30: United States CCUS Market Volume (K Tons) Forecast, by Application 2020 & 2033
- Table 31: Canada CCUS Market Revenue (Million) Forecast, by Application 2020 & 2033
- Table 32: Canada CCUS Market Volume (K Tons) Forecast, by Application 2020 & 2033
- Table 33: Mexico CCUS Market Revenue (Million) Forecast, by Application 2020 & 2033
- Table 34: Mexico CCUS Market Volume (K Tons) Forecast, by Application 2020 & 2033
- Table 35: CCUS Market Revenue Million Forecast, by Technology 2020 & 2033
- Table 36: CCUS Market Volume K Tons Forecast, by Technology 2020 & 2033
- Table 37: CCUS Market Revenue Million Forecast, by End-user Industry 2020 & 2033
- Table 38: CCUS Market Volume K Tons Forecast, by End-user Industry 2020 & 2033
- Table 39: CCUS Market Revenue Million Forecast, by Country 2020 & 2033
- Table 40: CCUS Market Volume K Tons Forecast, by Country 2020 & 2033
- Table 41: Germany CCUS Market Revenue (Million) Forecast, by Application 2020 & 2033
- Table 42: Germany CCUS Market Volume (K Tons) Forecast, by Application 2020 & 2033
- Table 43: United Kingdom CCUS Market Revenue (Million) Forecast, by Application 2020 & 2033
- Table 44: United Kingdom CCUS Market Volume (K Tons) Forecast, by Application 2020 & 2033
- Table 45: France CCUS Market Revenue (Million) Forecast, by Application 2020 & 2033
- Table 46: France CCUS Market Volume (K Tons) Forecast, by Application 2020 & 2033
- Table 47: Norway CCUS Market Revenue (Million) Forecast, by Application 2020 & 2033
- Table 48: Norway CCUS Market Volume (K Tons) Forecast, by Application 2020 & 2033
- Table 49: Netherlands CCUS Market Revenue (Million) Forecast, by Application 2020 & 2033
- Table 50: Netherlands CCUS Market Volume (K Tons) Forecast, by Application 2020 & 2033
- Table 51: Rest of Europe CCUS Market Revenue (Million) Forecast, by Application 2020 & 2033
- Table 52: Rest of Europe CCUS Market Volume (K Tons) Forecast, by Application 2020 & 2033
- Table 53: CCUS Market Revenue Million Forecast, by Technology 2020 & 2033
- Table 54: CCUS Market Volume K Tons Forecast, by Technology 2020 & 2033
- Table 55: CCUS Market Revenue Million Forecast, by End-user Industry 2020 & 2033
- Table 56: CCUS Market Volume K Tons Forecast, by End-user Industry 2020 & 2033
- Table 57: CCUS Market Revenue Million Forecast, by Country 2020 & 2033
- Table 58: CCUS Market Volume K Tons Forecast, by Country 2020 & 2033
Frequently Asked Questions
1. What is the projected Compound Annual Growth Rate (CAGR) of the CCUS Market?
The projected CAGR is approximately 14.21%.
2. Which companies are prominent players in the CCUS Market?
Key companies in the market include Occidental Petroleum Corporation, Linde PLC, Shell PLC, Honeywell International Inc, General Electric, Exxon Mobil Corporation, Japan CCS Co Ltd, SLB*List Not Exhaustive, Fluor Corporation, Baker Hughes Company, Halliburton, Aker Solutions, Dakota Gasification Company, JX Nippon Oil & Gas Exploration Corporation, Siemens Energy, Air Liquide, Mitsubishi Heavy Industries Ltd.
3. What are the main segments of the CCUS Market?
The market segments include Technology, End-user Industry.
4. Can you provide details about the market size?
The market size is estimated to be USD 2.42 Million as of 2022.
5. What are some drivers contributing to market growth?
Emerging Demand for CO2 Injection Technique for Enhanced Oil Recovery (EOR); Strict Government Norms Toward GHG Emissions.
6. What are the notable trends driving market growth?
Oil and Gas Segment to Dominate the Market.
7. Are there any restraints impacting market growth?
Huge CCS Technology Implementation Costs; Growth in Shale Investments.
8. Can you provide examples of recent developments in the market?
March 2024: JX Nippon Oil & Gas Exploration Corporation and Chevron New Energies, a division of Chevron U.S.A. Inc., entered into a memorandum of understanding aimed at assessing the potential export of carbon dioxide from Japan to carbon capture and storage (CCS) initiatives situated in Australia and other nations across Asia-Pacific. This agreement enhances the company's market footprint.
9. What pricing options are available for accessing the report?
Pricing options include single-user, multi-user, and enterprise licenses priced at USD 4750, USD 5250, and USD 8750 respectively.
10. Is the market size provided in terms of value or volume?
The market size is provided in terms of value, measured in Million and volume, measured in K Tons.
11. Are there any specific market keywords associated with the report?
Yes, the market keyword associated with the report is "CCUS Market," which aids in identifying and referencing the specific market segment covered.
12. How do I determine which pricing option suits my needs best?
The pricing options vary based on user requirements and access needs. Individual users may opt for single-user licenses, while businesses requiring broader access may choose multi-user or enterprise licenses for cost-effective access to the report.
13. Are there any additional resources or data provided in the CCUS Market report?
While the report offers comprehensive insights, it's advisable to review the specific contents or supplementary materials provided to ascertain if additional resources or data are available.
14. How can I stay updated on further developments or reports in the CCUS Market?
To stay informed about further developments, trends, and reports in the CCUS Market, consider subscribing to industry newsletters, following relevant companies and organizations, or regularly checking reputable industry news sources and publications.
Methodology
Step 1 - Identification of Relevant Samples Size from Population Database


Step 2 - Approaches for Defining Global Market Size (Value, Volume* & Price*)

Note*: In applicable scenarios
Step 3 - Data Sources
Primary Research
- Web Analytics
- Survey Reports
- Research Institute
- Latest Research Reports
- Opinion Leaders
Secondary Research
- Annual Reports
- White Paper
- Latest Press Release
- Industry Association
- Paid Database
- Investor Presentations

Step 4 - Data Triangulation
Involves using different sources of information in order to increase the validity of a study
These sources are likely to be stakeholders in a program - participants, other researchers, program staff, other community members, and so on.
Then we put all data in single framework & apply various statistical tools to find out the dynamic on the market.
During the analysis stage, feedback from the stakeholder groups would be compared to determine areas of agreement as well as areas of divergence